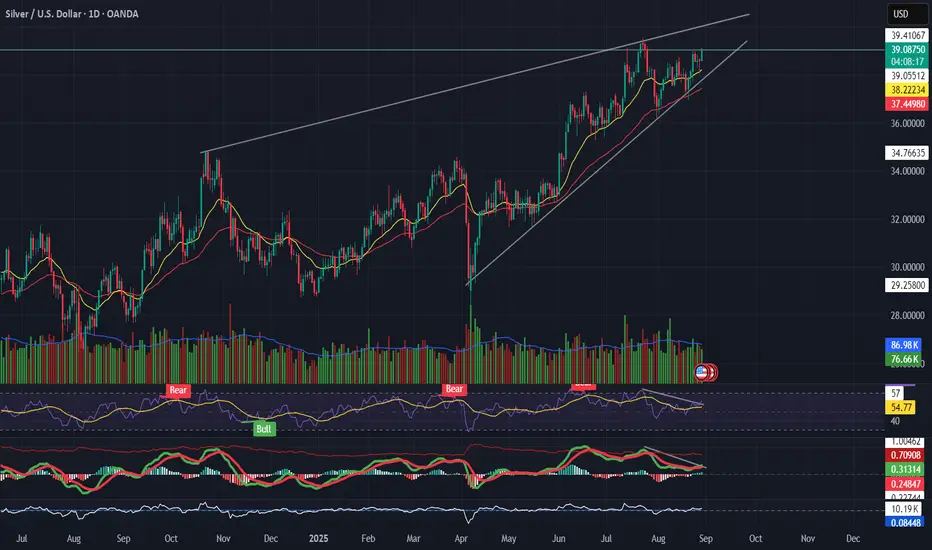
Silver (XAGUSD) Trading in a rising wedge Pattern📌 Silver (XAGUSD)
Trading in a rising wedge, pressing resistance near $39.
RSI divergence → price making higher highs, momentum not following.
MACD rolling over while price climbs = possible bearish divergence.
Support to watch: $37.3 → wedge breakdown if breached.
👉 Bullish only if $39.5 breaks with strong volume; otherwise, risk of pullback.
---
🎯 Takeaway
Silver = extended wedge → caution, momentum weak.
Breakdownanalysis
Nifty Big Gapdown expectedNifty has broken down it's crucial level with negative sentiment of market linked with tarriff war.
SL and target has been mentioned in chart.
Note: This analysis is for Educational Purpose Only. Please invest after consulting a professional financial advisor.

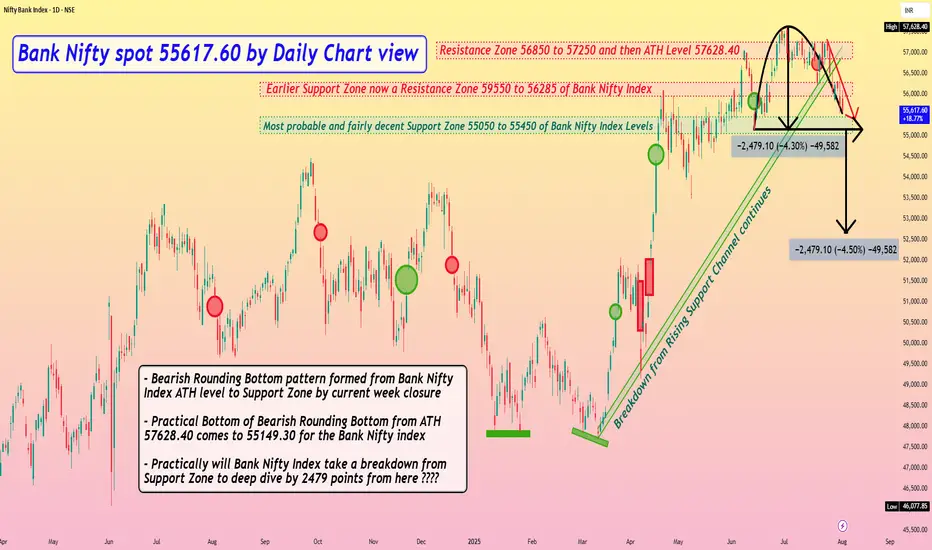
Bank Nifty spot 55617.60 by Daily Chart view - Weekly updateBank Nifty spot 55617.60 by Daily Chart view - Weekly update
- Resistance Zone 56850 to 57250 and then ATH Level 57628.40
- Earlier Support Zone now a Resistance Zone 59550 to 56285 of Bank Nifty Index
- Most probable and fairly decent Support Zone 55050 to 55450 of Bank Nifty Index Levels
- Bearish Rounding Bottom pattern formed from Bank Nifty Index ATH level to Support Zone by current week closure
- Practical Bottom for the Bearish Rounding Bottom from the ATH 57628.40 comes to 55149.30 for the Bank Nifty index
- Practically will the Bank Nifty Index take a breakdown from the Support Zone to deep dive below by 2479 points from here ????
NATIONALUM : Swing Trade#NATIONALUM #swingtrade #chartpattern #trendingstock
NATIONALUM : This is how i expect the Stock to move
>> Low PE Stock
>> Trending Setup on Daily
>> Chart pattern Visible
>> Possibility of failed breakdown and then up move
>> Good Strength & Volumes
Swing Traders can lock profit at 10% and keep trailing
Market is continuously falling and its uncertain as to how much more fall is pending, so trade only good structures with proper Risk management and proper Stop-loss Rules.
Please give a Boost or comment if u r Liking the analysis & Learning from it. Keep showing ur Love by following
Disclaimer : This is not a Trade Recommendations & Charts/ stocks Mentioned are for Learning/Educational Purpose. Do your Own Analysis before Taking positions.

NIFTY50 - WEEKLY ANALYSIS - 15th April #indicesNIFTY50 (1W TF) UPDATE - 15th April, 2024
Pattern: ASCENDING CHANNEL
- Reversal at the top of the Weekly Channel Resistance - Done ✓
- Might expect more of a fall in the Indian markets, mainly due to the US markets sell-off on Friday
- Geo-political tensions due to the Israel-Iran conflict might also have some repercussions
- Volatility is going to be high
- Support Levels have been marked out
Going forward with any Swing Trades:
- DO NOT jump into falling knives
- Watch higher time frames for more accurate entries
- Anyone going short on any stock, please hedge your positions
- There is and will be a lot of volatility over the next 45-60 days.
Until then, we need to be doing the following:
✓ Keep SL's in play for existing positions or trail your SL
✓ Ensure your position sizing is as per your rules
✓ Keep risk management in play at all times
And most importantly, if the market is giving you decent returns in any trade:
✓ Then book your profits and
✓ Hold your capital
Always remember:
- We can live to Fight another day; but ONLY if we are in a POSITION to do so
So Capital Preservation is Key !!
.
.
.
Become Emotionless
&
Trade Ryte
#nifty50

MidCap is at the crucial point. It's a (Tug of War)1) Followed by the SmallCap, MidCap is also under the strong selling pressure.
2) Currently It took the support at the trendline. If It breaks down the level of 45600 & closes below the trendline then It will lead to another 4.5% fall.
3) There's a Probability that MidCap may bounce from it's current level and lead the next uptrend.

BULLISH VIEW ON SATIAHuge momentum is expected in SATIA. Keep it on your watchlist.
Be sure to buy it at an average price. If you buy, please follow risk management & maintain appropriate position sizing.
Disclaimer: This post is for educational purposes and not a recommendation. The analysis posted here is just our view.
