BTC is forming a 3R sell scenario.....BTC is in downtrend in daily timeframe and shown sniper delivery, now it is in pullback mode. We may anticipate a good short term trade around 102000 RDRB level
1. Price is continuously crating BOSs..
2. Sniper deliver is already done and price is pulling back slowly.
3. RSI has already shown bearish divergence on hourly TF.
4. Most probably price will take liquidity of FVG/RDRB level and create MSS/CISD/TS/iFVG in LTF.
5. Price should show rejection/reversal in respective LTF (5m/15m) at FVG zone.
6. Take the trade only once clear entry model i.e. turtle soup. iFVG break, CDS or MSS happens on LTF
All these combinations are signalling a high probability and ~8R trade scenario.
Note – if you liked this analysis, please boost the idea so that other can also get benefit of it.
Also follow me for notification for incoming ideas.
Also Feel free to comment if you have any input to share.
Disclaimer: This analysis is for educational purposes only and does not constitute investment advice. Please do your own research (DYOR) and check with your financial advisor before making any trading decisions.
Breakofstructure

XAU Empire | Bullish FlowXAU Empire | Bullish Flow
The market maintains a bullish structure after confirming a break of structure (BOS). Price is currently retracing into a short-term demand zone near 4,100, showing healthy correction within trend. This zone is acting as accumulation before potential continuation.
Momentum supports a move toward 4,316 – 4,386, aligning with unfilled imbalance and previous supply area. Institutional flow remains on the buy side as long as price holds above 4,080.
---
Market Bias: Bullish
Short-Term Range: 4,100 – 4,386
Key Focus: Retracement for continuation

Gold sweeps SL, wait for BUY LIMIT at Demand Zone 4,223-4,225Timeframe analysis: H4/30M
Logic: Trend Continuation after liquidity sweep.
MARKET STRUCTURE ANALYSIS (SMC Analysis)
Main Trend: Bullish (Price is moving within a parallel channel).
Structure Confirmation (BOS): The chart has confirmed an upward Break of Structure (BOS), indicating that buyers are controlling the market.
Liquidity Sweep/Fake: The strong bearish candle (marked as "Fake") is a move to sweep Stop Losses of early buyers and gather liquidity before Smart Money pushes the price in the main direction. This is an Inducement action.
Key Demand Zone (POI/Demand Zone/Order Block): The TIMING BUY area (4,223.154 - 4,225.000) is a potential Demand Zone/Order Block identified by Smart Money. The price is expected to retest this area before continuing to rise.
MAIN TRADING SCENARIO (LONG SETUP)
SCENARIO: Wait for the price to Pullback to the POI area to enter a buy order, continuing the main bullish trend.
Parameter
Value
SMC Description
Action
BUY LIMIT
Place a pending buy order
Entry Zone (POI)
4,225.000 - 4,223.150
Demand Zone/Order Block after liquidity sweep.
Stop Loss (SL)
4,214.390
Place below the low of the liquidity sweep candle ("Fake Low"), ensuring safety.
Take Profit 1 (TP1)
4,240.000
Target the nearest Swing High.
Take Profit 2 (TP2)
4,250.000
Target psychological resistance and mid-channel.
Take Profit 3 (TP3)
4,260.000+
Target the upper boundary of the parallel channel.
R:R Ratio
Approximately 1:2.5 to 1:3.5 (Depending on TP)
Good R:R ratio for a trend-following trade.
RISK MANAGEMENT
Risk: Only risk a maximum of 1-2% of the account for this trade.
Breakeven: When the price hits TP1, move SL to the Entry point (Breakeven) to protect capital.
Invalidation: If the price closes the D1/H4 candle below the SL level (4,214.390), the buy plan will be invalidated.

Smart Money Play: Watching HDFC Bank’s Bullish ZoneTrading Idea: HDFC Bank (NSE: HDFCBANK)
Price is currently trading around ₹976 after a recent pullback.
Key Observations:
Break of Structure (BOS) confirms bullish market structure.
Liquidity sweep around recent highs.
Daily Fair Value Gap (FVG) spotted between ₹910–₹930.
Bullish Order Block at ₹800–₹830 acting as strong higher timeframe support.
Plan:
Expecting a retracement into the Daily FVG zone (₹910–₹930).
If price reacts bullishly here, potential upside rally towards ₹1,040+.
Confirmation: Look for bullish reversal candles or demand zone rejections inside FVG.
Risk Management:
Aggressive entry: near FVG zone (₹910–₹930).
Conservative entry: only after bullish confirmation.
Stop-loss: below ₹890.
Targets: First TP at ₹990, extended TP at ₹1,040.
Bias: Bullish (after retracement).
Disclaimer: This is not financial advice. For educational purposes only. Please do your own research or consult with a financial advisor before making any investment decisions.

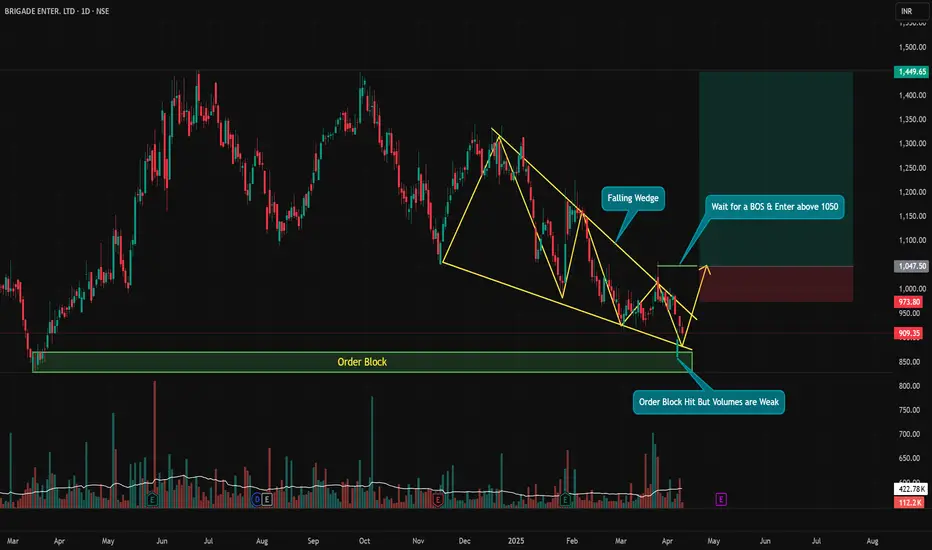
BRIGADE – Falling Wedge at Demand Zone, Waiting for BOSSetup Type: Reversal + Breakout Play | Conviction: Medium-High (Needs Confirmation)
Chart Framework: Smart Money + Classic TA
BRIGADE is showing signs of a potential trend reversal, but we’re not jumping in yet. Here's what the chart tells us:
🟡 Falling Wedge Formation – A bullish reversal pattern that typically resolves to the upside.
🟢 Tapped into a Strong Order Block – Smart money territory where previous accumulation took place.
🧲 Liquidity Grab Below Prior Lows, but... Volume on Bounce is Weak – Sign of caution.
📢 Analyst Rating: STRONG BUY – Adds institutional bias to the bullish setup.
🔐 No Confirmed Break of Structure Yet – Enter only after a clean breakout above ₹1050.
📈 Trade Plan:
Wait for a strong BOS (Break of Structure) and price closing above ₹1050 with volume.
Target zone near ₹1440+ aligns with measured move of wedge and previous supply.
⚠️ This is a setup with potential, but it’s not “ready” yet. Don't front-run smart money — let price confirm before jumping in. Risk management is a must.
IOC, Technical OutlookAfter the break of structure the price has been trading in the negative zone. The breakdown of 164 could open the levels of 161. But the range of 164 to 161.40 could also act as a strong support zone. But the probability of a negative move is high.
Disclaimer: This is my pre market analysis and my trading journal. Not a suggestion to buy or sell.

PNB, Intraday View for 18-JuneDuring the convergence of bands the price has given the break of structure on the upper side. For tomorrow the intraday range on the upper side is 130 to 136 and on the down side is 126 to 122.
Disclaimer: This is my pre market analysis and my trading journal. Not a suggestion to buy or sell.

Nifty 2 Hour Swing Chart, Technical OutlookThe price has given the break of structure on the down side.
The broken structure indicates a start of a downtrend.
But the downtrend will be confirmed on the breakdown of 22,417.
Disclaimer : This is my pre market analysis and my trading journal. Not a suggestion to buy or sell.

USDJPY 4H entry setup, waiting for the FVG entry Confirmations:-
1] bullish trend
2] break of structure
3] fair value gap entry
4] Fibonacci 50%
Target confirmations:-
1] swing high

WSTCSTPAPR: BO of a Small Base, Poised for Further Upside!WSTCSTPAPR appears to be on the verge of a significant move as it breaks out of a small base. The price action suggests that the stock has built a solid foundation and is now ready to make a move to the upside. This breakout could be a strong signal for potential further gains.
Key Points:
Base Breakout: The stock has convincingly broken out of a small base, indicating a potential shift in momentum.
Uptrending Chart: The overall chart for WSTCSTPAPR is displaying a nice uptrend, reflecting positive investor sentiment and sustained buying interest.
50 SMA Support: The stock is currently finding support around the 50-day Simple Moving Average (SMA). This is a positive sign, as it suggests a healthy trend, and the 50 SMA could act as a support level for potential pullbacks.
Disclaimer: This post is for informational purposes only and should not be considered as financial advice. Always do your own research before making any investment decisions. Trading involves risks, and past performance is not indicative of future results.

SAREGAMA looks good for investment for medium to long termThe recent price action of this asset has signaled a significant shift in market sentiment. After a prolonged downtrend, it exhibited a notable uptick in buying interest, successfully breaching the previous lower high of the downtrend. This breakout strongly suggests the initiation of a potential trend reversal.
In addition to the promising technical indicators, the company's fundamentals also appear robust. It has demonstrated impressive growth in annual net profits, and the current-year profits have already surpassed the previous year's figures, showcasing a noteworthy performance that underscores its strong financial health and growth prospects.

Swing Breakout Stocks for Tomorrow | Breakout Stocks to Buy NowIn this video, we're going to share with you our top 8 #breakoutstocks for tomorrow! These stocks are poised to make big moves in the coming days, so be sure to check them out! #swingtrading , #breakoutsignals
And finally, in this video, we'll give you some tips on how to invest in breakout stocks. We'll share with you our tips on how to find breakout stocks, how to trade them, and how to find :-
1. Breakout Stock
2. Breakout Stocks for Next Week
3. Breakout Stocks for Tomorrow
4. Breakout Stocks of The Week
5. Breakout Stocks to Buy Now
6. Breakout Stocks Tomorrow
7. Best Breakout Stocks for Tomorrow
8. Positional Breakout Stocks
9. Positive Breakout Stocks for Swing Trading
10. Positive Breakout Stocks
11. Swing Breakout Stocks for Tomorrow
12. Tomorrow Breakout Stocks
13. Tomorrow Intraday Breakout Stocks
14. Top breakout Stocks for Today
15. Top Breakout Stocks
------------------------------------------------------------------------------------------------------------------------
The purpose of this channel is to spread knowledge and awareness about the Stock Market for free. We do extensive fundamental and technical analysis and give recommendations solely based on our research.
Disclaimer: We are not SEBI registered. All the content (videos, comments, posts, community posts, live streaming, etc) of this channel is for educational and informational purposes only, Conduct your own due diligence, or consult a licensed financial advisor or broker before making any and all investment decisions.
-----------------------------------------------------------------------------------------------------------------------------
#breakoutsstocksfortomorrow
#swingtradestrategy #tradingstrategies #tradingstrategy #tradingstrategies #swingtrader #swingtrading #swingstocks #swingidea

BoS + High Volume confirmation = Solid tradeBreak of Structure also acts as a support, and if there's a high volume confirmation you can take an entry in the trend direction.
1:7 RR Long entry on $ FISUSDT.
FLong

Check out my #EURUSD analysis Entering at Market Execution is Risky,
Good to wait till 1hr BOS.
Enter with the recent Order Block.
Trade Safe, Happy Trading.
