saregama- Potential Buy Setup#Saregama
The stock has bounced back from the supply-turned-demand zone on the weekly chart, indicating a potential reversal.
Before entering, waiting for confirmation of a Higher High above the dotted line on the daily chart.
Trade Details:
Entry: On BO and retest
Stop Loss: Below 439 on a closing
Next report date
—
Report period
—
EPS estimate
—
Revenue estimate
—
9.75 INR
1.98 B INR
8.03 B INR
57.73 M
About SAREGAMA INDIA LTD
Sector
Industry
CEO
Vikram Mehra
Website
Headquarters
Mumbai
Founded
1902
ISIN
INE979A01025
FIGI
BBG000BZXBB6
Saregama India Ltd. is a holding company, which engages in the manufacture and sale of music storage device. It operates through the following segments: Music; and Film, TV Serials, and Events. The Music segment includes the manufacture and sale of music storage device, such as carvaan, mini carvaan, music card, audio compact discs, and digital versatile discs. The Film, TV Serials, and Events segment consists of production, and sale, telecast, broadcast of films, TV Serials, pre-recorded programmes; organizing live musical events, and dealing in film rights. The company was founded in 1902 and is headquartered in Mumbai, India.

Saregama India Ltd. - Muhurat TradingWe're observing a potential round bottom pattern forming on the daily chart of Saregama India Ltd. This pattern often signifies a shift in trend momentum, potentially indicating a bullish breakout on the horizon. As we approach the neckline, a breakout above this level could pave the way for further

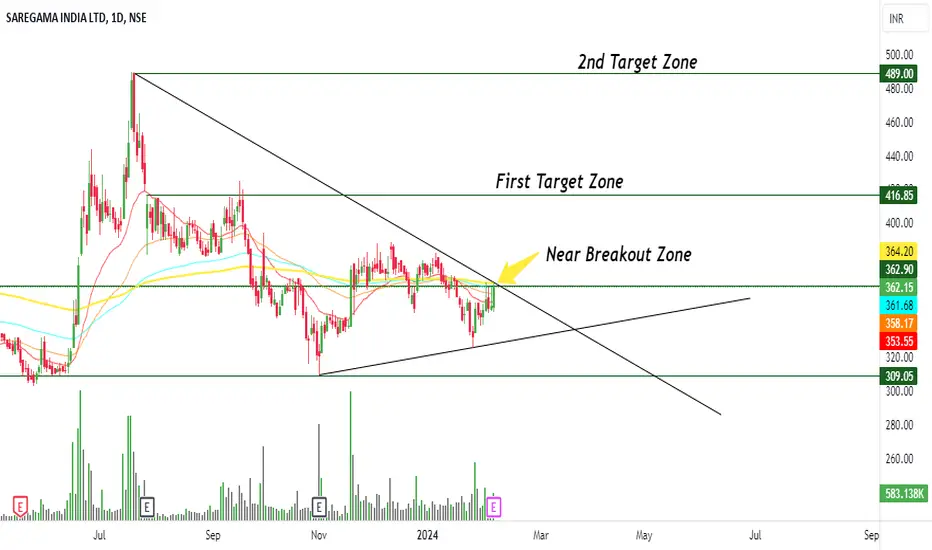
Can Expect 100% Return in Next 6 month NSE:SAREGAMA Hi guys, Today I will share a chart of Saregama which is near Breakout on daily chart so if we can get a strong breakout with a strong volume then we can expect huge upside momentum. I will share the first two target which I will expect that we can get in next one or two month. If i ta
Parallel channel breakout with High VolumesNSE:SAREGAMA today broke its Parallel Channel with Heavy Volumes respecting 100 EMA and getting accumulated between 441 - 482 Zones on Daily Timeframe.
Disclaimer: This analysis is intended solely for informational and educational purposes and should not be interpreted as financial advice. It i

#SAREGAMA ATTENTION!#Saregama
Attention!
What A Breakout And Retest Do
Breakout From Pennant Pattern
Cmp:631
Future Price Will Be 987
Stoploss Candle Low

SAREGAMA - Ichimoku Breakout📈 Stock Name - Saregama India Limited
🌐 Ichimoku Cloud Setup:
1️⃣ Today's close is above the Conversion Line.
2️⃣ Future Kumo is Turning Bullish.
3️⃣ Chikou span is slanting upwards.
All these parameters are shouting BULLISH at the Current Market Price and even more bullishness anticipated AFTE

Saregama -Breakout-RetestSaregama :
Breakout - Retest and Fresh breakout
Stay long with support at 613

SAREGAMA lets enjoy some music as wellSAREGAMA - break out on daily time frame with a bullish candlestick pattern "N"
lets enjoy some music as well

SAREGAMA🔶𝗜 𝘀𝗰𝗮𝗻𝗻𝗲𝗱 𝘁𝗵𝗿𝗼𝘂𝗴𝗵 𝗵𝘂𝗻𝗱𝗿𝗲𝗱𝘀 𝗼𝗳 𝘀𝘁𝗼𝗰𝗸𝘀 𝘀𝗼 𝘁𝗵𝗮𝘁 𝘆𝗼𝘂 𝗱𝗼𝗻'𝘁 𝗵𝗮𝘃𝗲 𝘁𝗼🔸
Here are My Top 4 Breakout Picks
1. SAREGAMA
-reduced public holdings
-increasing sales YOY
-niche industry

SAREGAMA EWT 5th wave undergoing SAREGAMA still upmove is there
In longer time frame
Wave 1,2,3,4 completed
5th is going on

See all ideas
An aggregate view of professional's ratings.
Displays a symbol's price movements over previous years to identify recurring trends.
Frequently Asked Questions
The current price of SAREGAMA is 499.45 INR — it has decreased by −3.04% in the past 24 hours. Watch SAREGAMA INDIA LTD stock price performance more closely on the chart.
Depending on the exchange, the stock ticker may vary. For instance, on NSE exchange SAREGAMA INDIA LTD stocks are traded under the ticker SAREGAMA.
SAREGAMA stock has fallen by −3.99% compared to the previous week, the month change is a 3.56% rise, over the last year SAREGAMA INDIA LTD has showed a 31.50% increase.
We've gathered analysts' opinions on SAREGAMA INDIA LTD future price: according to them, SAREGAMA price has a max estimate of 640.00 INR and a min estimate of 497.00 INR. Watch SAREGAMA chart and read a more detailed SAREGAMA INDIA LTD stock forecast: see what analysts think of SAREGAMA INDIA LTD and suggest that you do with its stocks.
SAREGAMA reached its all-time high on Oct 1, 2024 with the price of 688.90 INR, and its all-time low was 3.05 INR and was reached on Apr 1, 2003. View more price dynamics on SAREGAMA chart.
See other stocks reaching their highest and lowest prices.
See other stocks reaching their highest and lowest prices.
SAREGAMA stock is 4.27% volatile and has beta coefficient of 0.84. Track SAREGAMA INDIA LTD stock price on the chart and check out the list of the most volatile stocks — is SAREGAMA INDIA LTD there?
Today SAREGAMA INDIA LTD has the market capitalization of 99.19 B, it has decreased by −2.17% over the last week.
Yes, you can track SAREGAMA INDIA LTD financials in yearly and quarterly reports right on TradingView.
SAREGAMA INDIA LTD is going to release the next earnings report on Jan 16, 2025. Keep track of upcoming events with our Earnings Calendar.
SAREGAMA net income for the last quarter is 449.00 M INR, while the quarter before that showed 369.20 M INR of net income which accounts for 21.61% change. Track more SAREGAMA INDIA LTD financial stats to get the full picture.
As of Dec 12, 2024, the company has 454.00 employees. See our rating of the largest employees — is SAREGAMA INDIA LTD on this list?
EBITDA measures a company's operating performance, its growth signifies an improvement in the efficiency of a company. SAREGAMA INDIA LTD EBITDA is 2.48 B INR, and current EBITDA margin is 31.65%. See more stats in SAREGAMA INDIA LTD financial statements.
Like other stocks, SAREGAMA shares are traded on stock exchanges, e.g. Nasdaq, Nyse, Euronext, and the easiest way to buy them is through an online stock broker. To do this, you need to open an account and follow a broker's procedures, then start trading. You can trade SAREGAMA INDIA LTD stock right from TradingView charts — choose your broker and connect to your account.
Investing in stocks requires a comprehensive research: you should carefully study all the available data, e.g. company's financials, related news, and its technical analysis. So SAREGAMA INDIA LTD technincal analysis shows the sell today, and its 1 week rating is neutral. Since market conditions are prone to changes, it's worth looking a bit further into the future — according to the 1 month rating SAREGAMA INDIA LTD stock shows the buy signal. See more of SAREGAMA INDIA LTD technicals for a more comprehensive analysis.
If you're still not sure, try looking for inspiration in our curated watchlists.
If you're still not sure, try looking for inspiration in our curated watchlists.