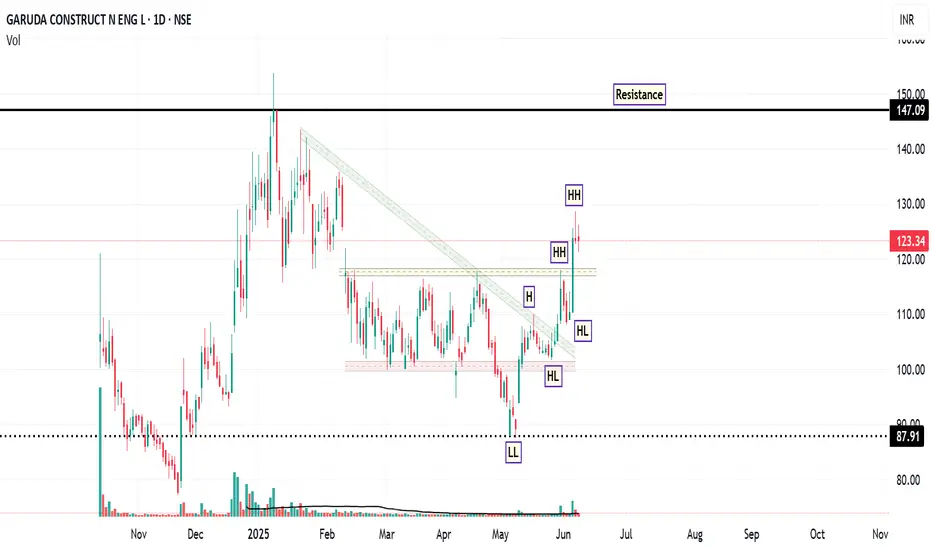
Garuda: Riding the Momentum WaveFrom February to late May 2025, the stock of GARUDA was trading in a sideways consolidation range, roughly between ₹100 (support) and ₹115-₹120 (resistance). The recent powerful green candles have shattered the upper boundary of this range. Also, the most significant event on the daily chart is the decisive breakout from a descending trendline that had capped prices. Also, LL and HH formation observed on daily chart.
The breakout was accompanied by a significant spike in volume ( 862.88K shares ), which is substantially higher than the average volume during the consolidation period. High volume on a breakout lends strong credibility to the move.
The RSI is at a strong 69.20 . It is in bullish territory and rising, indicating strong buying momentum. It is approaching the overbought region (>70), but is not there yet, leaving room for further upside before becoming extended.
If the stock consolidates above the ₹120-₹121 support level. Buyers step in on any minor dip till ₹118 , and the price then continues its upward trajectory towards the resistance targets of ₹129 and subsequently ₹149 .
Disclaimer: This technical analysis is for informational purposes only and should not be considered as financial advice. Trading in the stock market involves risk. Always conduct your own research and consult with a qualified financial advisor before making any investment decisions.
Breakout!
Radhika Jeweltech – Classic Contraction PatternTimeframe: Weekly
Structure Observed: Contraction Pattern between Trendlines
Volume: Significant recent uptick 📊
Key Zones:
🔴 Supply Zone above 123
🟢 Dynamic Support from ascending trendline
🟠 Active counter-trendline now breached
After months of lower highs and higher lows, the price has been squeezing into a classic contraction pattern between a descending orange trendline (acting as counter-trendline resistance) and a rising green trendline providing consistent support.
This week’s candle has decisively broken above the descending trendline on strong relative volume.
With the weekly close due tomorrow, all eyes remain on how the candle settles — will it sustain this breakout structurally or retreat below the trendline?
📌 Important Note: This is a technical observation — not a trade recommendation.

Euro Slips Further as Safe-Haven Demand for USD GrowsThe EUR/USD pair is facing strong selling pressure as global financial markets continue to reel from geopolitical and trade-related tensions. The Euro is weakening as investors increasingly turn to the U.S. Dollar as a safe haven, following a series of aggressive tariff policies announced by the United States.
Adding to the Euro’s struggles is the lack of positive economic data from the Eurozone, which has further diminished hopes for a meaningful recovery. Traders are now closely watching for monetary policy signals from both the ECB and the Federal Reserve, but so far, the bearish trend remains firmly in place.
On the technical front, EUR/USD continues to move within a descending channel, while the bearish crossover of the EMA 34 and 89 keeps sellers in control. With risk sentiment leaning defensive and capital flowing toward safe-haven assets, the pair may see further downside unless surprise bullish catalysts emerge from upcoming data or central bank remarks.

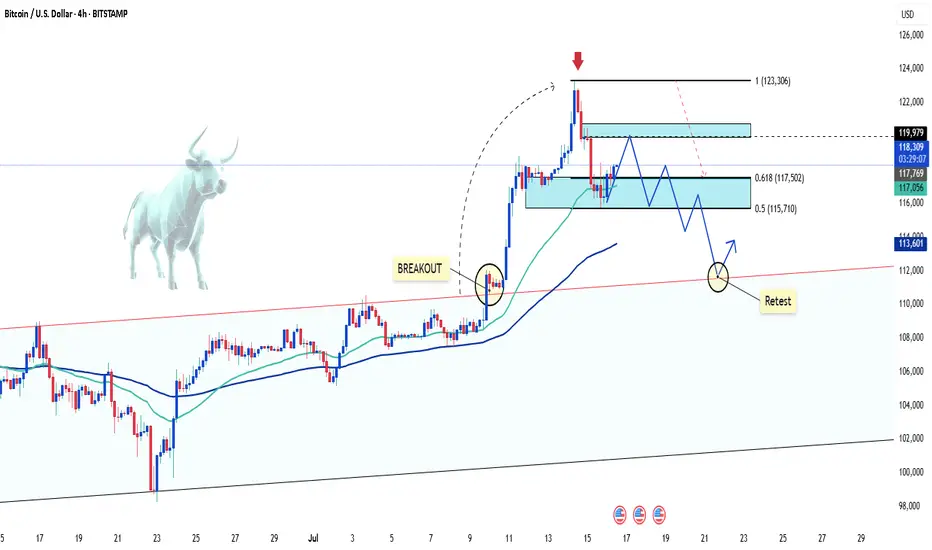
BTC/USD Pullback: What’s Next for Bitcoin?Hello, passionate and wealthy traders! What are your thoughts on BTC/USD?
After a strong surge above the 122,500 USD zone, BTC/USD has started to experience a slight pullback. This is completely normal and necessary for Bitcoin to gain new momentum.
In my personal view, the recent peak of BTC/USD signals that this correction is in play. But where do you think BTC/USD will adjust to? Personally, I believe the 111,500 USD zone is quite reasonable. It’s also the previous breakout level, and this pullback aims to test the uptrend safely.
What about you? Where do you see BTC/USD heading? Looking forward to hearing your thoughts!
How to use Head n Shoulder / Inv. Head n Shoulder Chart Pattern.Hello Friends,
Welcome to RK_Chaarts,
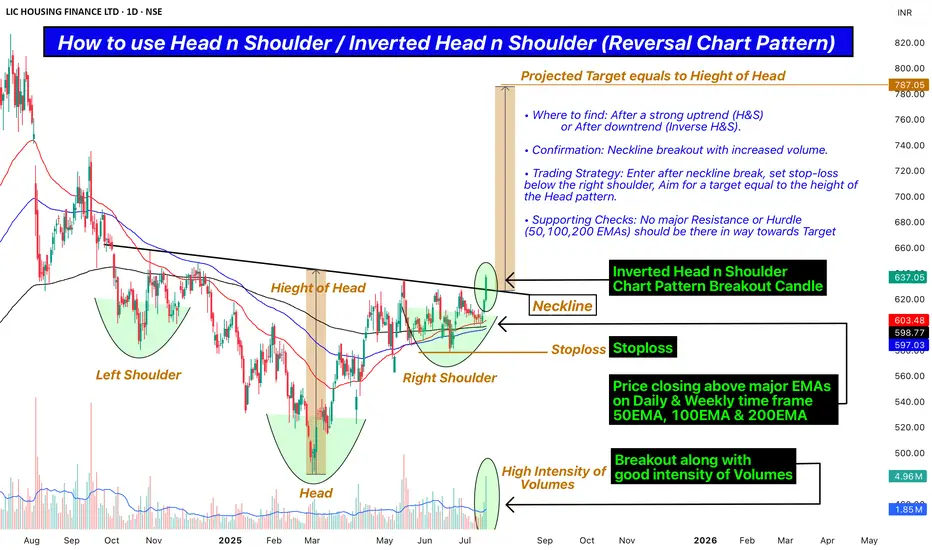
Today we are going to Learn how to use Head n Shoulder / Inverted Head n Shoulder (Reversal Chart Pattern) as a Professional Trader along with real terms to check, Confirm and apply.
• Where to find: After a strong uptrend (H&S) or After downtrend (Inverse H&S).
• Confirmation: Neckline breakout with increased volume.
• Trading Strategy: Enter after neckline break, set stop-loss below the right shoulder, Aim for a target equal to the height of the Head pattern.
• Supporting Checks: No major Resistance or Hurdle (50,100,200 EMAs) should be there in way towards Target.
This post is shared purely for educational purpose & it’s Not a trading advice.
I am not Sebi registered analyst.
My studies are for educational purpose only.
Please Consult your financial advisor before trading or investing.
I am not responsible for any kinds of your profits and your losses.
Most investors treat trading as a hobby because they have a full-time job doing something else.
However, If you treat trading like a business, it will pay you like a business.
If you treat like a hobby, hobbies don't pay, they cost you...!
Hope this post is helpful to community
Thanks
RK💕
Disclaimer and Risk Warning .
The analysis and discussion provided on in.tradingview.com is intended for educational purposes only and should not be relied upon for trading decisions. RK_Chaarts is not an investment adviser and the information provided here should not be taken as professional investment advice. Before buying or selling any investments, securities, or precious metals, it is recommended that you conduct your own due diligence. RK_Chaarts does not share in your profits and will not take responsibility for any losses you may incur. So Please Consult your financial advisor before trading or investing.
Mastering Multi Time Frame Analysis | Swing and Intraday TradingWhether you're a price action trader or rely on indicators, mastering Multi Time Frame (MTF) Analysis can transform your swing and intraday trading decisions. In this video, I break down how to use MTF effectively to align your entries, spot fakeouts, and trade with higher conviction.

EUR/USD Faces Strong Sell-off, Is a Deeper Correction Coming?The FX:EURUSD pair continued its sharp decline this morning, currently trading around 1.161, after breaking through the bullish wedge pattern on the daily chart. This key technical signal suggests that the previous uptrend has ended, opening the possibility for a deeper correction in the short term. The inability to hold the 1.171 resistance after two attempts further confirms the ongoing downtrend.
The selling pressure is driven by the strong recovery of the USD, as investors seek refuge in safe-haven assets amid concerns about global growth and geopolitical instability. Additionally, U.S. bond yields have rebounded following strong economic data, reducing the appeal of the euro. The expectation that the Fed will maintain high interest rates for a longer period also contributes to the downward pressure on EUR/USD.
In the short term, if EUR/USD fails to hold the 1.158 support, there is a high likelihood of a drop towards 1.140, a level that acted as strong support in the past. Traders should closely monitor signals from the Fed and the upcoming PMI data for the Eurozone to assess the next trend direction.

Gold Faces Pressure as USD Strengthens – A Buying Opportunity?Gold prices have seen a slight decline today compared to yesterday’s trading session, fluctuating around 3,328 USD after losing over 43 USD in just one session.
The main factors contributing to this drop are:
-USD Strength: The USD Index rose by 0.56%, making gold more expensive for investors holding other currencies.
-Rising U.S. Bond Yields: U.S. Treasury yields surged to nearly 4.5%, drawing money away from the gold market.
-U.S. CPI for June: The CPI met expectations, easing inflation fears and reducing the demand for gold as a safe-haven asset.
Despite the short-term pressure, investors remain hopeful that the Fed will cut interest rates in September, potentially providing a boost for gold.
Personal assessment: While gold is currently in a correction phase, its long-term trend remains intact. This could be a buying opportunity if you believe in the upcoming monetary easing cycle.
What do you think about gold’s price today? Let us know in the comments!

Sun Pharma: A Bullish OutlookHello Friends,
Welcome to RK_Chaarts,
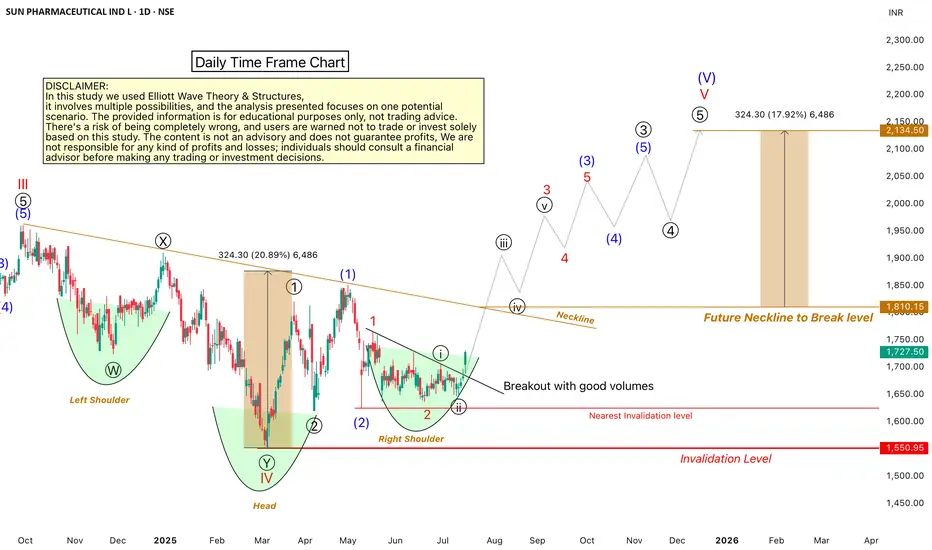
Let's analyze the Sun Pharmaceuticals chart using technical analysis, specifically the Elliott Wave Theory. According to this theory, the September 2024 top marked the end of Wave III cycle degree in red, and the March 2025 bottom marked the end of Wave IV cycle degree in red Now, Wave V of cycle degree in red has begun, which will move upward.
Within Wave V, we should have five sub-divisions of Primary degree in black, with Wave ((1)) & Wave ((2)) already completed. Wave ((3)) has started, with five further sub-divisions of one lower degree intermediate degree, We've marked these in blue, with Wave (1) and Wave (2) completed, and Wave (3) started. Within Wave (3), we have minor degree waves in red, with Wave 1 and Wave 2 completed, and Wave 3 breaking out today with good intensity of volumes.
We can see that the wave counts are super bullish, and so is the RSI, which is above 60. The MACD is also positive, and the price is above the 50-day and 200-day EMAs on the daily and weekly time frames. There's no moving average hurdle, which is another super bullish sign.
We can also see a higher high and higher low formation, which is a bullish sign according to Dow Theory. Additionally, an inverted head and shoulders pattern is forming, with the right shoulder being made. When it breaks out above the neckline, it will give us a target, which aligns with the Elliott Wave Target projection.
All these indicators – technical analysis, price action, and Elliott Wave – point to a bullish trend. However, there's an invalidation level at 1550; if the price falls below this level, our wave counts will be invalidated.
We're projecting targets between 2000-2200 based on Elliott Wave theory projections. Please note that this analysis is for educational purposes only and should not be considered as investment advice.
This post is shared purely for educational purpose & it’s Not a trading advice.
I am not Sebi registered analyst.
My studies are for educational purpose only.
Please Consult your financial advisor before trading or investing.
I am not responsible for any kinds of your profits and your losses.
Most investors treat trading as a hobby because they have a full-time job doing something else.
However, If you treat trading like a business, it will pay you like a business.
If you treat like a hobby, hobbies don't pay, they cost you...!
Hope this post is helpful to community
Thanks
RK💕
Disclaimer and Risk Warning.
The analysis and discussion provided on in.tradingview.com is intended for educational purposes only and should not be relied upon for trading decisions. RK_Chaarts is not an investment adviser and the information provided here should not be taken as professional investment advice. Before buying or selling any investments, securities, or precious metals, it is recommended that you conduct your own due diligence. RK_Chaarts does not share in your profits and will not take responsibility for any losses you may incur. So Please Consult your financial advisor before trading or investing.
Gold Price Today: Uptrend or Correction?The price of gol today is showing mixed trends, with key factors affecting the market. Expectations around Federal Reserve monetary policy and important economic data, such as CPI and unemployment rate, are directly influencing the precious metals market. Additionally, global political tensions and the strengt continue to play a significant role in gold's direction.
Gold remains a safe-haven asset amid economic uncertainty, but fluctuating interest rates and market volatility could lead to unpredictable movements.
Current Trend: Gold may experience a slight correction if economic data turns positive and the USD strengthens, but it still remains an attractive long-term asset due to global uncertainty and inflation.

BTC/USD Soars: A Surge That Took the Market by SurpriseBitcoin BITSTAMP:BTCUSD has shocked the market with a massive surge, reaching new highs in recent days. This unexpected jump has taken many traders and analysts by surprise, as BTC breaks through previous resistance levels.
The driving forces behind this surge appear to be increased institutional interest, positive market sentiment, and strong demand from retail investors. As Bitcoin enters new territory, it's essential for traders to stay vigilant and manage their risk, as volatility remains high.
Will Bitcoin continue its rally or face a correction? Keep an eye on the charts for the next move!

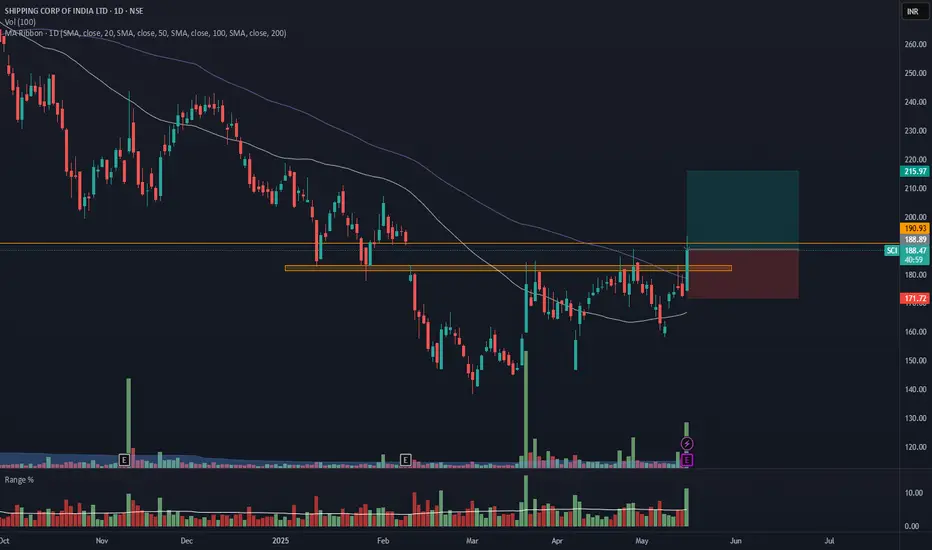
SHIPIING CONTAINERS INDIA - SCI - Breakout from DTFShipping Containers India has resistance weakening on the Daily charts and has given a breakout with good volume.
The target of this pattern signals an upside potential of 15% from the current price level in the medium term.
The stock is trading above its 50- and 100-day exponential moving averages (EMAs). The range is more than 2X, and the Volume is also 3.5X the average.
There is an old support level acting as resistance, which is why the stock won't go over 191. To be safe, wait for the closing price. If it is above 191, it's good.
CMP- Rs. 188
Target Price- Rs216 ( 15% upside)
SL - 171
Disclaimer: This is not a buy/sell recommendation. For educational purpose only. Kindly consult your financial advisor before entering a trade.
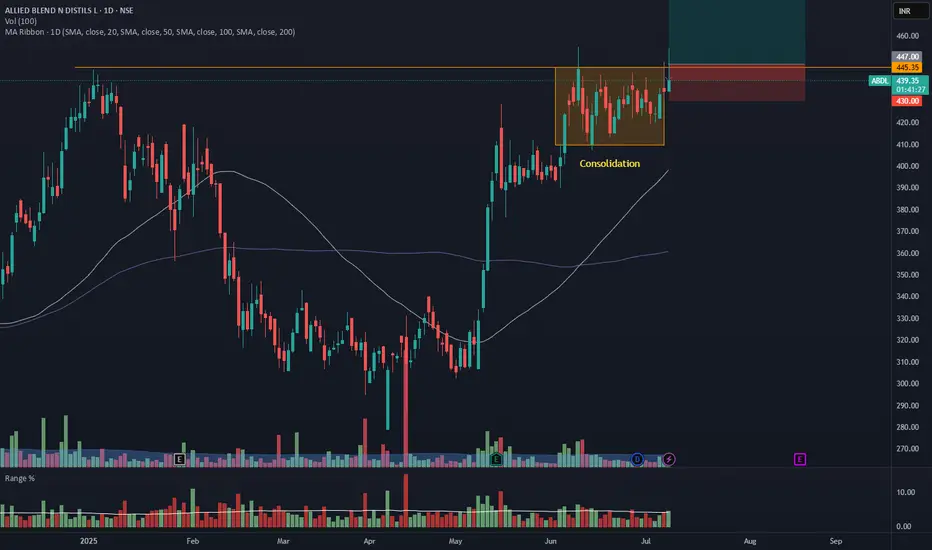
ABDL - Daily Timeframe Breakout Idea (Resistance Zone Break)Allied Blenders and Distillers Ltd. has shown a breakout above a key horizontal resistance level on the daily chart, accompanied by a nearly 2 times volume surge near the breakout zone, as seen earlier, supported by strong momentum.
🔍 Breakout Context:
- Price might break above the ~₹446 horizontal resistance, which had held for over 6 months.
The breakout zone has been supported by 2X volume and a range 1.5X of average near the resistance zone.
- The price is also trading above both the 50- and 100-day SMAs, indicating strong trend continuation.
- This aligns with a bullish continuation setup.
📉 Trade Plan:
- CMP: ₹439.15
- Entry: Near ₹446
- Target: ₹481 (~7.5% upside from CMP)
- Stop-Loss: ₹430
- Risk-Reward Ratio: ~ 1 : 2
📌 Note:
- Look for a confirmation candle to enter the trade.
- Avoid chasing the extended move unless confident in intraday momentum.
⚠️ Disclaimer: This post is for educational purposes only and not financial advice. Always do your research or consult a financial advisor before trading.
Gold Finds Strength in UncertaintyGold prices surged for the fourth consecutive session after U.S. President Donald Trump announced a new wave of tariffs — including a 35% import tax on Canadian goods and threats of 15–20% tariffs on other major trade partners. Previously, the U.S. had already imposed a 50% tariff on copper and Brazilian imports. These aggressive trade measures have reignited fears of a global economic slowdown, prompting investors to seek refuge in gold.
As a result, gold is increasingly viewed as a buying opportunity, with many prioritizing safety over chasing equity market highs.
Adding to the bullish case, expectations of a Federal Reserve rate cut — reinforced by comments from Fed officials Waller and Daly — have further boosted the metal’s appeal.
In summary, the mix of rising trade tensions and a dovish monetary outlook is providing strong short-term support for gold’s upward momentum.

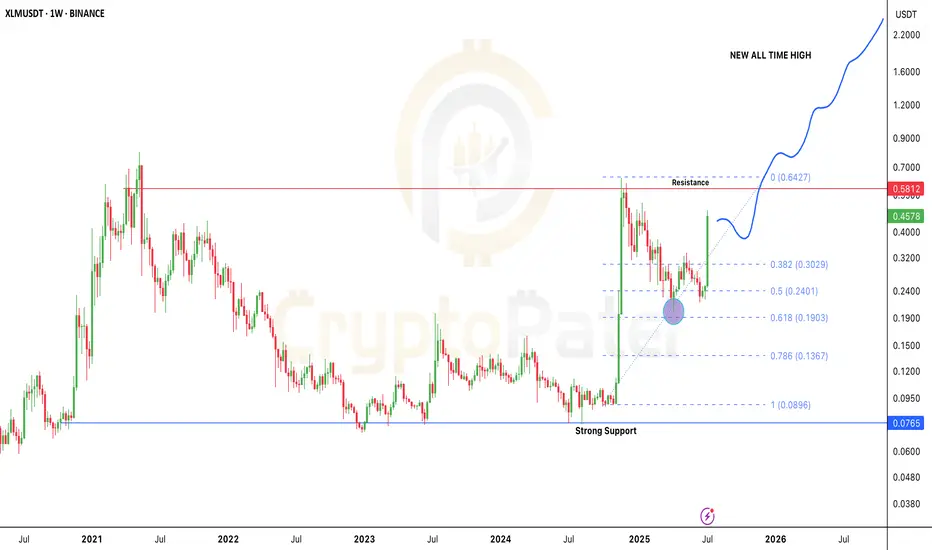
Stellar Breakout: Is $XLM the Next 10x Altcoin of 2025?After months of sideways action and accumulation, Stellar is finally showing real strength.
In the last 4 weeks alone, CRYPTOCAP:XLM has pumped over 120%, bouncing perfectly from the key 0.618 Fibonacci level near $0.19 — a classic reversal zone.
Here’s what’s really going on 👇
🔹 Back in Nov 2024, CRYPTOCAP:XLM went from $0.09 to $0.6374 in just 30 days — that’s a 600% move!
🔹 After that huge rally, price corrected nearly -68%, landing right at the golden Fib zone.
🔹 And guess what? Buyers stepped in hard, flipping the trend back to bullish.
Could we see a pullback?
Sure — maybe a small dip toward $0.30 (0.382 Fib). That’s normal. But the overall structure looks super bullish right now.
Major Resistance: $0.58
If that breaks and flips into support — we’re likely headed toward $2–$5 in the next wave.
This is one of the cleanest macro charts in the altcoin market right now.
👇 Drop your XLM target for this bull run in the comments!
Let’s see who’s aiming for the moon.
Note: DYOR & NFA
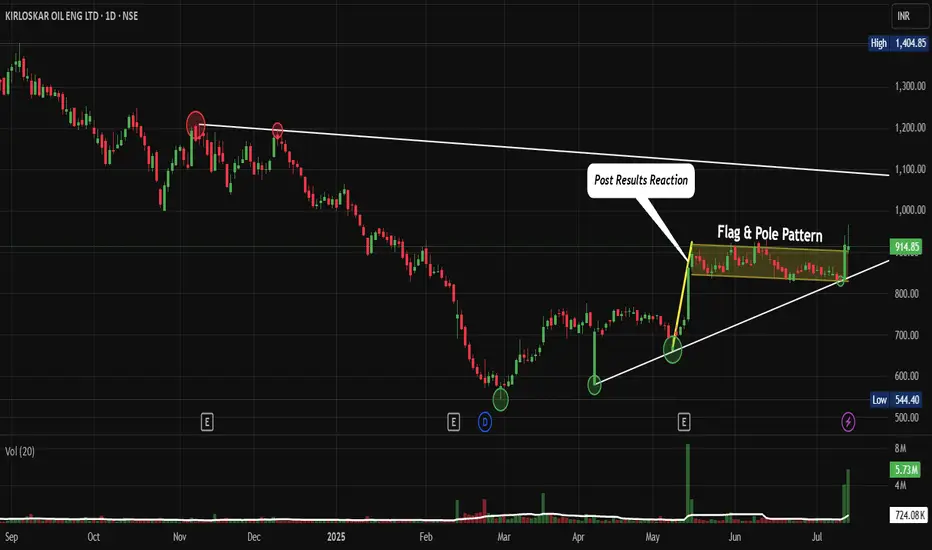
KIRLOSENG: Post-Results Breakout and Consolidation. F&P PatternNSE:KIRLOSENG : How This Hidden Gem Could Be Your Next Big Winner After Post-Results Breakout and Consolidation Let's Analyze in my "Chart of the Week"
Price Action:
- The stock shows a classic recovery pattern from March 2025 lows around ₹590-600
- Current price at ₹914.85 represents a significant 52% recovery from the March bottom
- The stock has been forming higher lows since March, indicating underlying strength
- Recent breakout above the ₹850 resistance level with strong volume confirmation
Volume Spread Analysis:
- Volume spike during the recent breakout suggests institutional participation
- The post-results reaction shows a healthy volume of 724.08K against a 20-day average of 5.73M
- Volume patterns indicate an accumulation phase during the consolidation period from April to June
Base Formation:
- Primary base established between ₹590-650 (March 2025 lows)
- Secondary base formed around the ₹750-800 level during April-May consolidation
- Current base being built around ₹880-920 after the recent breakout
Support and Resistance Levels:
Key Support Levels:
- Immediate support: ₹880-890 (recent breakout level)
- Strong support: ₹830-850 (previous resistance turned support)
- Major support: ₹780-800 (secondary base level)
- Ultimate support: ₹590-650 (primary base)
Resistance Levels:
- Immediate resistance: ₹950-970
- Major resistance: ₹1,000-1,020 (psychological level)
- Long-term resistance: ₹1,100-1,150 (previous highs from late 2024)
- Ultimate target: ₹1,400+ (all-time high region)
Technical Patterns:
Flag and Pole Pattern:
- The chart clearly shows a flag and pole formation
- The flag represents the consolidation phase from May to June 2025
- Recent breakout confirms the pattern completion with an upward trajectory
Ascending Triangle:
- The stock has formed an ascending triangle pattern with higher lows and consistent resistance around ₹850
- The breakout above this level validates the bullish continuation pattern
Post-Results Reaction:
- Kirloskar Oil Engines shares settled slightly, trading at Rs 803.75, representing a 9.36% increase, while the BSE Sensex was up by 0.25%.
- The positive reaction to results indicates market confidence in the company's performance
Trade Setup:
Entry Strategy:
- Primary entry: ₹900-920 (current levels on any dip)
- Secondary entry: ₹880-890 (on pullback to support)
- Aggressive entry: ₹930-950 (on breakout above current resistance)
Entry Levels:
- Conservative traders: Wait for pullback to ₹880-890 support
- Moderate traders: Enter at current levels around ₹910-920
- Aggressive traders: Enter on a breakout above ₹950
Exit Strategy:
Target Levels:
- Target 1: ₹1,000 (8-10% upside)
- Target 2: ₹1,100 (18-20% upside)
- Target 3: ₹1,250 (35-40% upside)
- Ultimate target: ₹1,400+ (50%+ upside)
Exit Timing:
- Book 30% profits at Target 1
- Book 40% profits at Target 2
- Hold the remaining 30% for the ultimate target with a trailing stop loss
Risk Management:
Stop-Loss Levels:
- Conservative stop-loss: ₹850 (6-7% downside)
- Moderate stop-loss: ₹830 (8-9% downside)
- Aggressive stop-loss: ₹800 (11-12% downside)
Position Sizing:
- Risk per trade: Maximum 2% of portfolio
- Position size calculation: Portfolio value × 2% ÷ (Entry price - Stop loss)
- For ₹1,00,000 portfolio with entry at ₹910 and stop at ₹850: Position size = ₹2,000 ÷ ₹60 = 33 shares
Sectoral Backdrop:
Industrial Machinery Sector:
- The industrial machinery sector has been showing resilience amid economic recovery
- Infrastructure push by the government supports demand for engines and pumps
- Agricultural mechanization trends favour companies like NSE:KIRLOSENG
Market Position:
- The company caters to the agriculture, ... Clients (Marine, Defence, etc), After Sales Support, Retail Channel – Tractor spares, Oil, Batteries.
- Diversified revenue streams provide stability across economic cycles
Fundamental Backdrop:
Financial Performance:
- Netprofit is up for the last 2 quarters, 68 Cr → 127 Cr (in ₹)
- Revenue is up for the last 2 quarters, 1454 Cr → 1753 Cr (in ₹)
- As of 31-Mar-2025, Kirloskar Oil Engines has a trailing 12-month revenue of 6349 Cr
Market Valuation:
- Its current market cap is 13,289 Cr with 14.5 Cr shares.
- Stock is trading at 4.30 times its book value
- Promoter holding has decreased over the last 3 years: -18.3%
Growth Outlook:
- The B2B business grew 5 per cent year on year, and the B2C business also witnessed a double-digit growth of 14 per cent year on year
- Strong positioning in agriculture and industrial segments provides sustainable growth prospects
- The final dividend of Rs 4 per equity Share indicates management confidence
My Take:
Investment Rationale:
- Technical breakout supported by improving fundamentals
- Diversified business model reduces concentration risk
- Strong balance sheet with consistent profitability
- Attractive valuation after the recent correction from highs
The combination of technical breakout, improving fundamentals, and supportive sectoral trends makes NSE:KIRLOSENG an attractive investment opportunity for medium to long-term investors with appropriate risk management measures in place.
Keep in the Watchlist.
NO RECO. For Buy/Sell.
📌Thank you for exploring my idea! I hope you found it valuable.
🙏FOLLOW for more
👍BOOST if you found it useful.
✍️COMMENT below with your views.
Meanwhile, check out my other stock ideas on the right side until this trade is activated. I would love your feedback.
Disclaimer: "I am not a SEBI REGISTERED RESEARCH ANALYST AND INVESTMENT ADVISER."
This analysis is intended solely for informational and educational purposes and should not be interpreted as financial advice. It is advisable to consult a qualified financial advisor or conduct thorough research before making investment decisions.
Breakout vs Fakeout: Master this logic to become a better TraderBreakouts can be deceiving. In this video, I dive deep into the psychology and structure behind breakouts vs fakeouts, how to spot the traps, and how to trade them with precision.

Inside Bar Ignites a Clean Breakout🟢 Simple Breakout Structure | Supply-Demand Flip
✅ Strong demand zone formed after multiple rejections
🔻 Previous supply zone clearly respected
📉 One active counter-trendline broken
🔍 Breakout of mother candle with an inside bar setup
📈 Volume expansion on breakout
🟠 Also broke a hidden resistance line, adding confluence
🧭 Chart structure remains smooth and clear, respecting zones well
No predictions. Just structure.
Gold Struggles Under Tariff Pressure Hello everyone, great to see you again!
Today, OANDA:XAUUSD remains under notable pressure as the U.S. continues to signal a tougher trade stance. The latest move: the U.S. President announced a 50% import tariff on copper and a potential 200% tariff on pharmaceuticals, following a previous tariff notice ranging from 25% to 40% sent to 14 countries — including Japan, South Korea, Thailand, and Malaysia.
This isn’t just about protectionism. These measures fuel fears of global inflation, supply chain disruptions, and a broader economic slowdown. With surging prices in raw materials and essential goods, consumers may be forced to cut back spending, a classic warning sign for future growth.
In this environment, investors had hoped gold would shine again as a safe haven asset. However, the recent bullish momentum has been underwhelming, signaling ongoing market hesitation.
📉 On the H4 chart, XAUUSD is being squeezed into a descending pattern, which typically carries a high probability of a downside breakout. If the current support fails, the next target could fall below the 32xx area.
On the flip side, if supportive news emerges — such as a hint of rate cuts from the Fed — gold must break above the $3,335 level to revive bullish sentiment.
🔎 What do you think? Will gold break lower — or bounce back? Drop your thoughts below!

Gold Finds Support as Tariff Tensions RiseHello everyone! What’s your take on XAUUSD today?
OANDA:XAUUSD is showing a mild recovery, currently trading around $3,323, gaining over 100 pips on the day. Despite this bounce, the short-term structure still leans in favour of the bears.
On July 9th, President Biden announced a 50% tariff on copper and a projected 200% tariff on pharmaceuticals, following earlier notices of 25–40% tariffs imposed on 14 countries including Japan, South Korea, Thailand, Laos, and Malaysia.
This escalation has led to a sharp rise in international copper prices and reignited fears of global inflation, supply chain disruptions, and slower economic growth. As consumers cut back and companies face contract renegotiations, financial risk is spreading across global markets.
In this climate, investors are returning to gold as a safe haven, seeking capital protection in anticipation of broader market instability.
📈 Outlook: Gold prices may continue to rally in the short term if the U.S. unveils further tariff measures or reveals new negotiation drafts in the coming days.

Bad News Piling Up – EURUSD Under Heavy PressureEURUSD is slipping fast as a wave of negative news hits the Eurozone. Service PMIs in both Germany and France have weakened, signaling a clear slowdown in the region’s economy. This has sharply reduced expectations of further rate hikes from the ECB.
Meanwhile, Fed officials are doubling down on their hawkish tone, stressing that U.S. inflation remains sticky and interest rates may need to stay higher for longer.
The growing policy divergence between the ECB and the Fed is becoming undeniable – and that’s exactly why EURUSD continues to slide.

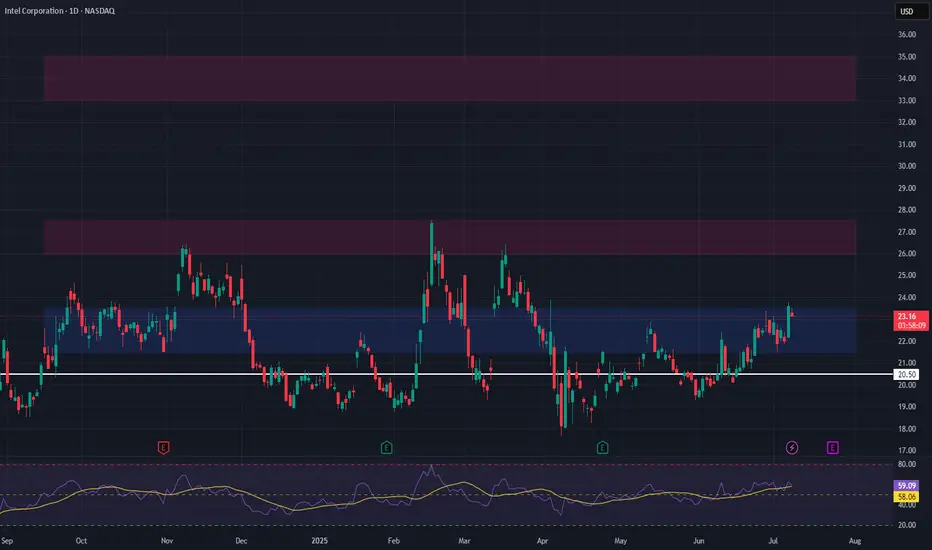
INTC Long Swing Setup – Break & Retest of Key ResistanceWe’re watching Intel NASDAQ:INTC for a clean break and retest of the $23.50 resistance level. A confirmed flip of this zone into support would signal trend strength and trigger a long spot entry.
📌 Trade Setup:
• Entry Zone: Around $23.50 (after confirmation as support)
• Take Profit Targets:
o 🥇 $26.00 – $27.50
o 🥈 $33.00 – $35.00
• Stop Loss: Daily close below $22.50