Gold at a Crossroads – Rebound or Breakdown?Gold just faced a sharp sell-off as optimism surged around a potential trade truce. After President Trump announced a 25% tariff on Japan and South Korea, the deadline was surprisingly pushed to August 1st, giving countries room to negotiate. That pause eased market fears and triggered a short-term risk-on sentiment.
But the real pressure came from a stronger US Dollar and 10-year Treasury yields hitting a two-week high – a deadly combo for gold, which offers no yield. The shift in capital flow toward safer, interest-bearing assets pushed gold further into the red.
Now, all eyes are on the upcoming Fed minutes and speeches from key officials this week. If the tone is hawkish, gold could lose further ground. But a dovish hint might spark a bounce from the $3,290 support zone.
Breakout!

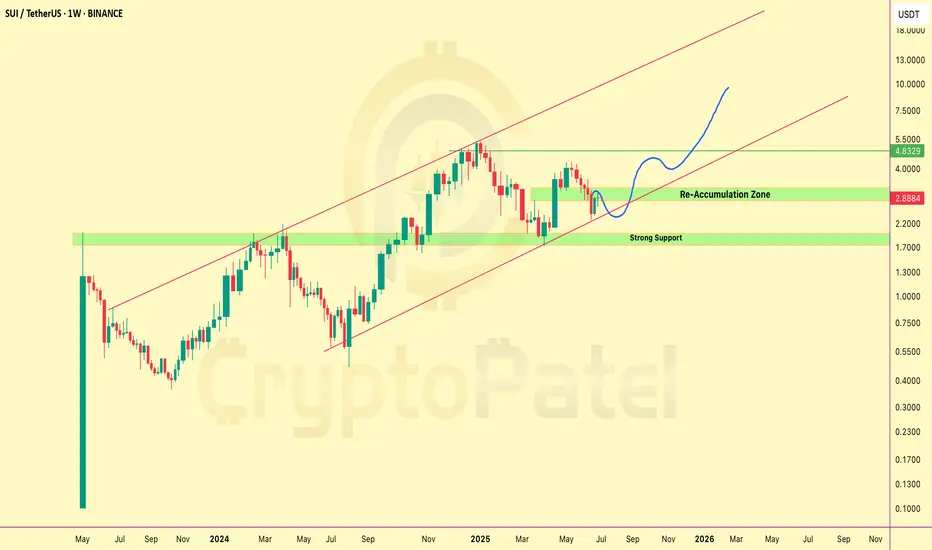
SUI to $10, $20.. Even $50? The Setup Looks Insane-Weekly ChartSUI is trading around $2.89, currently sitting in a key re-accumulation zone after a correction.
Trend: Still holding inside a long-term uptrend channel — structure remains bullish.
Support Zones:
🔹 $2.00–$2.50 is a strong demand area
🔹 $1.70 is a critical support — bullish above this,
but if price breaks below, we may enter major bearish mode
What to watch: If SUI holds this zone and continues upward:
🔹 Short-term target: $5/$10
🔹 Long-term potential: $20 → $50
I’m watching the $2.50 zone closely for possible long entries.
This could be a solid long-term opportunity if support holds.
NFA. DYOR.
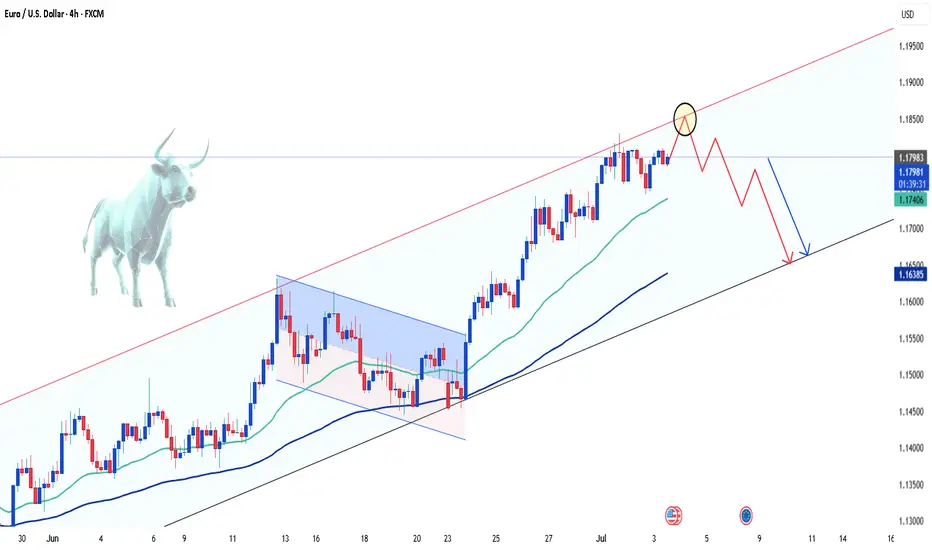
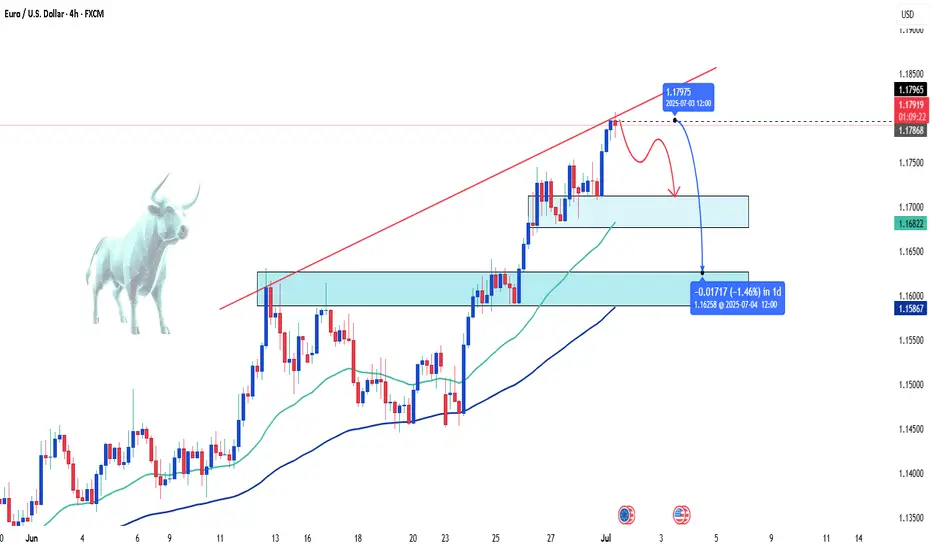
EURUSD - Sideways Action Sparks Reversal SpeculationHello traders, what are your expectations for EUR/USD?
Today, EUR/USD continues to move sideways around the 1.1800 mark during Thursday’s European session. The pair is showing signs of caution as the US Dollar gains ground amid optimism over a US–Vietnam trade deal.
From a technical perspective, the bullish trend still dominates as the price remains within an upward channel. However, a short-term pullback could be on the horizon, especially with buying momentum fading as EUR/USD approaches the upper boundary of the channel.
What do you think—could a reversal be forming from this zone?
Drop your thoughts in the comments!
Happy trading, everyone!
Caution Prevails as EUR/USD Tests Downtrend LimitsToday, EUR/USD continues to hover around 1.1780, following a mild downtrend amid ongoing economic uncertainty. With a light economic calendar and looming deadlines surrounding U.S. trade tensions—particularly with Europe—traders are steering clear of aggressive positions.
Despite the structurally weak U.S. dollar due to expectations that the Federal Reserve may cut interest rates, there is no clear bullish momentum for the euro, largely because of mixed signals from the European Central Bank (ECB).
As long as the pair fails to break through the technical resistance near 1.1760—the upper boundary of the current price channel—sellers maintain the upper hand.

JP Power - Are bad times over for this penny stock?Stock can fly if it gives a monthly closure above 25
Sharing only for educational purposes. Keep in watchlist to see who it unfolds.
Penny stocks should be strictly avoided for investment purposes.
Highly risky.

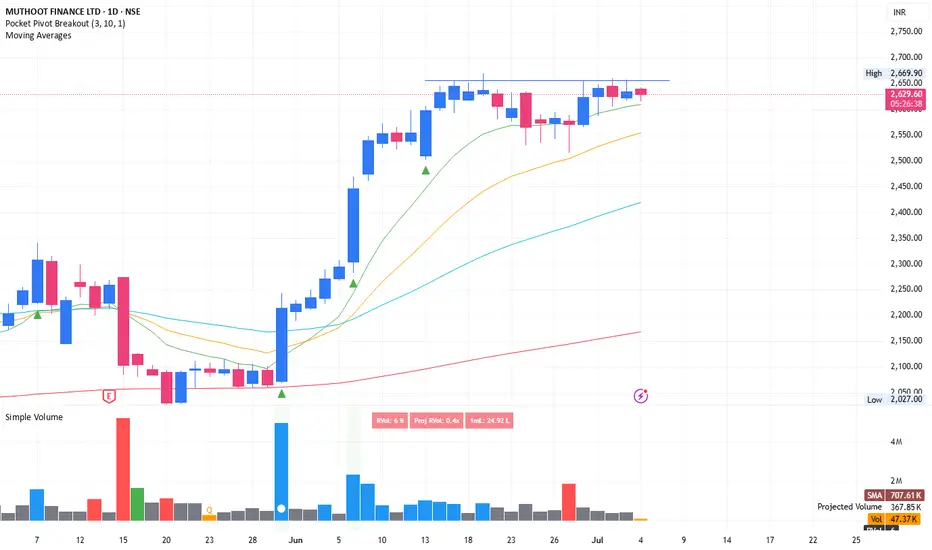
Swing trading opportunity, 1:4 Risk reward NSE:MUTHOOTFIN : Again coming up with swing trade idea. tight consolidation in range of 2% within last 5-6 days. Price is hovering around short term EMA. Looks like weak hands are exiting. Breaking above the pivot line (2655) could lead to significant push when crossing with good volume.
SL is somewhere around 3% (Refer the long position drawn over the chart).
One can invest 10% portfolio size as per following calculations
Position sizing and managing risk is the key.
Portfolio is: 1,00,000
Position size: 10,000
Risk 3%: 300. Which means only 0.3% of overall portfolio value is under risk.
Stay connected for commentary for coming days.
Disclaimer:
The information provided herein is for educational and informational purposes only and should not be construed as investment advice. The stock analysis and recommendations are based on publicly available information, data sources believed to be reliable, and our interpretation at the time of writing.
Investing in equities involves risks, including the risk of loss of capital. Past performance is not indicative of future results. Readers and investors are advised to conduct their own research or consult a qualified financial advisor before making any investment decisions.
The author(s), affiliates, or associated entities may hold positions in the stocks mentioned, and such positions are subject to change without notice.
We do not guarantee the accuracy, completeness, or timeliness of any information presented, and we disclaim any liability for financial losses or damages resulting from the use of this content.
EUR/USD: Waiting for the Next Move – What’s Your Take?Hello traders, let’s dive into EUR/USD with Kevinn!
📈 Market Update:
The euro is currently under pressure following dovish remarks from ECB officials, which have increased expectations that interest rates will remain unchanged for a prolonged period. Meanwhile, the US dollar is showing mild weakness as markets begin pricing in potential Fed rate cuts later this year — though the shift hasn't been strong enough to trigger a breakout in EUR/USD.
Upcoming CPI reports will be crucial in shaping future monetary policy expectations and could define the short-term direction of this currency pair.
🧠 Personal Take:
EUR/USD is trading around the 1.0720 zone, with market momentum currently lacking. A short-term pullback toward the support zone near the 34 and 89 EMA is possible. However, from a technical standpoint, the long-term bullish structure remains intact — at least for now.
So what do you think about EUR/USD's direction? Drop your opinion below!
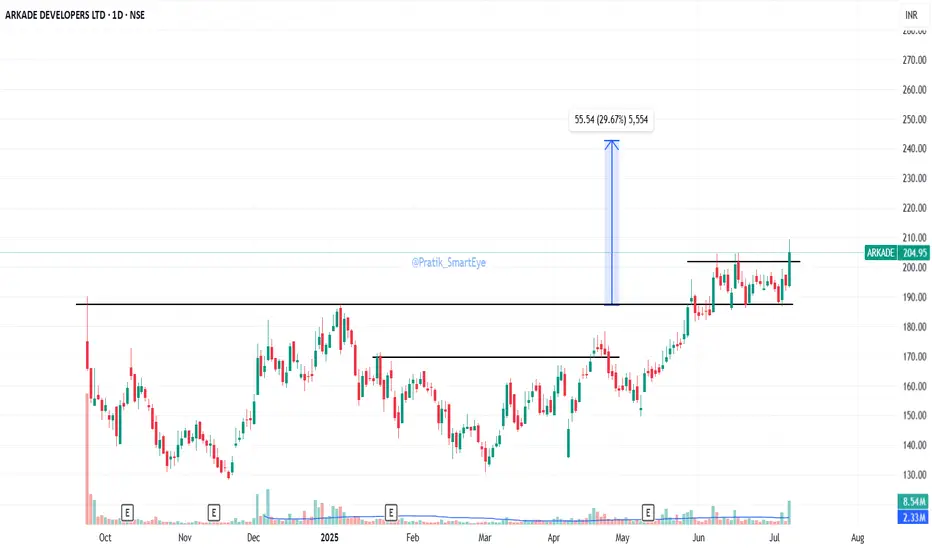
ARKADE: BreakoutARKADE: Breakout above sustained close of 201. CMP 199.
Resistance 243
Support 193/187
JP Power: Breaking Out After 6-Month ConsolidationNSE:JPPOWER : Breaking Out After 6-Month Consolidation
Price Action Analysis:
• Long-term Trend: Stock has been in a prolonged downtrend from highs of ₹23.77, finding support around ₹12.36
• Recent Pattern: Clear consolidation phase from December 2024 to May 2025 within a rectangular range
• Current Movement: Sharp breakout from consolidation with strong volume confirmation
• Momentum: Bullish momentum building with gap-up opening and sustained buying
Volume Analysis:
• Volume Pattern: Significant volume spike during current breakout session
• Volume Confirmation: Current volume of 195.09M vs average of 41.29M indicates strong institutional participation
• Historical Volume: Notable volume spikes during previous breakout attempts in October 2024
• Volume Quality: Expansion on up-moves and contraction during consolidation phases
Key Technical Levels:
Support Levels:
• Immediate Support: ₹16.35 (previous resistance turned support)
• Strong Support: ₹15.50-16.00 (consolidation base)
• Critical Support: ₹12.36 (52-week low and major support zone)
• Long-term Support: ₹12.00-12.50 (multiple bounce zone)
Resistance Levels:
• Immediate Resistance: ₹18.50-19.00 (previous swing high zone)
• Major Resistance: ₹20.00-20.50 (psychological level and previous rejection zone)
• Target Resistance: ₹22.00-23.00 (measured move target)
• Ultimate Resistance: ₹23.77 (52-week high)
Base Formation:
• Base Type: Rectangular consolidation base
• Base Duration: Approximately 6 months (December 2024 to May 2025)
• Base Range: ₹12.36 to ₹16.35
• Base Depth: Approximately 25% from highs
• Base Quality: Well-defined with multiple tests of support and resistance
Technical Patterns Identified:
Primary Pattern:
• Pattern: Rectangle/Box Consolidation with Breakout
• Formation Period: December 2024 to May 2025
• Breakout Confirmation: Volume-backed breakout above ₹16.35
• Pattern Reliability: High, given the extended consolidation period
Trade Setup:
Entry Strategy:
• Primary Entry: ₹17.50-17.80 (current levels with momentum)
• Pullback Entry: ₹16.50-17.00 (if stock retraces to test breakout level)
• Aggressive Entry: ₹18.00+ (breakout continuation trade)
• Conservative Entry: Wait for weekly close above ₹17.50 for confirmation
Exit Levels:
• Target 1: ₹19.50-20.00 (10-12% upside, resistance zone)
• Target 2: ₹22.00-22.50 (25-27% upside, measured move)
• Target 3: ₹24.00+ (35%+ upside, extension target)
• Trail Stop: Use a 15-20% trailing stop once the first target is achieved.
Stop Loss Strategy:
• Initial Stop Loss: ₹15.50 (below consolidation base)
• Risk: 12-15% from current levels
• Tight Stop: ₹16.00 (for aggressive traders)
• Weekly Close Stop: Below ₹15.80 on weekly closing basis
Position Sizing & Risk Management:
Position Sizing Guidelines:
• Conservative Approach: 2-3% of portfolio (given sector risks)
• Moderate Approach: 3-5% of portfolio
• Aggressive Approach: 5-7% of portfolio (only for risk-tolerant investors)
• Maximum Allocation: Not more than 10% due to sector concentration risk
Risk Management Framework:
• Risk per Trade: Limit to 1-2% of total capital
• Reward-to-Risk Ratio: Minimum 1:2, targeting 1:3
• Portfolio Heat: Consider correlation with other power/infrastructure stocks
• Sector Exposure: Monitor total exposure to the power sector
Sectoral Backdrop:
Power Sector Overview:
• Sector Trend: Power sector showing signs of revival with government's focus on renewable energy
• Policy Support: Government initiatives for power infrastructure development
• Demand Scenario: Growing power demand with industrial recovery
• Investment Climate: Increased capex allocation for power infrastructure
Industry Dynamics:
• Renewable Push: Shift towards renewable energy, creating opportunities
• Transmission Focus: Grid strengthening and transmission line expansion
• Financial Health: Gradual improvement in power sector financials
• Regulatory Environment: Supportive policies for power sector growth
Fundamental Backdrop:
Company Profile:
• Business: Power generation, transmission, and infrastructure development
• Promoter Group: Jaiprakash Associates Group
• Market Cap: Mid-cap power sector player
• Operational Status: Multiple power projects across different states
Key Fundamental Factors:
• Debt Levels: High debt burden remains a key concern
• Asset Quality: Mix of operational and under-construction assets
• Revenue Visibility: Power purchase agreements providing revenue stability
• Execution Risk: Project completion and commissioning risks
• Financial Stress: Historical financial challenges and restructuring efforts
Recent Developments:
• Debt Resolution: Ongoing efforts for debt restructuring and resolution
• Project Status: Updates on project commissioning and operations
• Regulatory Approvals: Progress on pending regulatory clearances
• Strategic Initiatives: Focus on operational efficiency and cost optimization
Risk Factors:
Technical Risks:
• False Breakout: Risk of failure at higher resistance levels
• Volume Sustainability: Need for sustained volume support
• Market Sentiment: Dependency on overall market conditions
• Sector Rotation: Risk of sector-specific selling pressure
Fundamental Risks:
• High Leverage: Elevated debt levels impacting financial flexibility
• Execution Risk: Project execution and commissioning challenges
• Regulatory Risk: Changes in power sector policies
• Liquidity Risk: Working capital and cash flow management issues
My Take:
My Technical Outlook:
• Short-term: Bullish momentum with breakout confirmation
• Medium-term: Potential for 25-30% upside if breakout sustains
• Long-term: Dependent on fundamental improvements and sector revival
My Investment Recommendation:
• Recommendation: Cautious Buy for technical traders
• Time Horizon: 3-6 months for technical targets
• Suitability: Risk-tolerant investors with sector understanding
• Monitoring: Close watch on volume patterns and sector developments
This analysis is based on technical patterns and should be combined with thorough fundamental research and professional advice before making investment decisions.
Keep in the Watchlist.
NO RECO. For Buy/Sell.
📌Thank you for exploring my idea! I hope you found it valuable.
🙏FOLLOW for more
👍BOOST if you found it useful.
✍️COMMENT below with your views.
Meanwhile, check out my other stock ideas on the right side until this trade is activated. I would love your feedback.
Disclaimer: "I am not a SEBI REGISTERED RESEARCH ANALYST AND INVESTMENT ADVISER."
This analysis is intended solely for informational and educational purposes and should not be interpreted as financial advice. It is advisable to consult a qualified financial advisor or conduct thorough research before making investment decisions.

Gold Slips Sharply to Start the Week – What’s Next?Hello everyone! What are your thoughts on gold today?
As the new trading week kicks off, gold has taken a sharp dive, shedding over 200 pips and currently hovering around $3,316 at the time of writing.
The short-term bearish momentum remains intact, especially after breaking below the key $3,325 support level. The confluence of the EMA 34, EMA 89, and the former support-now-resistance zone forms a critical ceiling. Unless the bulls manage to reclaim this area, the downward trend is likely to persist, keeping sellers in control.
So, what’s your outlook for gold? Is this just a dip—or the start of a deeper correction?

Gold Holds the Line and Rallies – A Strong Weekly Close in SightAfter holding firm at the support level around $3,250 per ounce, gold is on track to end this shortened trading week with a notable gain. This is an encouraging sign for investors, highlighting that gold’s appeal remains strong despite recent volatility.
The recent sell-off was not entirely unexpected, as the market recalibrates its interest rate expectations. However, the long-term bullish trend for gold remains intact, even as the price consolidates within a narrow range.
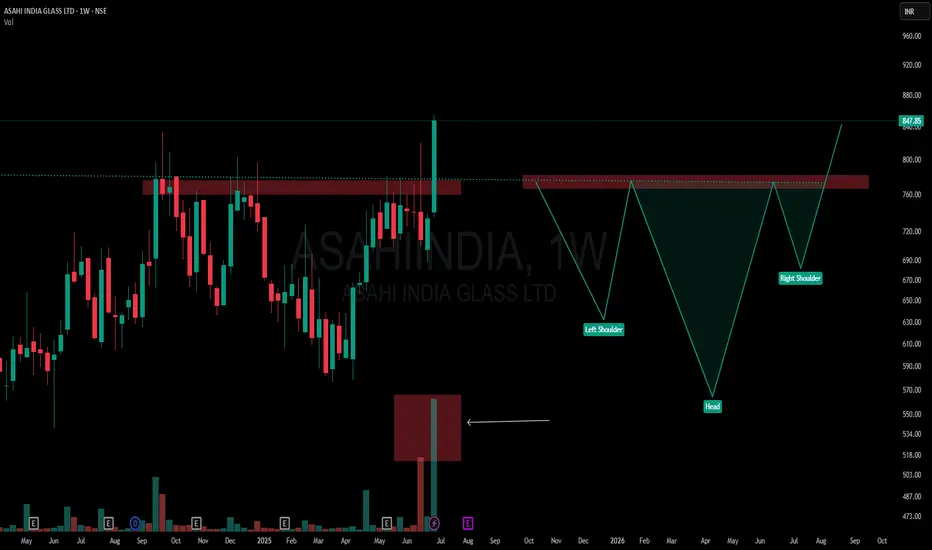
When Textbook Meets Extremes: Perfect Inverted Head and Shoulder📌 ASAHI INDIA GLASS | Weekly Timeframe
🧩 Pattern Breakdown (from a textbook lens):
-Left Shoulder: Formed after the Sept–Nov 2024 rejection
-Head: Created around Feb–May 2025 with a deeper dip
-Right Shoulder: Built through June 2025
-Neckline: ₹750–₹760 zone, tested multiple times
-Breakout Candle: High conviction — wide-bodied, strong close, with 17.61M volume
📘 According to classical technical analysis, Inverted Head & Shoulders patterns often signal a trend reversal. What's notable here is the context — the structure has developed after a sustained move upward, not from a bear phase.
🎯 The candle breaks above a long-standing supply zone with size, volume, and conviction — yet its location at the top makes it structurally interesting and unusual when viewed through traditional pattern psychology.
🚫 This is not a tip, call, or directional bias — just a visual log of structure and volume behavior.
💬 Chart interpretations welcome in comments.
Gabriel India Limited - Breakout Setup, Move is ON..#GABRIEL trading above Resistance of 518
Next Resistance is at 673
Support is at 415
Here are previous charts:
Chart is self explanatory. Levels of breakout, possible up-moves (where stock may find resistances) and support (close below which, setup will be invalidated) are clearly defined.
Disclaimer: This is for demonstration and educational purpose only. This is not buying or selling recommendations. I am not SEBI registered. Please consult your financial advisor before taking any trade.

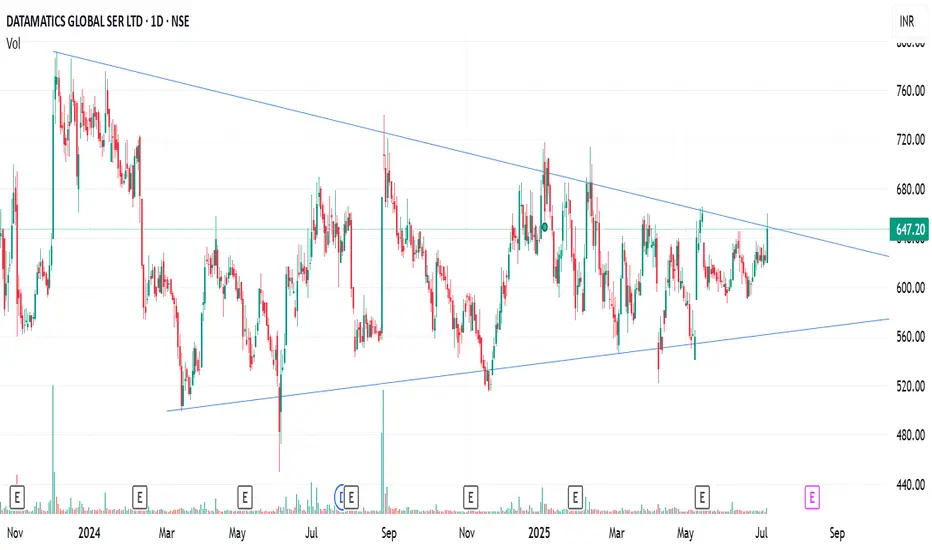
Datamatics Breakout | Swing tradeDatamatics will be giving a breakout soon. Its a triangle breakout.
I have little idea about fundamentals.
Lets see how it goes.
Is EURUSD About to Reverse? Key Support in DangerHello traders, what are your thoughts on EURUSD?
Today, EURUSD is facing a clear risk of a downside correction following stronger-than-expected Nonfarm Payroll data. This immediately boosted the US dollar, threatening the pair’s recent bullish momentum.
On the H4 chart, a CHOCH (Change of Character) pattern has just formed, signaling weakening buying pressure. If the price breaks below the 1.1745 support, the following BOS (Break of Structure) sequence could confirm a shift to a bearish market structure. With the Fed likely to maintain higher interest rates for longer and delay rate cut expectations, the USD stands to benefit further.
What do you think — could this be the start of a major reversal?

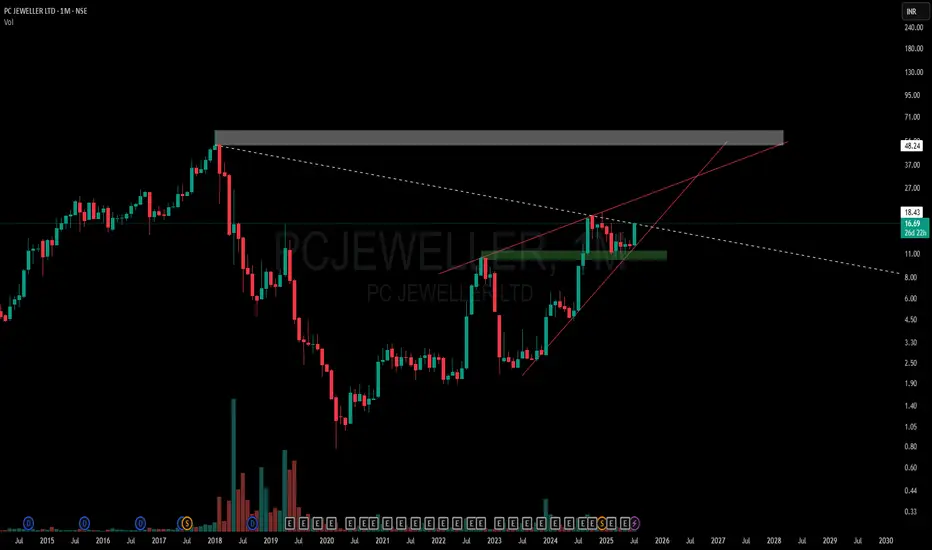
PC Jeweller at a Make-or-Break Zone: Structure Never Lies🔸 A long-standing Multi-Timeframe Compression Trendline (white dotted) remains active, and price is currently retesting this zone.
🔸 The grey supply zone marks the all-time high resistance, while the green box shows a recent zone that flipped from supply to demand — supported by a strong base formation.
🔸 A hidden structural pattern is emerging —
• One line forming a (HL - Hidden Line ) acts as rising resistance
• The other trendline offers solid ascending support
🔸 Price is getting tighter within this converging structure, while respecting historic levels.
📌 No forecast here — just highlighting key levels and behavior for context-driven traders.
TRANSRAIL LIGHTING (BREAKOUT)ATH Breakout
Point To Note
- Price Breakout Above Key ATH Resistance
- Supporting Upward Trendline
Wait For Retest
Next Possible Resistance
-759
-802
-854
Till Then Stay Focused, Keep Following Markets

Gold Pauses as Strong NFP Data Boosts the DollarHello traders!
Gold is currently hovering around $3,330 after Friday’s Non-Farm Payrolls (NFP) report came in stronger than expected, showing 147,000 new jobs — higher than both the previous reading (139,000) and forecasts (110,000). This pushed the US dollar slightly higher, placing temporary pressure on gold’s upside momentum.
However, broader market factors still support gold’s long-term bullish outlook. Concerns over US fiscal sustainability, continued central bank gold buying, and global growth fears remain key drivers for safe-haven demand.
Technically, gold continues to hold above the key support zone near $3,325, preserving its bullish structure. As long as this level holds, the upward trend remains valid.
👉 What’s your take after the latest NFP report? Will gold keep rising — or is a pullback on the way?
Will Gold Break Higher Ahead of US Jobs Data?Hello traders, what’s your take—will gold rise or fall today?
So far, the precious metal remains quiet, hovering around $3,345 without much movement since yesterday.
According to the CME FedWatch Tool, although the probability is still low, expectations are rising that the Federal Reserve might cut interest rates later this month. That’s a strong supportive factor for gold in the near term.
Technically, the next bullish target is a confirmed daily close above the key resistance level at $3,400.
On the news front, Thursday marks the most important data release of the month for the US—the June Non-Farm Payrolls (NFP) report, released a day early due to the Independence Day holiday. The market is expecting an increase of 110,000 jobs, down from 139,000 in May.
This release could be a gold mover: If the actual number is weaker than expected, it would likely reinforce Fed rate cut expectations—giving gold a bullish push.

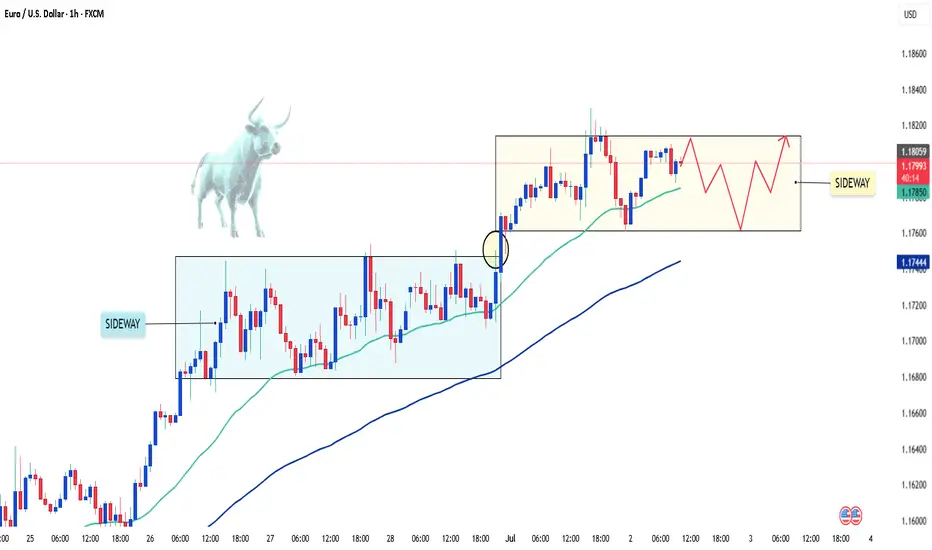
EURUSD: A Pause Before the Next Wave?After a strong breakout at the end of June, EUR/USD surged but has since entered a tight consolidation range. But don’t be discouraged — this could simply be a breather before the next big move!
On the chart, the bullish trend remains intact as price stays above key EMAs. Buyers aren’t backing down, and the market seems to be "catching its breath."
If EUR/USD breaks out of the current sideways zone around 1.1810, we could see another bullish leg aiming for higher levels.
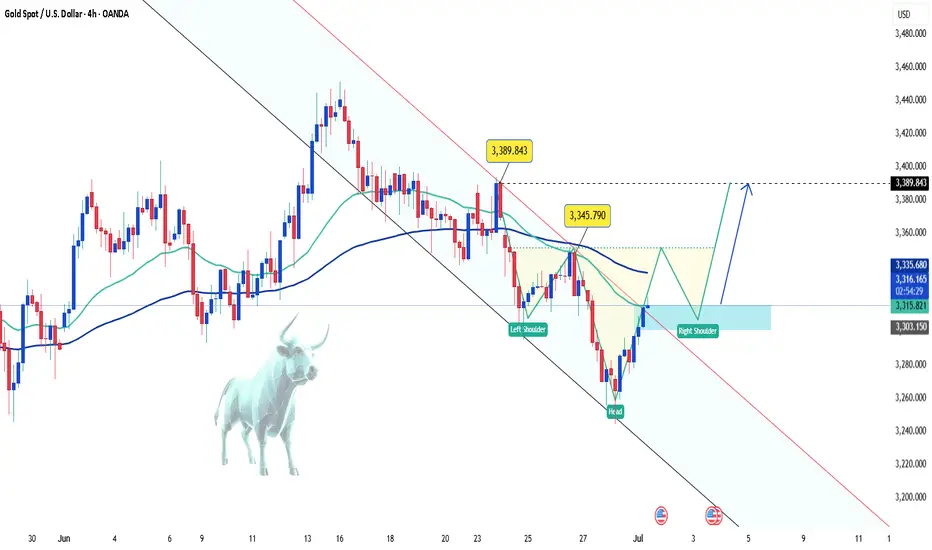
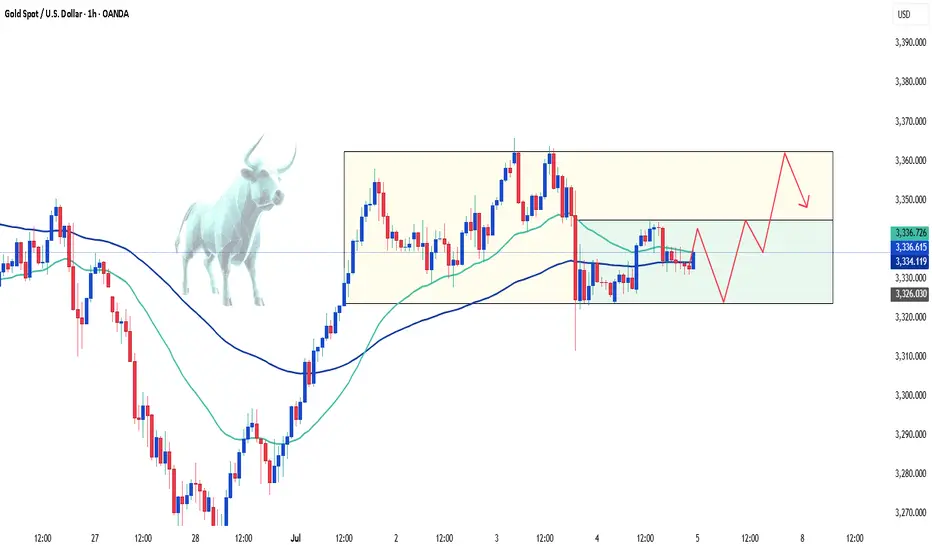
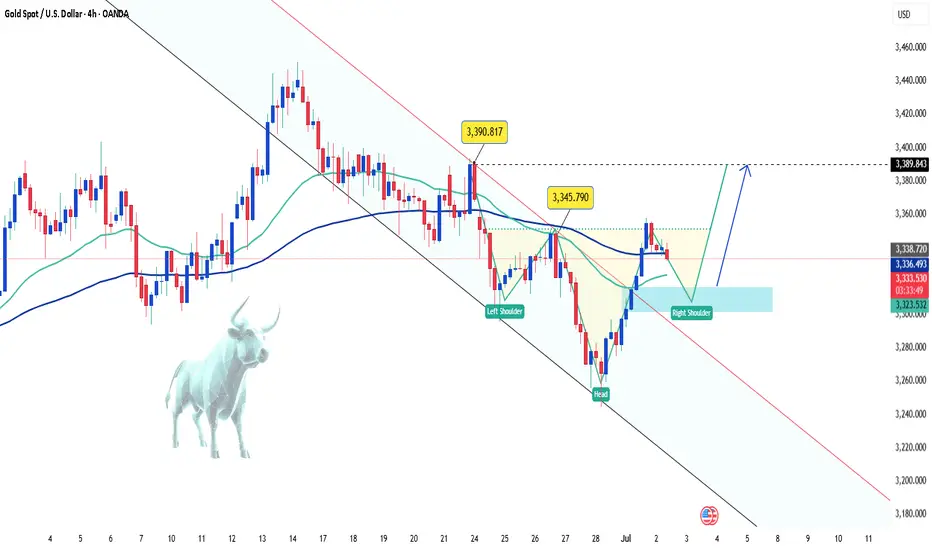
Gold Holds Strong Above $3,335 – Is $3,390 the Next Target?Hey traders!
Let’s take a quick look at what’s happening with gold today
Gold continues to hold its impressive bullish momentum, trading firmly above the $3,335 mark. The rally is fueled by a sliding US dollar and declining US Treasury yields, which are driving investors toward safe-haven assets like gold.
The US Dollar Index (DXY) has dropped to its lowest level since early 2022, while the 10-year Treasury yield sits around 4.19%. These conditions give the Federal Reserve more room to consider rate cuts—supporting gold’s upside.
Adding to the bullish case, fresh data shows a recovery in US manufacturing, further boosting demand for gold.
📈 On the technical side, gold is moving just as we anticipated: it’s broken out of the descending channel and is currently forming a bullish inverse head and shoulders pattern. If the pattern completes, we could see the next leg higher pushing toward $3,390.
What do you think — is gold ready for another breakout?
Drop your view below! 💬
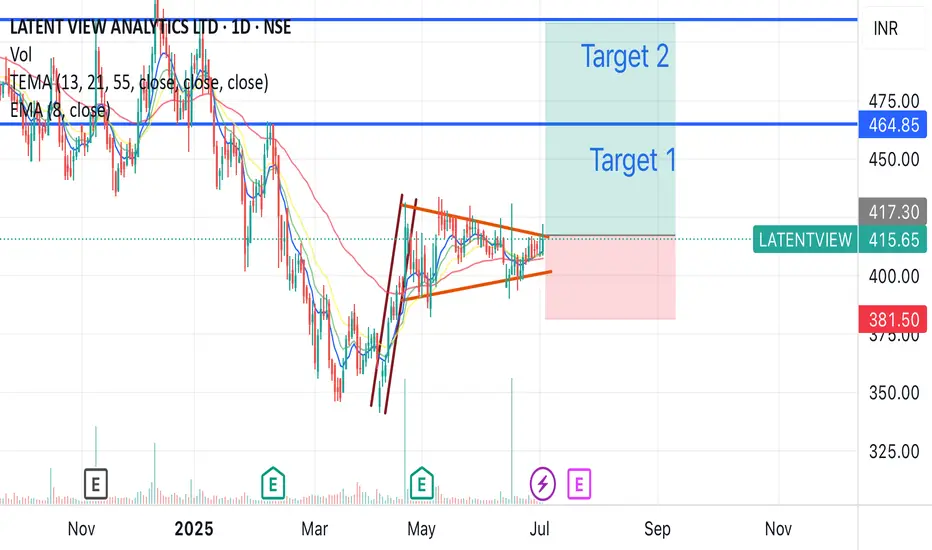
Latent view possible breakout after long consolidationLatent view might give a possible breakout as it is showing a long consolidation with flag and pole pattern, high volume was also seen a week back.
Also 55 Ema is below 8, 13, and 21 ema, which shows potential up movement
Buy around 415-420
Target - 508
Duration - 2-3 months
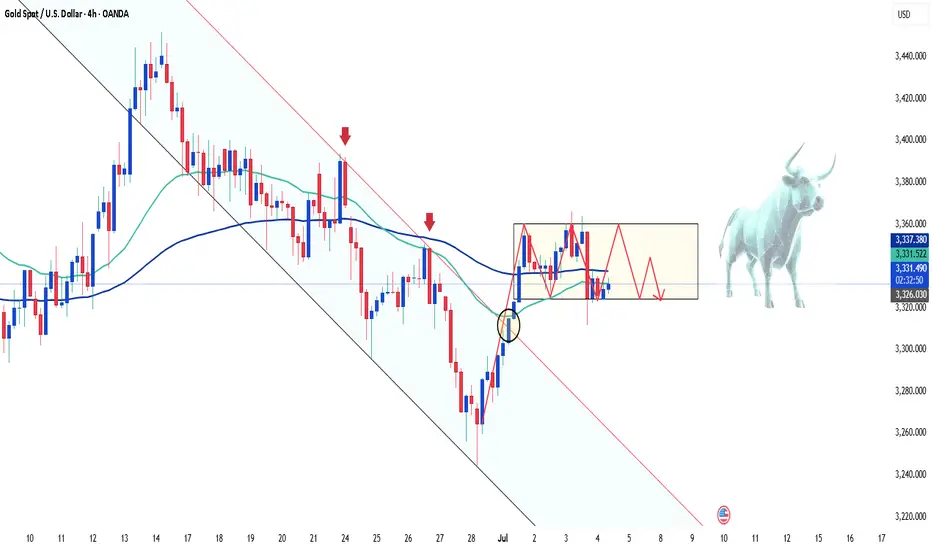
Gold Rises as Quarter Ends – Can Bulls Push Toward 3,345?June 30 marks the final trading day of both the month and the quarter, making it a key session for technical traders. On Monday, gold edged higher, supported by a weakening U.S. dollar. The greenback slid against the yen and dropped to its lowest level in nearly four years versus the euro, fueled by market optimism around U.S. trade deals. This helped reinforce expectations that the Federal Reserve might cut interest rates earlier than previously anticipated—giving gold the boost it needed to break above the 3,300 USD barrier.
From a technical perspective, short-term momentum now favors the bulls after a clear breakout above the descending parallel channel. If this move holds, the next upside target is projected near the 3,345 USD zone, as highlighted on the chart.
However, be careful because this can also be a fake breakout.