ICICIBANK - Fibonacci Reversal + Trendline Breakout Attempt💹 ICICI Bank Ltd (NSE: ICICIBANK)
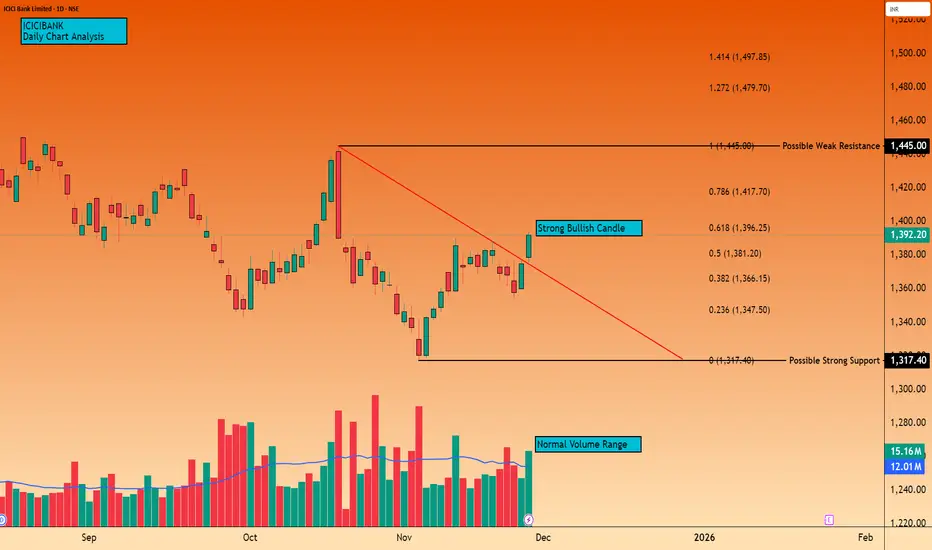
Sector: Banking & Financial Services | CMP: 1392.20 | View: Fibonacci Reversal + Trendline Breakout Attempt
Chart Pattern: Descending Trendline Breakout
Candlestick Pattern: Strong Bullish Momentum Candle
Swing High: 1445
Swing Low: 1317.40
STWP Trade Analysis:
Bullish Breakout Level: 1394
Stop Loss: 1353
Momentum: Strong
Volume: High participation buildup
The price has bounced sharply from the 0.382–0.5 Fibonacci retracement pocket, breaking above the descending trendline with a strong bullish candle. Volume expansion confirms active buying interest, signalling institutional accumulation from lower levels. The shift from contraction (falling structure) to expansion (breakout candle) indicates buyers reclaiming dominance and defending higher lows consistently.
Resistances:
1398.9 | 1405.6 | 1417.2
Supports:
1380.6 | 1369 | 1362.3
STWP Stock Analysis:
Final Outlook:
Momentum: Strong | Trend: Bullish Bias Developing | Risk: Moderate | Volume: High
ICICI Bank has rebounded strongly from the Fibonacci retracement structure, reclaiming key levels and breaking above the trendline that previously controlled price action. This confirms the transition from corrective movement into a fresh upward attempt. Volume strength shows that this move is not a random spike but a coordinated push from stronger hands.
RSI has turned upward from the balanced zone, CCI is strengthening above the positive threshold, and MACD is close to a momentum confirmation crossover — all indicating internal strength building behind the price. EMA compression across the last several sessions is easing, suggesting the early stage of a directional move.
The series of controlled declines over the past month resemble VCP-like contractions, followed by today’s momentum expansion candle. Sustaining above the 1381–1366 zone keeps the bullish structure intact and opens the path toward the resistance band at 1398 → 1405 → 1417, with 1445 acting as the extended resistance if momentum continues.
Overall, ICICI Bank stands at the onset of a potential continuation leg, backed by strong volume, clean Fibonacci structure, and a clear breakout from its corrective trendline. Holding the demand zones below will strengthen follow-through possibilities and create additional opportunities for traders on dips.
Traders should watch how the stock behaves on minor dips or pullbacks toward the 1381–1366 demand band. Healthy retests within this zone often provide strong secondary entries in momentum setups.
This document is strictly for educational and informational purposes. This analysis is purely observational and does not qualify as investment research under SEBI regulations. All examples, charts, levels, and structures discussed are illustrative and are not intended as buy, sell, or hold recommendations. STWP does not provide investment advice, trading tips, signals, or personalized financial guidance of any kind, nor is it a SEBI-registered intermediary or research analyst. The analyses and risk–reward structures included here are generic in nature and based on publicly available information, which may change without notice. Financial markets involve significant risk; derivatives in particular carry the potential for substantial losses. Readers are solely responsible for their trading decisions, capital management, and risk assessment.
Always consult a SEBI-registered investment advisor before making any financial decisions. STWP and its team shall not be liable for any direct or indirect losses arising from the use of this material. Historical patterns never guarantee future outcomes.
Position Status: No active position in ICICIBANK at the time of analysis.
Data Source: TradingView & NSE India.
💬 Found this useful?
🔼 Boost this post to support structured learning
✍️ Share your thoughts or questions in the comments
🔁 Forward this to traders who value clean technical studies
👉 Follow for disciplined, structured, STWP-style analysis
🚀 Stay Calm. Stay Clean. Trade With Patience.
Trade Smart | Learn Zones | Be Self-Reliant 📊
Breakout!
ESCORTS - Symmetrical Triangle Breakout Attempt
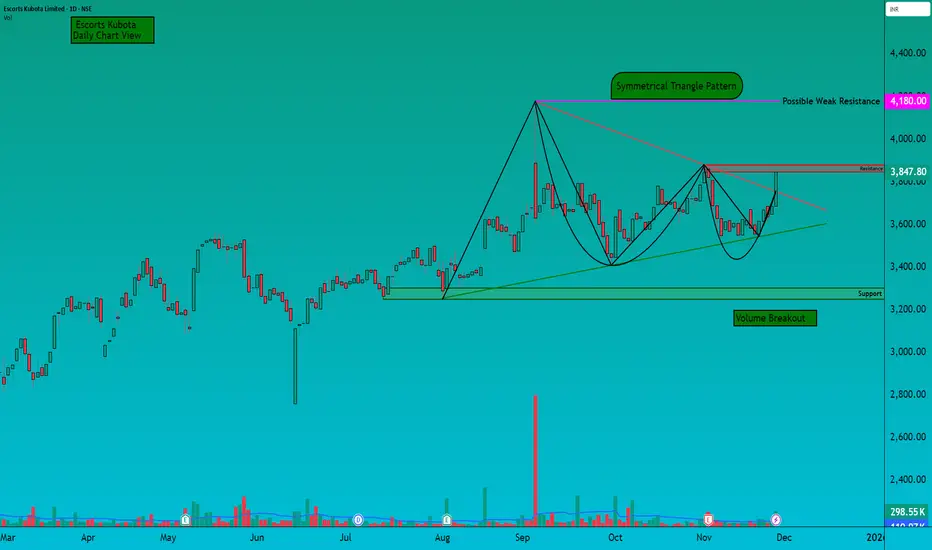
💹 Escorts Kubota Ltd (NSE: ESCORTS)
Sector: Machinery & Tractors | CMP: 3847.80 | View: Symmetrical Triangle Breakout Attempt
Chart Pattern: Symmetrical Triangle Pattern
Candlestick Pattern: Strong Bullish Momentum Candle
Swing High: 4180
Swing Low: 3250
STWP Trade Analysis:
Bullish Breakout Level: 3880
Stop Loss: 3535
Momentum: Strong
Volume: High institutional participation
The price has pushed strongly from the rising demand line, breaking into the upper zone of the triangle pattern with a decisive bullish candle. The surge in volume confirms institutional activity, and the structure shows a clear shift from compression into expansion. Buyers have regained dominance and are defending higher lows consistently.
Resistances:
3915 | 3982 | 4105
Supports:
3725 | 3662 | 3535
STWP Stock Analysis:
Final Outlook:
Momentum: Strong | Trend: Bullish Bias Developing | Risk: Moderate | Volume: Very High
Escorts Kubota has completed a clean coiling phase inside a symmetrical triangle and has now delivered a strong bullish candle directly into the breakout zone. Volume expansion confirms that this is not a random spike — it reflects accumulation by stronger hands.
RSI has rebounded toward the balanced zone, Stochastic has turned upward from oversold territory, and MACD is preparing for a positive signal, reflecting internal strength building beneath the price. EMA compression is easing gradually, hinting at the start of a new directional phase.
The VCP-like contractions across the last two months indicate a steady reduction in volatility, followed by today’s expansion candle — a behaviour often associated with the first ignition leg of a breakout. Sustaining above 3725–3662 keeps the bullish bias intact and allows the stock to challenge the upper resistance band near 3915 → 3982 → 4105.
Overall, Escorts Kubota stands at the edge of a potential breakout continuation, supported by strong volume, healthy structure, and a clear upshift in price behaviour. Holding the demand zones below can unlock further upside toward the higher resistance levels.
Traders should watch how the stock behaves on minor dips or pullbacks toward the 3719.60 - 3620.10 demand band. Healthy retests within this zone can strengthen the breakout structure and often act as secondary entry points in strong momentum setups
⚠️ Disclaimer
This document is strictly for educational and informational purposes. All examples, charts, levels, and option structures discussed are illustrative and are not intended as buy, sell, or hold recommendations. STWP does not provide investment advice, trading tips, signals, or personalized financial guidance of any kind, nor is it a SEBI-registered intermediary or research analyst.
The analyses, illustrations, and risk–reward structures included here are generic in nature and based on publicly available data and observed market behaviour, which may change without notice. Financial markets involve significant risk; derivatives in particular carry the potential for substantial losses. Option premiums, implied volatility, open interest, delta, and other market variables can fluctuate rapidly and unpredictably. Readers are solely responsible for their trading decisions, capital management, and risk assessment. Before making any investment or trading decision, please consult a SEBI-registered investment advisor. STWP, its representatives, and affiliates shall not be liable for any direct or indirect loss arising from the use of this material. Historical patterns or past market behaviour do not guarantee future outcomes. Nothing in this document should be interpreted as a promise of performance, accuracy, or returns.
Position Status: No active position in ESCORTS at the time of analysis.
Data Source: TradingView & NSE India .
💬 Found this useful?
🔼 Boost this post to support structured learning
✍️ Drop your thoughts or questions in the comments
🔁 Share with traders who benefit from clean technical studies
👉 Follow for disciplined, structured, STWP-style analysis.
🚀 Stay Calm. Stay Clean. Trade With Patience.
Trade Smart | Learn Zones | Be Self-Reliant 📊
BUY TODAY SELL TOMORROW for 5%DON’T HAVE TIME TO MANAGE YOUR TRADES?
- Take BTST trades at 3:25 pm every day
- Try to exit by taking 4-7% profit of each trade
- SL can also be maintained as closing below the low of the breakout candle
Now, why do I prefer BTST over swing trades? The primary reason is that I have observed that 90% of the stocks give most of the movement in just 1-2 days and the rest of the time they either consolidate or fall
Resistance Breakout in ESCORTS
BUY TODAY SELL TOMORROW for 5%

Is BTCUSD (Bitcoin) heading towards $91,000?Hello!
BTC has finally broken through its main downward trendline, signaling a shift in market sentiment after a prolonged period of selling pressure. Following this breakout, the price formed a clear inverse head and shoulders pattern, indicating that buyers have stepped in strongly after the final liquidation at the head level. Since then, BTC has been moving within a clearly defined ascending channel, consistently creating higher highs and higher lows, which confirms the bullish trend.
As long as the price respects the lower boundary of this channel, the bullish structure remains intact. The next significant resistance lies between the 92,500 and 93,000 levels, which also aligns with the previous breakout area you marked. This area is likely to attract sellers, making it a realistic target for the current move.
Overall, the chart continues to support an upward movement towards the 93K level, unless the price breaks below the channel support, which would weaken the bullish reversal setup.

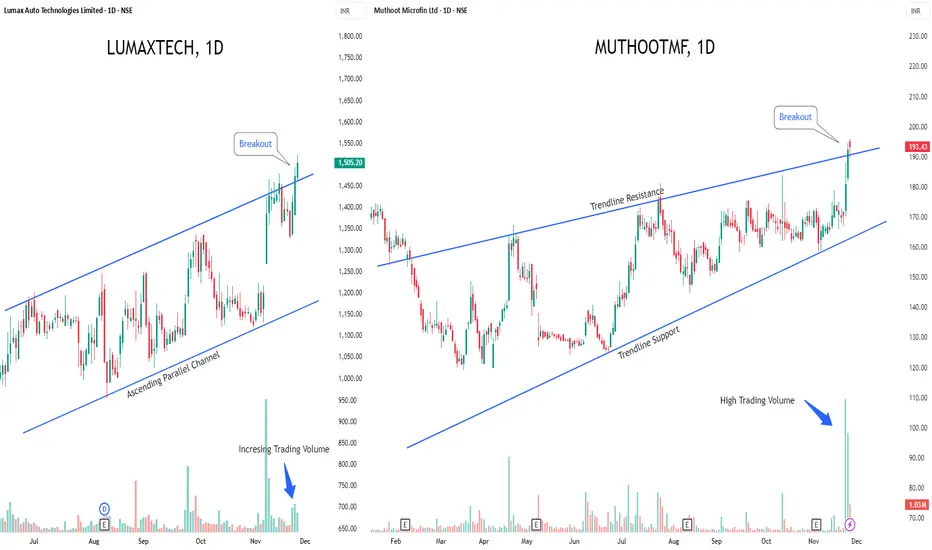
LUMAXTECH & MUTHOOTMF - Breakout Stocks to Watch This Week!1️⃣ Lumax Auto Technologies NSE:LUMAXTECH — Fresh Breakout Alert
Lumax is riding a strong uptrend and has cleanly broken above the upper boundary of its ascending parallel channel.
If this breakout sustains, the stock could see a sharp upside rally ahead.
Rising volumes are confirming strong buyer interest, giving this move an extra edge.
2️⃣ Muthoot Microfin NSE:MUTHOOTMF — Failed Rising Wedge, Strong Reversal Setup
A failed rising wedge pattern is playing out as the price has broken above the trendline resistance, flipping the structure into a bullish signal.
Even better — heavy volume buildup is reinforcing the strength of this emerging reversal.
⚡Both counters show early signs of momentum — watch for follow-through!
Gravita Triangle Breakout 1DGravita is attempting to breakout after forming a triangle pattern on 1D timeframe with high volumes. The stock is also trading above 200ema. Enter after bullish confirmation.

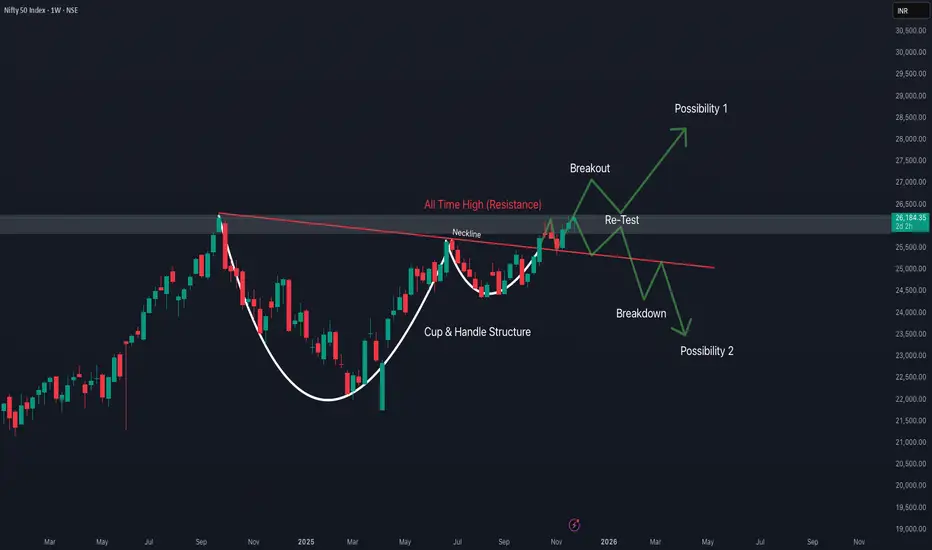
Weekly Price Action in Nifty 50The chart shows a classic Cup & Handle pattern
The cup is wide and smooth – a strong long-term accumulation pattern.
The handle is small, healthy, and formed near resistance → a sign of strength.
These patterns on the weekly chart typically lead to multi-month rallies.
The chart structure is strongly bullish unless Nifty falls below 25,500.
A Short Gold Sell Opportunity You Can't MissLooking at the chart, gold continues to move steadily within a clear downtrend channel, with each peak and trough forming progressively lower levels over time. Currently, the price is approaching the upper boundary of the channel and interacting with the same resistance area where sellers have stepped in multiple times before, forcing the market to reverse. This behavior strongly indicates that the potential for a continued corrective move downward, in line with the main trend, remains intact.
With this in mind, I believe a price decline toward the 4,080 level is a reasonable and logical target for the current correction. As long as the price hasn’t clearly broken through the upper boundary of the channel, I will continue to favor the scenario where the bearish trend remains dominant, viewing any upward movement as a mere pullback within the overall structure.
This is not financial advice, but simply my personal perspective based on the current price action.

Bitcoin Ready to hit New Low?BITCOIN QUICK UPDATE: LEVELS PLAYING OUT EXACTLY AS EXPECTED
As we mentioned earlier, the $88,600 FVG has now been fully filled, and CRYPTOCAP:BTC is currently trading below that zone.
Here’s what matters next:
🔹 If $85,000 holds as support → BTC likely pushes toward the next major Bearish Order Block at ~$93,000.
High probability this zone gets tapped.
🔹 If BTC fails to reclaim and break above $88,000 → expect a deeper leg down toward ~$75,000.
Stay sharp. NFA.

BTCUSD: Overbought Rally Approaches Strong Support ZoneBINANCE:BTCUSD is nearing a crucial support zone, one where buyers have consistently stepped in before and sparked significant reversals. This price history alone makes this level incredibly important to watch closely. Price is approaching this zone once more, and the current market structure suggests potential for a bullish move if we see signs of rejection, such as a strong bullish engulfing candle, long lower wicks indicating absorption of selling pressure, or an uptick in buying volume.
If this support holds, I anticipate price will push towards the 98,700 area, fitting well with a short-term rebound scenario. However, if price breaks through this support and remains below it, the bullish thesis will be invalidated, opening up the possibility for a deeper pullback.
The best approach here is to wait for confirmation from the chart. Pay attention to how candles close, how volume behaves, and only consider long positions if the market defends this support level clearly. Solid risk management is key: position sizing, stop loss placement, and invalidation levels should always be aligned with the volatility that could arise around such a critical area.
This is just my personal view on the current support and resistance structure, not financial advice. Always do your own research and trade with a well-structured risk management plan. Best of luck out there!

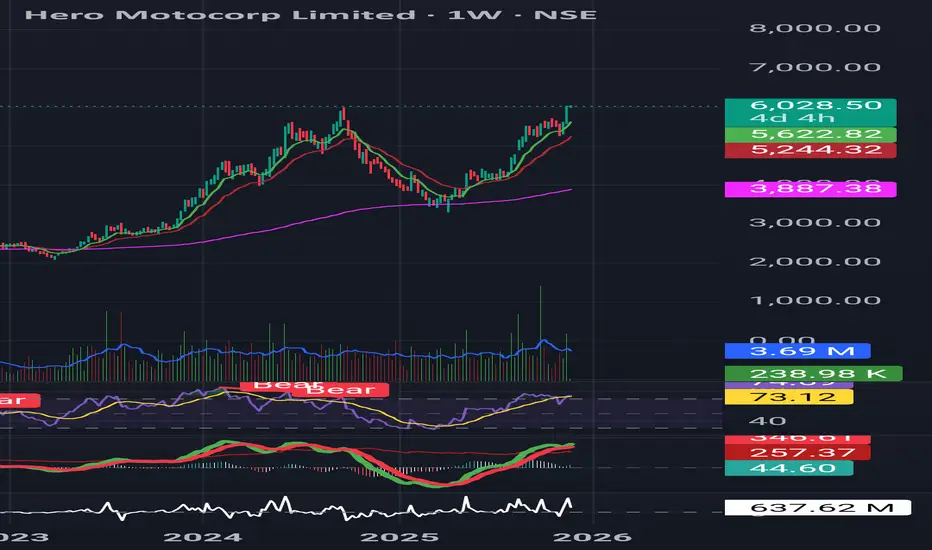
Hero MotoCorp — Saucer Continuation Pattern DevelopingHero MotoCorp is forming a saucer continuation structure on both daily and weekly charts.
Price is retesting the breakout zone around ₹6040 with low volume and small-bodied candles — a healthy momentum pause.
What’s strong:
• Trend intact (9/21/200 EMA rising)
• MACD bullish
• RSI holding strong despite flattening
• EFI above zero → buying pressure intact
• Weekly timeframe supports the same setup
Trade Plan:
• Entry: Close above ₹6040 with 2× volume
• SL: ₹5918 (ATR-based)
• Targets: ₹6442 → ₹6744
Trend remains bullish as long as price holds above 9/21 EMA.
Gold Trading Strategy for 500 Pips!Hey traders,
As we roll into a brand-new week, gold is showing some impressive stability. XAUUSD is hanging right around the 4,050-dollar mark, and despite the quiet price action, there’s a lot happening beneath the surface that’s worth paying attention to.
The market right now is in “wait-and-see” mode as everyone watches the Federal Reserve’s next moves. Over the past few days, expectations have started to shift—more traders believe the Fed may slowly pivot toward a softer stance and potentially move closer to cutting rates by the end of the year. Because of that, bond yields have been drifting lower, the dollar is losing some of its strength, and demand for safe-haven assets like gold is starting to rise again. All of these elements together create a strong backdrop for potential upside in the short term.
On the technical side, XAUUSD is tightening inside a clean triangle structure, and for those who follow price action closely, you know what that usually means: the market is building pressure. When price consolidates this way, it often sets the stage for a strong breakout. If buyers can push through the upper boundary of this triangle, the next logical target sits up near the 4,500-dollar zone — right in line with the momentum we saw during the last bullish move.
How about you? What’s your take on this setup? Are you leaning toward another leg up, or do you think the market is prepping for a pullback first?
Wishing you a great week of trading—focused, confident, and full of solid opportunities.

BUY TODAY SELL TOMORROW for 5%DON’T HAVE TIME TO MANAGE YOUR TRADES?
- Take BTST trades at 3:25 pm every day
- Try to exit by taking 4-7% profit of each trade
- SL can also be maintained as closing below the low of the breakout candle
Now, why do I prefer BTST over swing trades? The primary reason is that I have observed that 90% of the stocks give most of the movement in just 1-2 days and the rest of the time they either consolidate or fall
Trendline Breakout in Anuras
BUY TODAY SELL TOMORROW for 5%

Venus Remedies Limited - Breakout Setup, Move is ON...#VENUSREM trading above Resistance of 638
Next Resistance is at 1182
Support is at 424
Here is previous chart:
Chart is self explanatory. Levels of breakout, possible up-moves (where stock may find resistances) and support (close below which, setup will be invalidated) are clearly defined.
Disclaimer: This is for demonstration and educational purpose only. This is not buying or selling recommendations. I am not SEBI registered. Please consult your financial advisor before taking any trade.

Gold at a Crossroads: Up or Down?If we zoom in and carefully observe how the GOLD price is moving, it becomes immediately clear:
The market has just shown a very strong upward impulse, but now something interesting is happening. The price is tightening and forming a small, narrow triangle, which indicates that the market is accumulating energy. In these situations, there are usually two possible directions, but given the clearly bullish context, I feel that a breakout to the upside is much more likely.
What do you think? Do you agree with me?
Leave your thoughts in the comments. And trust me, being part of the TradingView community will help you improve every day as a trader.
Of course, this is not financial advice, just my personal view on the chart.

The Gold Bullish Setup You Can't Miss!OANDA:XAUUSD The price is clearly approaching a critical support zone, one that has previously triggered positive reactions in the market. This zone also aligns closely with the psychological level of $4,000, which tends to capture the market’s full attention.
Given the current momentum, there’s a strong possibility that buyers will step in and push prices higher. A confirmation, such as a solid rejection pattern, a bullish engulfing candle, or a long lower shadow, would significantly increase the likelihood of a rebound. If my analysis proves accurate, and buyers regain control, we could see the price rise to around $4,070.
However, if the price breaks below this key support, it would negate the bullish outlook and could lead to further declines.
Please note, this is not financial advice!

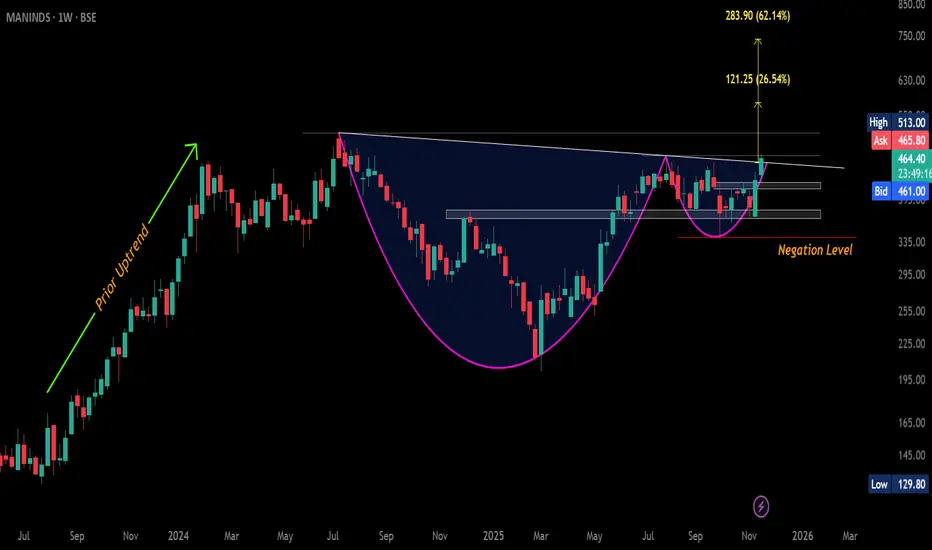
#MANINDS: Big Weekly Breakout Loading!CMP: 464.40
A large weekly cup-and-handle is taking shape, with a strong bullish candle signaling a breakout attempt.
🛡 Supports: 437 / 523 – 413 / 380 – 367
🚧 Resistances: 469 / 513 (ATH)
⚡️ Breakout Trigger: WCB above 469
🎯 Pattern Targets: 578 / 740+ (~26% & ~62% from CMP)
⛔ Negation: WCB below 340.90
#ManInds #CupAndHandle #ChartPattern #PriceAction #Breakout #LongTerm
📌 #Disclaimer: This analysis is shared for educational purposes only. It is not a buy/sell recommendation. Please do your own research before making any trading decisions.
BUY TODAY SELL TOMORROW for 5%DON’T HAVE TIME TO MANAGE YOUR TRADES?
- Take BTST trades at 3:25 pm every day
- Try to exit by taking 4-7% profit of each trade
- SL can also be maintained as closing below the low of the breakout candle
Now, why do I prefer BTST over swing trades? The primary reason is that I have observed that 90% of the stocks give most of the movement in just 1-2 days and the rest of the time they either consolidate or fall
Trendline Breakout in ASHAPURMIN
BUY TODAY SELL TOMORROW for 5%

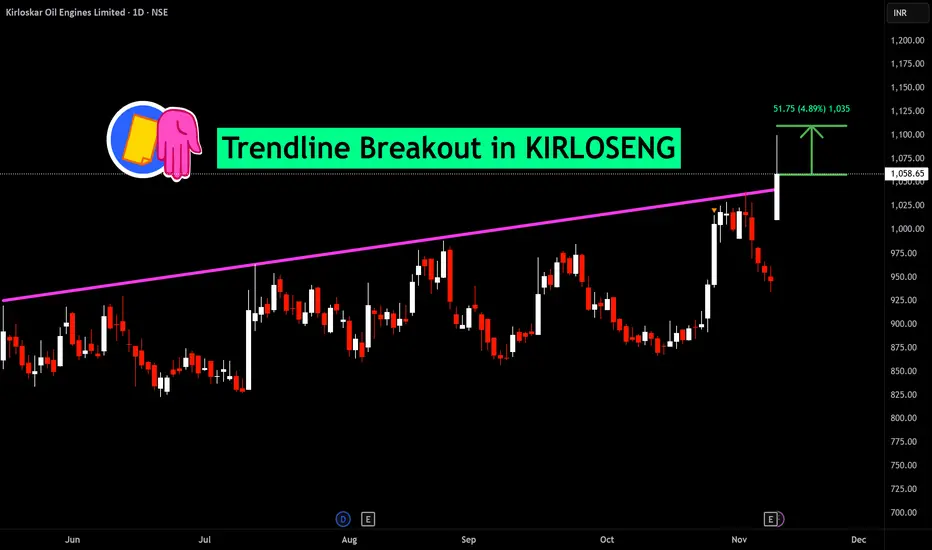
BUY TODAY SELL TOMORROW for 5%DON’T HAVE TIME TO MANAGE YOUR TRADES?
- Take BTST trades at 3:25 pm every day
- Try to exit by taking 4-7% profit of each trade
- SL can also be maintained as closing below the low of the breakout candle
Now, why do I prefer BTST over swing trades? The primary reason is that I have observed that 90% of the stocks give most of the movement in just 1-2 days and the rest of the time they either consolidate or fall
Trendline Breakout in KIRLOSENG
BUY TODAY SELL TOMORROW for 5%
Cup and Handle Detected: A Bullish Outlook for XAUUSDOANDA:XAUUSD is forming a very clear Cup and Handle pattern. Price previously dropped toward the 4000 region, rounded out, and then climbed back toward 4080, completing the cup structure. At the moment, the market is making a mild pullback and shaping a tight and well controlled handle.
If price can break this resistance with strong momentum, the next target I expect is around 4150. Until a confirmed breakout appears, patience remains essential. No breakout means no trade.
This is a classic bullish formation, and market expectations are gradually strengthening.

XAUUSD: Likely continuation following pullbackXAUUSD has surged into a strong uptrend, and I predict that this momentum will continue, with a potential target around 4,150, as shown on my chart.
The current price level may be a critical turning point. Here, the price could find support and continue to rise, or if it breaks below, we might see an extension of the downward trend.
If I had to choose a direction, I would lean towards more upside, but the final decision should be based on price action to determine the next move.
However, if the price breaks decisively below the trendline, it would invalidate the bullish scenario, indicating that the uptrend could pause or even reverse in the short term.
These are just my personal views based on chart analysis, not financial advice. Always verify your setups and manage your risk carefully.

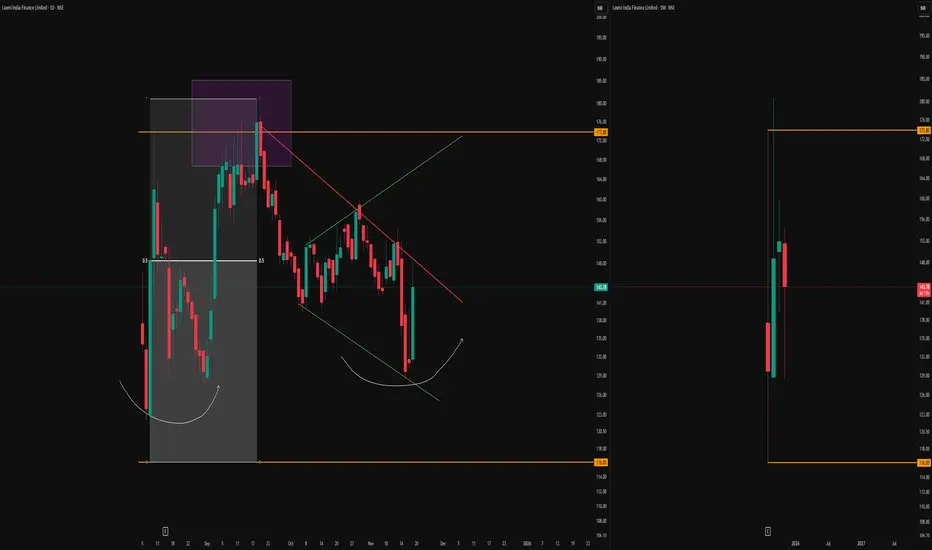
Multi-Timeframe Structure and Supply Observations-Green Broadening Pattern
A distinct broadening pattern is forming, mapped out by the green lines on the daily chart. This structure highlights expanding volatility, which often captures both swing highs and lows as price oscillates between opposing boundaries.
-Monthly High-Low Anchors
The orange horizontal lines represent the high and low of the first monthly candle, visible on the right—these serve as crucial long-term reference levels.
-Purple Box and Monthly Supply Manipulation
Up near the orange monthly resistance, the purple box marks a period of price interaction and ‘manipulation’ around the top supply. This box encapsulates a classic area where aggressive sellers and liquidity seekers converge, sometimes engineering fakeouts or squeezes before the real direction is chosen.
-Equilibrium and Rounded Higher Lows
Within the broadening pattern, a clear equilibrium zone is formed (represented by the midline drawn through the structure). This acts as a median for price oscillations and often becomes a pivot for both upward and downward moves. The two semi-circular white arcs on the left chart illustrate the emergence of higher lows
-Context from Monthly Timeframe
On the right, the monthly chart remains essential for framing all of the above
This analysis is solely observational and intended for educational purposes. No forecasts or trade signals are provided. Please exercise full discretion and undertake your own due diligence before making any trading decisions.
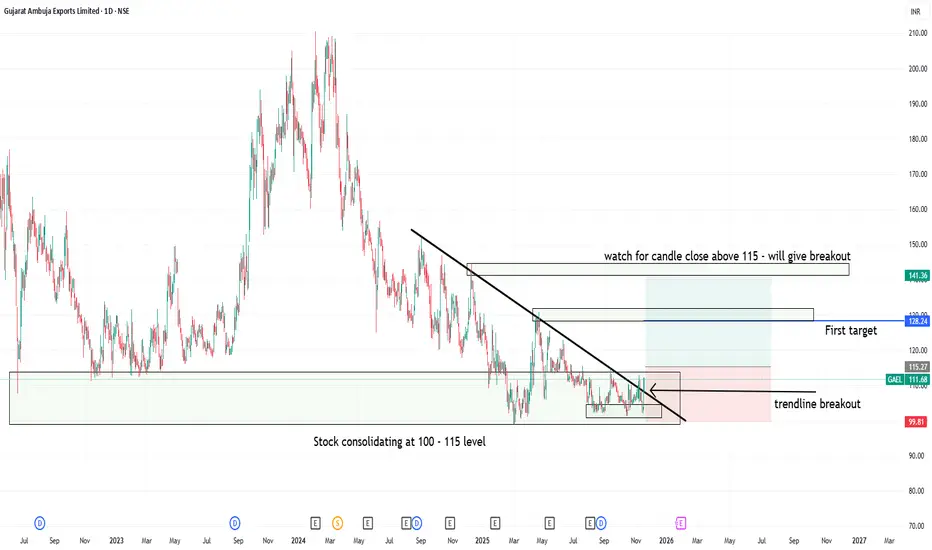
Trendline breakout at support level in GAEL1. Gujrat ambuja export lt- showing consolidation at 100 to 115 levels
2. Candle close above 115 can trigger consolidation breakout at strong support zone
3. Trendline breakout has already happend but above 115 close will be safe and logical
4. Good Risk:Reward one can watch for upside movement with strict sl level