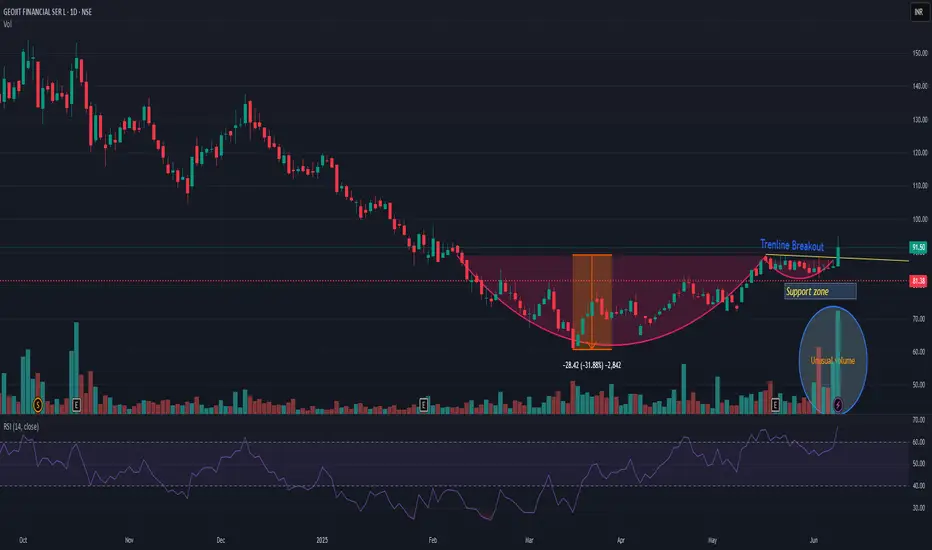
GEOJITFSLGEOJITFSL showing strength and has given short term breakout. Cup and handle pattern has also been observed. Now if I see pattern target then 25-30% up side is possible. Since September highest volume also observed today. My view will be changed if it closes below 81. Risk reward is quite in favor.
Breakout!
Amber Enterprise - Symmetrical Triangle Breakout from a Symmetrical triangle on a weekly chart
Triangle Height : 2100 points
Breakout above 6650 (breakout done)
Target : 8740 (Return 31-32%)
#Medium Term Trade.
Indicators are also showing strength for upside.

Inside 2 Weekly Timeframe CT Breakouts With Strong VolumesPurely chart-based view. No bias. No advice. Just how I interpret these right now
I make educational content videos on Swing trading .

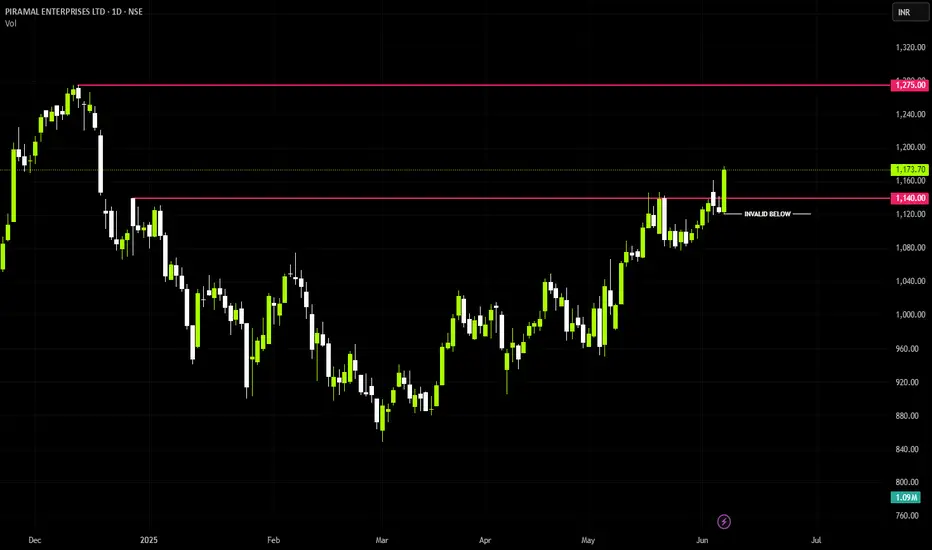
PEL (LONG)Price broke out above key resistance level of 1140 rs
Points Co-Relating
- Break Of Resistance
- Ema-21,50,200 Lined Up Bullish
- Big Bar Breakout
Next Level = 1275
Till Then, Stay Focused
STOCK - PFC (POSSIBLITY OF LONG HAPPENDING)Price seen breaking out a downward trendline
Retest is pending
Near Support -400 Rs
Resistance - 444
Resistance - 474
Resistance - 523
Till Then Stay Focused,

NDR Auto Components Ltd - Breakout Setup, Move is ON...#NDRAUTO trading above Resistance of 1476
Next Resistance is at 1938
Support is at 1094
Here are previous charts:
Chart is self explanatory. Levels of breakout, possible up-moves (where stock may find resistances) and support (close below which, setup will be invalidated) are clearly defined.
Disclaimer: This is for demonstration and educational purpose only. This is not buying or selling recommendations. I am not SEBI registered. Please consult your financial advisor before taking any trade.

Fiem Industries - Long Setup, Move is ON...#FIEMIND trading above Resistance of 2317
Next Resistance is at 3624
Support is at 1510
Here are previous charts:
Chart is self explanatory. Levels of breakout, possible up-moves (where stock may find resistances) and support (close below which, setup will be invalidated) are clearly defined.
Disclaimer: This is for demonstration and educational purpose only. This is not buying or selling recommendations. I am not SEBI registered. Please consult your financial advisor before taking any trade.

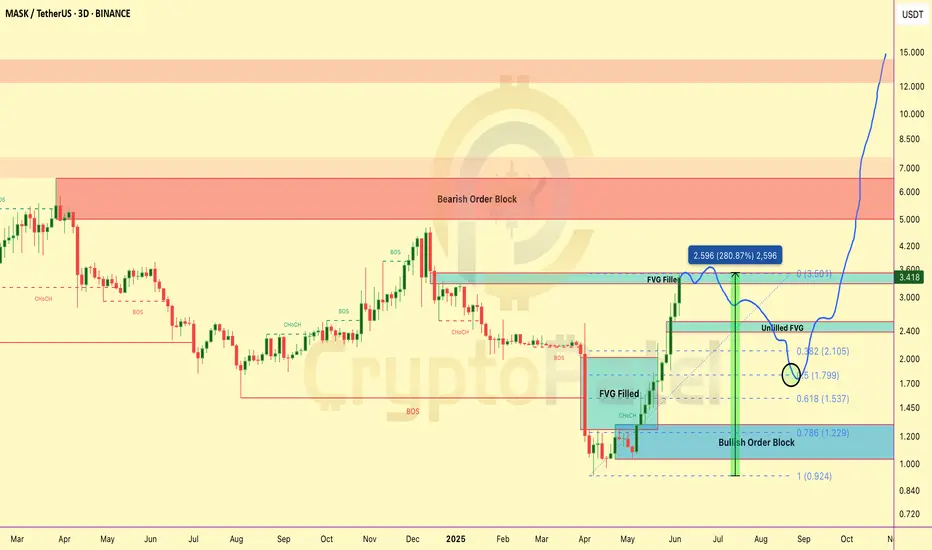
MASK 3.7x PUMP — Is a BIG DIP Coming?MASK 3.7x PUMP — Is a BIG DIP Coming?
MASK just delivered a MASSIVE rally from the Bullish Order Block at $1.2–$1.3 — and filled the FVG around $3.5.
Here’s what’s next 👇
🟢 Short-Term Outlook:
👉 After pumping from $0.927 → $3.50 → that’s a 3.7x move WITHOUT any major retracement.
👉 High chances of a healthy pullback next.
👉 Strong Accumulation Zone: If price drops towards 0.5 Fib retracement at $1.80 → This will be a key area for Smart Money to re-enter.
🟢 Mid-Term Potential:
👉 Once accumulation is done → breakout above $3.5 highly likely.
👉 First big target → Bearish Order Block at $5–$7.
🟢 Long-Term Vision:
👉 If BTC supports and MASK maintains bullish structure → can aim for $15/$30/$50 🚀
👉 Huge upside still left on higher timeframes.
Key Levels to Watch:
✅ $3.5 → Resistance
✅ $2.1–$1.5 → Retracement buy zone (Unfilled FVG + Fib confluence)
✅ $1.80 → 0.5 Fib — Strong Accumulation Zone
✅ $5–$7 → Major target zone
✅ $15/$30/$50 → Long-term moonshot
My Play → Waiting patiently for retracement → looking to accumulate in $2.1–$1.5 zone, ideally around $1.80 → position for next rally!
👉 What’s YOUR strategy on MASK? Buying the dip or waiting higher? Comment below 👇👇👇
NFA & DYOR
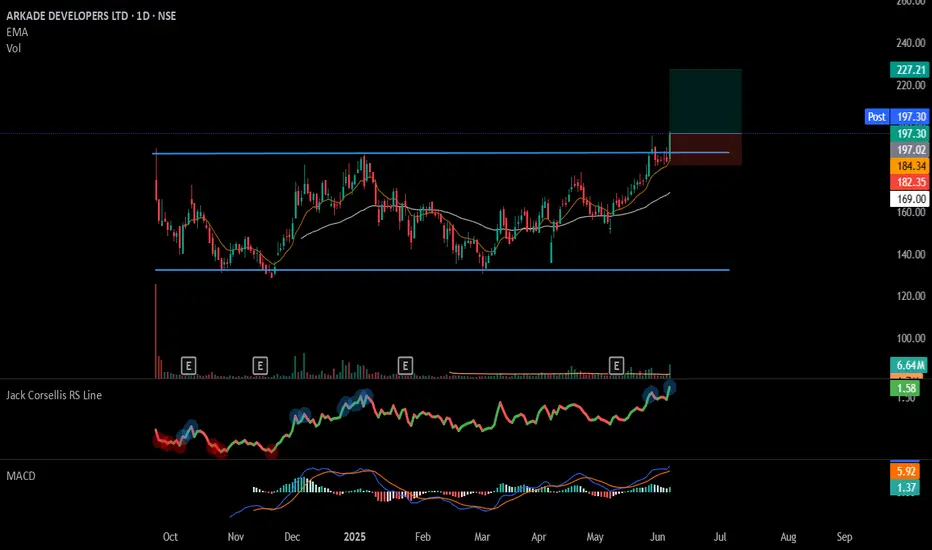
#ARKADE - IPO Base Breakout📊 Script: ARKADE
Key highlights: 💡⚡
📈 IPO Base Breakout in Daily Time Frame.
📈 Price consolidating near Resistance, then Breakout.
📈 Volume spike seen during Breakout.
📈 MACD Cross
📈 Can go for a swing trade
BUY ONLY ABOVE 197 DCB
⏱️ C.M.P 📑💰- 197.34
🟢 Target 🎯🏆 – 14%
⚠️ Stoploss ☠️🚫 – 7%
⚠️ Important: Market conditions are Okish, Position size 50% per Trade. Protect Capital Always
⚠️ Important: Always Exit the trade before any Event.
⚠️ Important: Always maintain your Risk:Reward Ratio as 1:2, with this RR, you only need a 33% win rate to Breakeven.
✅Like and follow to never miss a new idea!✅
Disclaimer: I am not SEBI Registered Advisor. My posts are purely for training and educational purposes.
Eat🍜 Sleep😴 TradingView📈 Repeat 🔁
Happy learning with MMT. Cheers!🥂
ICICIGIICICIGI has given triangle breakout with very decent volume. In recent time traction in insurance sector has been observed. At current level 2000-10 there is resistance. But if it crosses and closes above this resistance level then it may do wonder! On lower side 1860 is very strong support. And upper end momentum can be played up to 2210 level. But strong upside play is possible only above 2010 closing

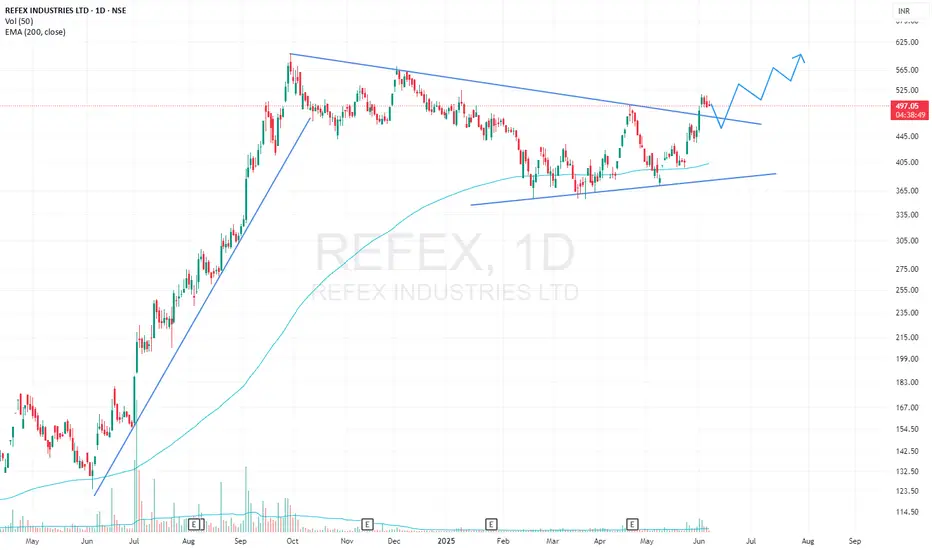
REFEX Triangle & Bull Flag BreakoutREFEX has given a breakout from Symmetrical Triangle and Bull Flag pattern on 1D timeframe with high volumes. Stock has also bounced several times from 200 EMA. Long Position can be initiated with proper risk management.
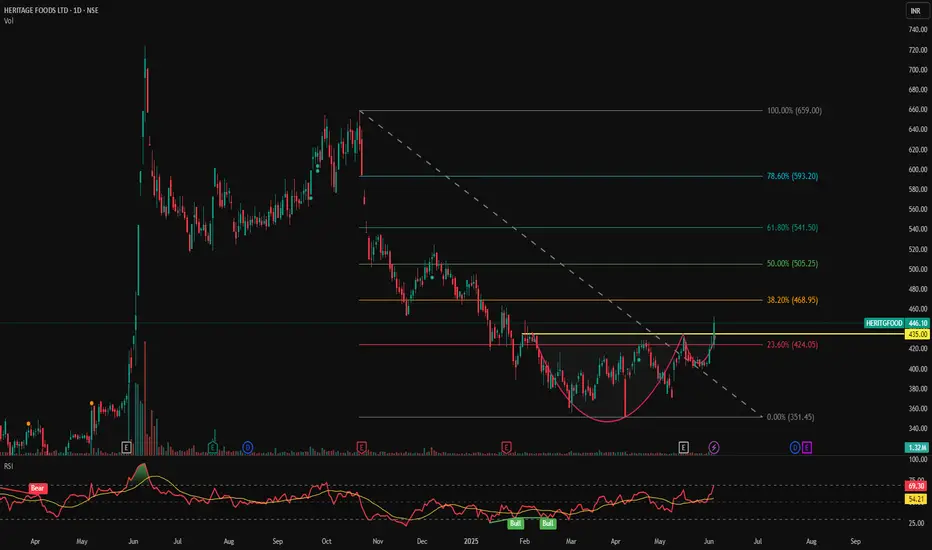
HERITGFOOD - Cup & Handle Breakout with RSI Confirmation | Daily📊 HERITAGE FOODS LTD (HERITGFOOD) – Cup & Handle Breakout with RSI Confirmation | Daily Chart
📅 Chart Date: June 5, 2025
📈 CMP: ₹446.10 (+5.94%)
📍 Ticker: NSE:HERITGFOOD
🔍 Technical Analysis Overview
☕ Cup & Handle Pattern Breakout
HERITGFOOD has successfully broken out of a Cup & Handle pattern, signaling the end of a long downtrend and a potential start of a new bullish wave. The breakout zone lies around ₹435–₹440.
💥 Breakout Volume: Supported by a strong surge in volume (~1.32M), adding conviction to the breakout.
📉 RSI Indicator:
RSI is at 69.30, just below overbought territory, indicating strong momentum.
RSI crossover above signal line confirms bullish strength.
📍 Key Price Levels
✅ Breakout Zone: ₹435–₹440
🚀 Upside Targets (based on pattern projection and past resistance):
₹470 – minor resistance
₹510 – medium-term swing target
₹550+ – extended target if momentum sustains
🛡️ Support Levels:
₹435 – breakout retest zone
₹415 – minor base
₹390 – handle bottom (critical invalidation)
🔻 Stop Loss Zone: Below ₹415–₹420 for risk-managed swing positions
🛠️ Trading Strategy
Entry: After confirmation candle above ₹440 or on pullback to retest breakout zone
Stop Loss: Below ₹415
Targets: ₹470 → ₹510 → ₹550+
Risk/Reward: Attractive R:R setup with confirmation indicators
⚠️ Disclaimer
This chart is for educational and analysis purposes only. Please consult a SEBI-registered financial advisor before taking any trading decision.
Trend Continuation in SANATHAN TEXTILES LTDNSE:SANATHAN
Timeframe - 4H CHART 📊
Base after Breakout 📈
An early entry above - @473 will make Good good RR.
Stock is maintaining clear HH HL structure.
And Recent Down candles are on very low Volume signals sellers getting absorbed.
Keep on radar. ⏳
Keep Learning, Happy Trading.

4 Stocks. 4 Stories. Here's How I See Them Without Predictions..Purely chart-based view. No bias. No advice. Just how I interpret these right now
I make educational content videos on Swing trading .

Inside Bars After High Volume – CERA Setting Up Near Key CT📌 Timeframe: Weekly (WTF)
📌 Type: Technical Observation / Swing Structure
📌 Concept: Counter Trendline Breakout Setup
CERA is currently navigating a highly constructive zone from a swing trading lens. Here's what's developing technically:
🔹 Higher Low Formation:
The stock has established a higher low structure, with the white internal trendline offering visible support across recent weeks. Interestingly, this aligns perfectly with the 200-period EMA on the weekly timeframe, enhancing its significance as a dynamic support layer.
🔹 Volume Clues:
Two of the highest volume candles on the weekly chart have now been followed by inside bars, a potential sign of absorption or base building. This tightening within volume zones signals institutional interest and a possible buildup phase.
🔹 Supply Zone Identified:
An overhead supply (marked in orange)
🔹 EMA Context: The blue 200 EMA further reinforces the idea of Supportive price behavior around this line validates its role.
🔍 This post is for educational discussion only. No recommendation or forecast is implied. Please conduct your own due diligence.

DYCL STRONG BREAKOUT CANDIDATENSE:DYCL
Cable and WIre Industry Stock Good for Swing
#DYCL Strong Conviction - Increasing day by day.
Study the Price and Volume action closely.
Spikes are grabbing supplies from top and low volatility closing showing - accumulation.
Today price respected the previous day close and formed a higher high higher low structure.
All Major Levels are marked on chart.
Keep Learning,
Happy Trading.

$ME/USDT Technical Breakdown – What’s Happening?$ME/USDT Technical Breakdown – What’s Happening?
1️⃣ Market Shift:
We finally got a CHoCH (Change of Character) — the downtrend is likely over!
2️⃣ Support Bounce:
Price respected the strong support zone at $0.76–$0.83 and bounced hard 💪
3️⃣ Trendline Breakout:
A major descending trendline has been broken — signaling bullish momentum 🚀
4️⃣ Next Steps:
There’s an unfilled Fair Value Gap (FVG) below at $0.86–$0.95 — price might dip there to grab liquidity before flying again.
Possible Upside Targets: $1.40 → $1.70 → $2+
Don’t chase. Wait for the pullback = best entry!

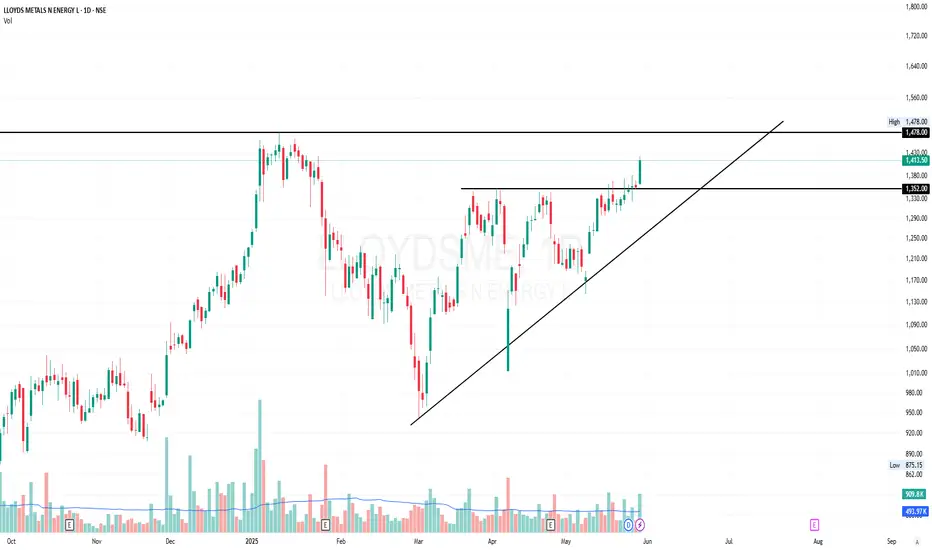
LLOYDSME - VCP BreakoutLLOYDSME
1) Time Frame - Daily.
2) A Volatility Contraction Pattern Breakout after a good consolidation.
3) The stock may find it's next resistance at the price 1478 (All Time High) & Move further if the momentum kicks in.
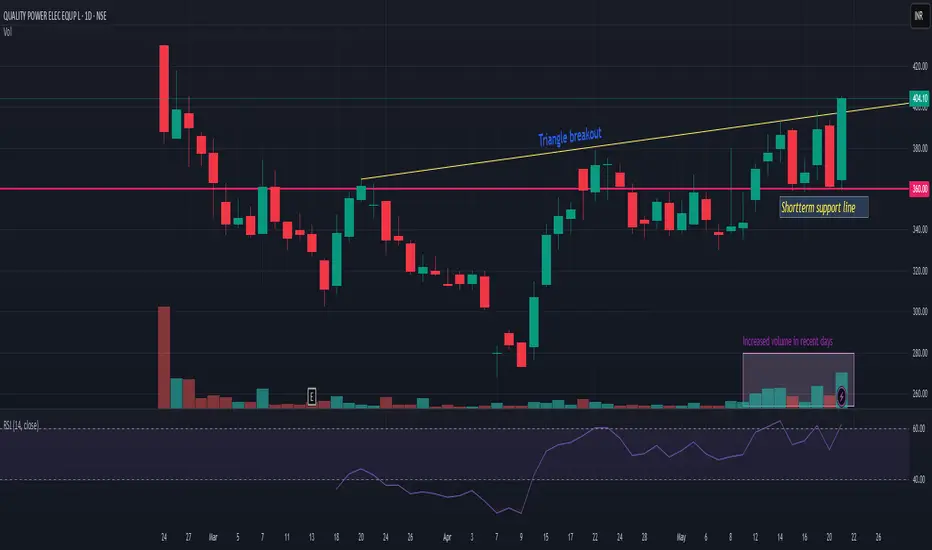
QPOWERQPOWER is recently listed IPO stock and now it has given triangle breakout with decent volume. 355-60 is very strong support. Closing below this may change my view. Upper side we may see momentum till 470-510. Risk reward is quite favorable. Another thing which i observed is today it is trading at all time high volume after listing day. So probability of holding and continuing momentum is quite high. keep it on radar.
YESBANK: Riding the Bullish WaveYes Bank has exhibited a notable breakout above the resistance level established in December 2024. This breakout is accompanied by a classic flag pattern formation, which has resolved to the upside—typically interpreted by technical analysts as a continuation signal within an existing trend.
A significant increase in trading volume during the breakout phase adds weight to the move, suggesting heightened market participation. Furthermore, the 20-day EMA has crossed above the 200-day EMA, a crossover often referred to as a "Golden Cross" , which is generally viewed as a bullish signal indicating potential for continued upward momentum.
The RSI is currently positioned above 60, reflecting sustained buying interest without yet entering overbought territory.
From a structural perspective:
Immediate resistance may be encountered near the 24.75 level.
A secondary resistance zone appears around 28.54.
On the downside, the stock seems to have established a support base near 19.54, which could act as a cushion in the event of a pullback.
Disclaimer:
This analysis is intended solely for informational and educational purposes. It does not constitute investment advice, a recommendation, or an offer to buy or sell any securities. Market conditions can change rapidly, and all trading involves risk. Individuals should conduct their own due diligence or consult with a qualified financial advisor before making any investment decisions.

CAMS - Cup and Handle Braekout CAMS has created a nice Cup and Handle Pattern on a Daily Chart.
It has give a strong breakout from the Pattern @4100 levels
Pattern Target Range is 1000+ Points (Approx 25% Return)
Target : 5200++
SL 3830
TImeframe : Short Term (6 months approx)
During the breakout today has seen huge volumes which is positive for the stock

DLF for 46% upsideif Weekly candle close above 826Rs level then only take entry
Target 1220
Duration 1.5 year( its maximum duration )
After entry at 759 Rs level invest same amount again.
No need any stop loss.
it will be ready to fly ..just wait for weekly closing above 826

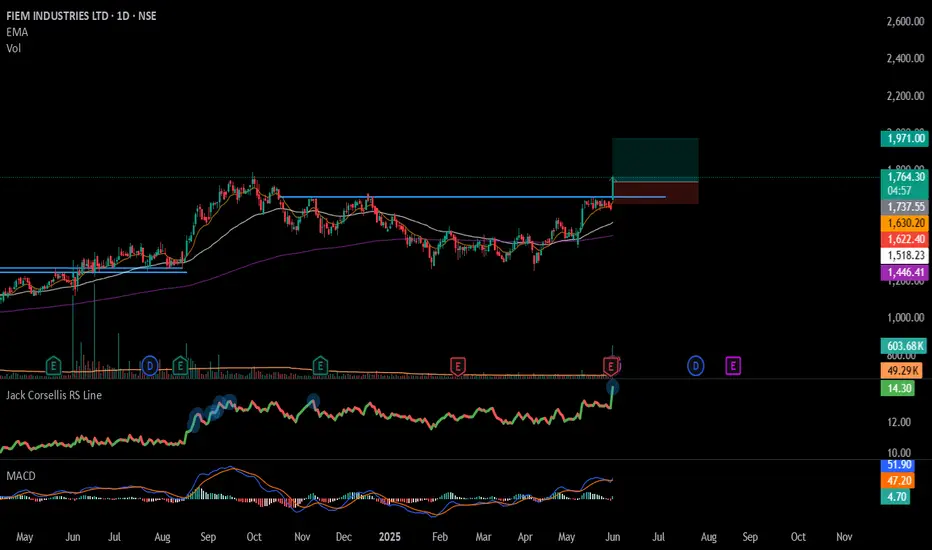
#FIEMIND - Cup & Handel BreakOut in Daily Time Frame📊 Script: FIEMIND
Key highlights: 💡⚡
📈 Cup & Handel BreakOut in Daily Time Frame.
📈 Price consolidating near Resistance.
📈 Volume spike during Breakout
📈 MACD Cross
📈 RS Line Making 52WH
📈 Can go for a swing trade
BUY ONLY ABOVE 1735 DCB
⏱️ C.M.P 📑💰- 1734
🟢 Target 🎯🏆 – 14%
⚠️ Stoploss ☠️🚫 – 7%
⚠️ Important: Market conditions are Okish, Position size 50% per Trade. Protect Capital Always
⚠️ Important: Always Exit the trade before any Event.
⚠️ Important: Always maintain your Risk:Reward Ratio as 1:2, with this RR, you only need a 33% win rate to Breakeven.
✅Like and follow to never miss a new idea!✅
Disclaimer: I am not SEBI Registered Advisor. My posts are purely for training and educational purposes.
Eat🍜 Sleep😴 TradingView📈 Repeat 🔁
Happy learning with MMT. Cheers!🥂