TTML: Unlocking Potential with Elliott WavesHello friends, Welcome to RK Chaarts.!
Let’s analyse the chart of Tata Teleservices Maharashtra Limited from an Elliott wave perspective.
We can see that in March 2023, the stock formed a bottom around 49.65 and then moved upwards in an impulse wave. We can identify wave one as complete, ending around the July 2024 high.
After that, there was a sudden fall to the April 2025 low, which we assume to be the end of wave two. We expected it to reverse around the previous low, because wave II cannot retrace more than 100% of wave I (Elliott wave principles), and Same happened, it had reversed from that low to upside.
Looking at the weekly chart, we can see that post wave II, price has broken the 0-B trend line with strong volume intensity. If our wave counts are correct, we can measure wave I and project wave III’s target using Trend based Fib extensions as per Elliott wave theory.
According to the theory, wave III target could be around 150.70, which is 1.618 times the length of wave I.
Projected Targets as per Elliott waves:
So, friends, from an Elliott wave perspective, Tata Teleservices has strong potential to move upwards to around 150 rupees, with potential targets at 88, 112, 127, and 150 rupees.
Invalidation levels:
Please note that this analysis is for educational purposes only and involves multiple possibilities. The scenario presented focuses on one potential outcome, assuming the invalidation level of 49.65 is not triggered. If it is triggered, the chart would need to be reassessed, and wave counts would need to be reevaluated.
This is not a tip or advisory, but rather a educational analysis.
I am not Sebi registered analyst.
My studies are for educational purpose only.
Please Consult your financial advisor before trading or investing.
I am not responsible for any kinds of your profits and your losses.
Most investors treat trading as a hobby because they have a full-time job doing something else.
However, If you treat trading like a business, it will pay you like a business.
If you treat like a hobby, hobbies don't pay, they cost you...!
Hope this post is helpful to community
Thanks
RK💕
Disclaimer and Risk Warning.
The analysis and discussion provided on in.tradingview.com/u/RK_Charts/ is intended for educational purposes only and should not be relied upon for trading decisions. RK_Chaarts is not an investment adviser and the information provided here should not be taken as professional investment advice. Before buying or selling any investments, securities, or precious metals, it is recommended that you conduct your own due diligence. RK_Chaarts does not share in your profits and will not take responsibility for any losses you may incur. So Please Consult your financial advisor before trading or investing.
Breakout!

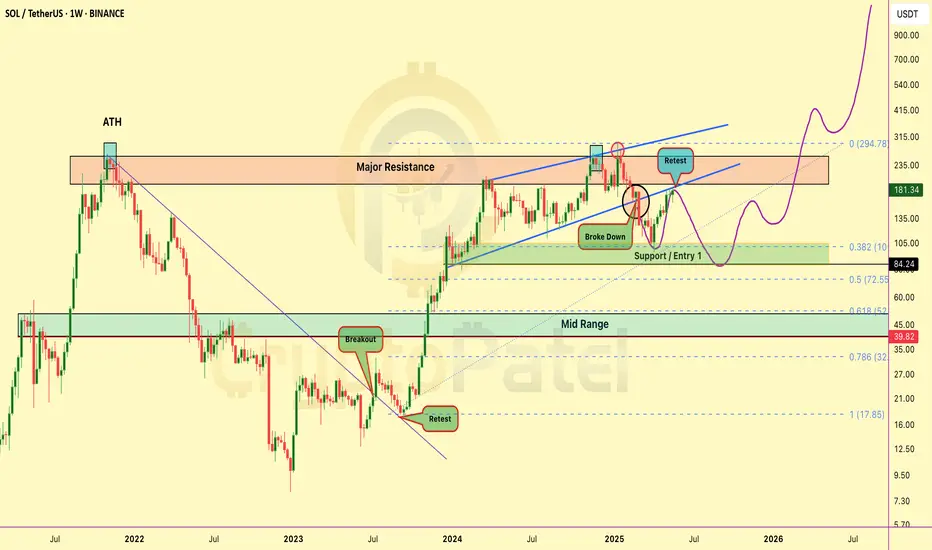
Bearish Setup Loading on Solana? Bearish Setup Loading on Solana? Watch This Key Level Closely
Solana just retested the breakdown zone after losing key support — currently sitting in a danger zone.
Short Interest Zone: $180 – $190
If this area holds as resistance, we could see another move below $150 soon.
Bearish Setup Invalidation: Break above $200 will flip this bias.
Long-Term View? I’m still super bullish on SOLANA in the bigger picture — my long-term target remains $1000 🚀
Risk Management is Key
Never trade without a STOP LOSS — protect your capital.
This is NOT financial advice — DYOR before investing.
Let the chart guide you, not emotions. Stay sharp.
ETHEREUM MEGA CYCLE ALERT🚨 ETHEREUM MEGA CYCLE ALERT 🚨
CRYPTOCAP:ETH just bounced from the same support zone that sparked its last bull run 🔥
This could be the start of Wave 5 — and if history repeats…
🎯 Target: $10,000 ETH
Last time this pattern showed up? ETH went 10x.
Don’t fade the chart.
👉 Like & Retweet if you’re riding this wave
👇 Tag a friend who’s still sleeping on ETH!

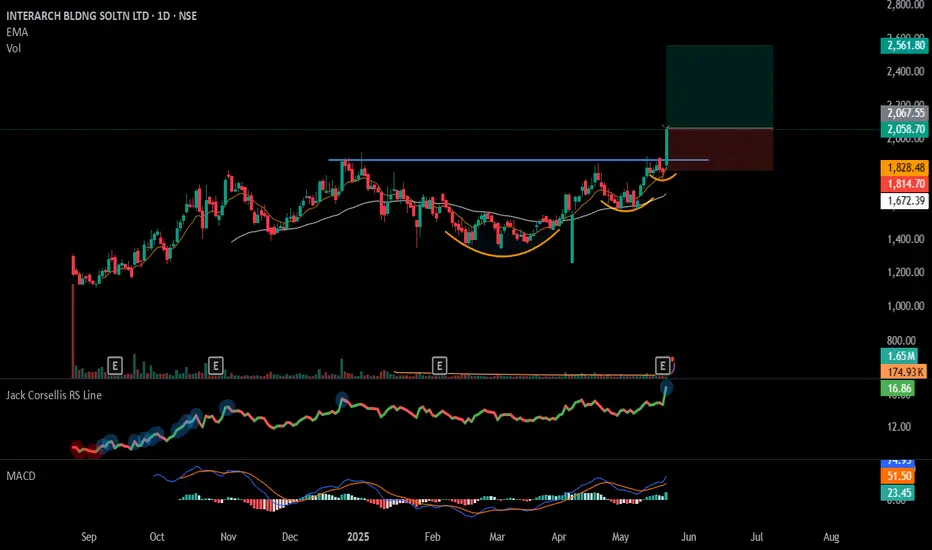
#INTERARCH - VCP BreakOut in Daily Time Frame📊 Script: INTERARCH
Key highlights: 💡⚡
📈 VCP BreakOut in Daily Time Frame.
📈 Price consolidated near Resistance.
📈 Volume spike seen
📈 MACD Crossover
📈 Can go for a swing trade
BUY ONLY ABOVE 2075 DCB
⏱️ C.M.P 📑💰- 2058
🟢 Target 🎯🏆 – 24%
⚠️ Stoploss ☠️🚫 – 12%
️⚠️ Important: Market conditions are Okish, Position size 50% per Trade. Protect Capital Always
⚠️ Important: Always Exit the trade before any Event.
⚠️ Important: Always maintain your Risk:Reward Ratio as 1:2, with this RR, you only need a 33% win rate to Breakeven.
✅Like and follow to never miss a new idea!✅
Disclaimer: I am not SEBI Registered Advisor. My posts are purely for training and educational purposes.
Eat🍜 Sleep😴 TradingView📈 Repeat 🔁
Happy learning with MMT. Cheers!🥂
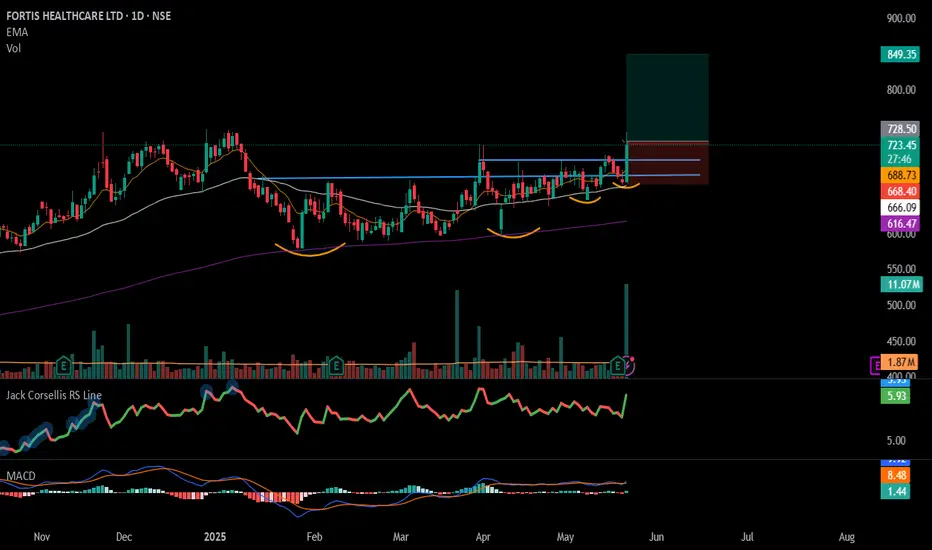
#FORTIS - VCP BreakOut in Daily Time Frame📊 Script: FORTIS
Key highlights: 💡⚡
📈 VCP BreakOut in Daily Time Frame.
📈 Price consolidated near Resistance.
📈 Volume spike seen
📈 MACD Crossover
📈 Can go for a swing trade
BUY ONLY ABOVE 728 DCB
⏱️ C.M.P 📑💰- 722
🟢 Target 🎯🏆 – 16%
⚠️ Stoploss ☠️🚫 – 8%
️⚠️ Important: Market conditions are Okish, Position size 50% per Trade. Protect Capital Always
⚠️ Important: Always Exit the trade before any Event.
⚠️ Important: Always maintain your Risk:Reward Ratio as 1:2, with this RR, you only need a 33% win rate to Breakeven.
✅Like and follow to never miss a new idea!✅
Disclaimer: I am not SEBI Registered Advisor. My posts are purely for training and educational purposes.
Eat🍜 Sleep😴 TradingView📈 Repeat 🔁
Happy learning with MMT. Cheers!🥂
Miss This Retest and You’ll Miss the Rally – CUPID Setup Explain🔴 A – Supply-Demand Conversion Zone
This is the heart of the setup. When price trades below this zone, we stay cautious or short on weak structures. But if it sustains above this, it becomes the launchpad for longs—provided all system conditions align
🟠 B – Ideal Retest Zone
We anticipate a retracement here. A healthy correction towards A zone to tap into fresh demand. This retest is essential to build a valid higher low before breaking out.
🟣 C – All-Time High (ATH) Supply Zone
The ultimate target and strong resistance zone. If our breakout from E happens cleanly, this becomes the next significant level to watch—potential partial booking zone.
🟡 D – Hidden Resistance (WTF)
Subtle yet powerful. This line isn’t obvious to many but holds weight in our top-down analysis. If price cleanly breaks this, it adds conviction to the momentum.
⚪ E – Weekly CT Line
The main trigger. We want price to pull back (B), form a strong base (A), and then break E with a power candle, backed by strong volume
📊 Current Status:
✅ Price above A (bullish tilt activated)
❌ No proper retest at B yet
🔜 Awaiting clean breakout of E post-retest
📌 Hidden resistance D and supply C remain above as Resistances / Hurdles after our Breakout

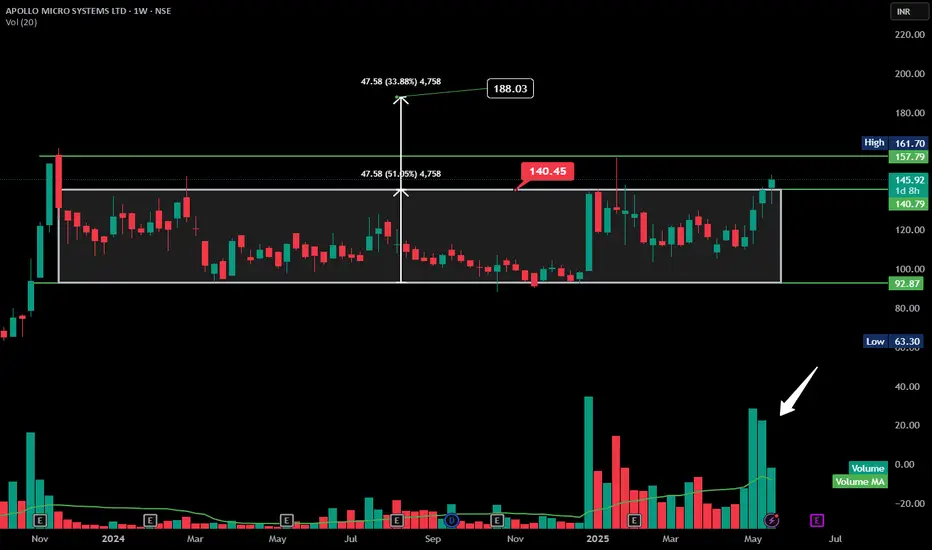
APOLLO rectangular consolidation Breakout - Good volumeHere’s a **technical analysis summary for APOLLO MICRO SYSTEMS LTD** based on the chart you provided:
---
### 📊 **APOLLO MICRO SYSTEMS LTD – Weekly Chart Summary**
* **Trend:** ✅ **Breakout Confirmed**
* Price has broken out above the rectangular consolidation zone after nearly a year of sideways movement.
* **Breakout Zone:**
* Resistance broken: **₹140.45**
* Consolidation range: ₹92.87 to ₹140.45
* **Target Projection (based on rectangle height):**
* Rectangle height = ₹47.58
* Projected Target = ₹140.45 + ₹47.58 = **₹188.03**
* **Current Price:** ₹145.92 (as of last weekly candle)
* **Volume Analysis:** 🔼
* Recent volume spikes confirm breakout strength.
* Volume > average, indicating institutional interest.
* **Support Levels:** * Lower: ₹92.87 (bottom of range)
---
### 📌 **Technical View:**
**Bullish outlook.** The breakout from a long accumulation phase with strong volume is a classic bullish signal. Price may face resistance around ₹157.79 and ₹161.70, but overall sentiment favors upside towards ₹188.
---
$AKT Could Be the Next 10x AI Coin – Here’s Why I’m Bullish Now!CSEMA:AKT Could Be the Next 10x AI Coin – Here’s Why I’m Bullish Now!
Looking to buy CSEMA:AKT in the $1.50–$1.20 zone — strong support + FVG. If price dips, I’ll accumulate.
➡️ Support: $1.50–$1.20
➡️ Resistance: $2 — breakout could send it flying
➡️ Targets: $5 / $10 / $15
➡️ Invalidation: Below $0.80 = bearish shift
Why I’m Bullish:
Decentralized cloud disrupting big tech. Surging demand from AI workloads. Now supports NVIDIA GPUs, and gaining strong traction in AI & Cosmos communities.
A breakout above $2 could lead to massive upside and High Chances to Hit $10+
— DYOR | NFA

Gabriel India -Double Bottom Breakout!📊 Gabriel India - Positional Breakout Trade
🔍 Technical Overview:
✅ Trend: Strong uptrend, followed by a 32% correction and a double bottom formation .
✅ Breakout Confirmation: Cleared ₹565 resistance with strong volume.
✅ Key Levels:
Entry: Above ₹600 (Earlier breakout was at ₹565)
Stop Loss: ₹475 (Closing basis) 🔻
Positional Target: ₹824 (Tentative) 🎯
✅ Moving Averages: Trading above key DMAs, indicating strength.
✅ Market Condition: Stock is breaking out early as markets show signs of recovery.
⚠ Risk Management & Position Sizing:
Risk per trade: More than 20%, so position sizing is 🔑.
Recommended Approach:
Enter 25% now and accumulate on retest.
Do NOT go all-in – respect SL at all costs! 🚨
Current market structure: Still in LL-LH (Lower Low - Lower High). This could be a counter-trend pullback or a bull trap—stay cautious.
📈 Fundamental Overview:
Market Cap: ₹8,463 Cr
Current Price: ₹589
52W High/Low: ₹598 / ₹326
P/E Ratio: 40.2
Book Value: ₹74.9
Dividend Yield: 0.68%
ROCE: 26.7%
ROE: 19.6%
Debt-Free Company 💰
Sales, EPS, and Profits improving YoY 📈
🛑 Final Thoughts:
Market concerns still exist—we don’t know if this is the bottom or a reversal yet.
Control FOMO! Watch for market confirmation before adding aggressively.
If you struggle with risk management, sit on the sidelines—waiting is also a trade.
⚠ Disclaimer:
This is NOT financial advice. Trade at your own risk and follow your own risk management rules. 📉📈

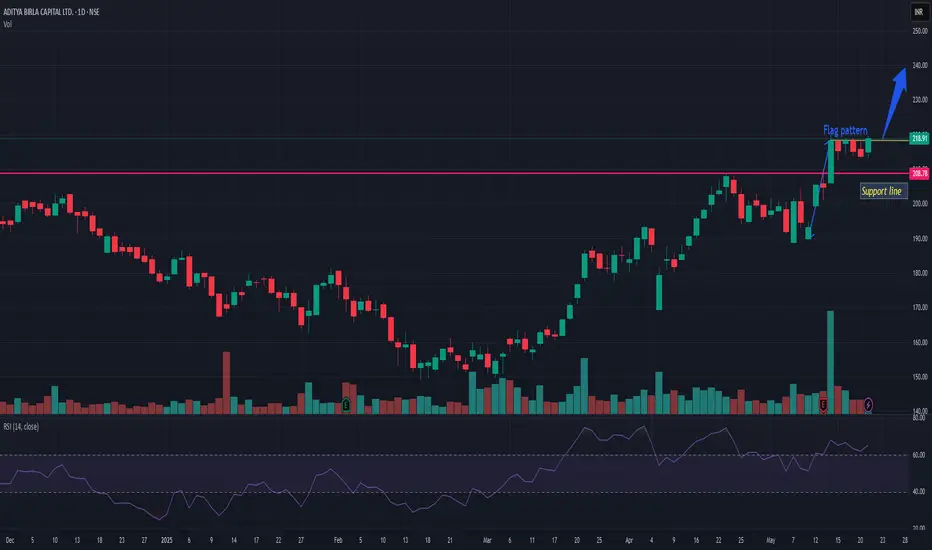
ABCAPITALABCAPITAL is getting stronger and giving short term flag pattern breakout. Only thing which is lacking is enough market participation. If it gets market participation than average then it can do wonders in short term. I would keep a closer look if it sustain above 220.
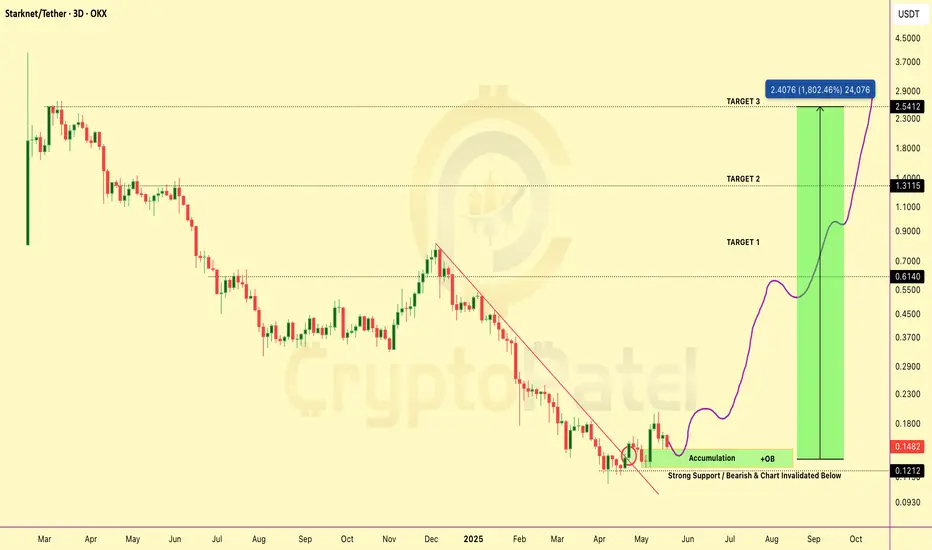
$STRK Technical Setup – 10x–20x Potential Loading🚨 NASDAQ:STRK Technical Setup – 10x–20x Potential on the Table
#Starknet has broken structure and is now retesting the bullish order block zone — classic PA move before the next leg up.
📌 Accumulation Zone: $0.15–$0.13 (Bullish OB)
🔄 Retest in progress – holding above OB confirms strength
🎯 Targets: $0.60 / $1.30 / $2.50
❌ Invalidation: Clean break below $0.12
Structure remains bullish — expecting continuation if OB holds.
High R:R setup. Eyes on it!
Note: This is Not Financial Advice so DYOR before investing in Any Cryptocurrencies.
AKUMSAKUMS seems stronger and given triangle breakout. Volume is also very decent as its just 1st hour of trading and almost nr previous day volume. We may see momentum rally nearing 12-15% from here as long as its closing above this trendline it may continue to outperform. Risk reward is quite good. Result is on 26th may. Keep it on radar

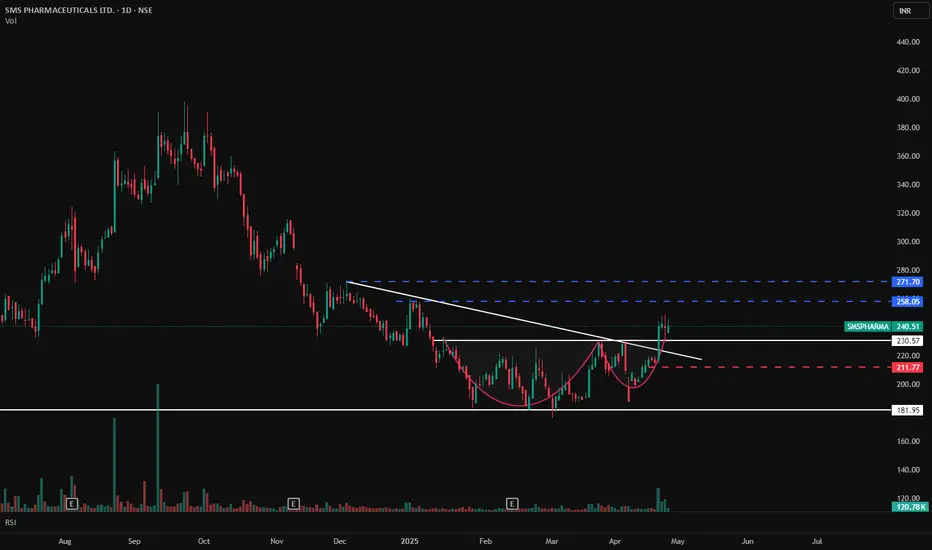
SMS PHARMA - Cup & Handle Breakout with Volume Confirmation📊 SMS PHARMA – Cup & Handle Breakout with Volume Confirmation
🕰️ Timeframe: 1D | 📐 Pattern: Cup & Handle Formation
🔍 Technical Setup:
SMS Pharma has formed a classic Cup & Handle pattern, which is a bullish continuation pattern. The breakout has occurred above the neckline resistance with a clean breakout candle, confirming bullish momentum.
The falling trendline resistance has also been decisively broken, adding further confidence to the breakout strength.
🔑 Key Levels to Watch:
🔵 Resistance (Upside Targets):
₹258.05
₹271.70
🔴 Support Zones:
₹230.57 (neckline support)
₹211.77 (handle base)
₹181.95 (major horizontal support zone)
📊 Volume & Indicators:
🔺 Volume Surge at breakout confirms strength and participation — a good sign for trend continuation.
📈 RSI: 64.58 — close to overbought zone, but still indicating strength. Minor consolidation near ₹240 would be healthy before further up move.
🧠 Bias: Bullish
📉 Any pullback to ₹230–₹235 can offer a good entry opportunity with risk managed below ₹211.
⚠️ Disclaimer: This is an educational analysis and not investment advice. Do your own research before making any trading decisions.
📈 Follow @PriceAction_Pulse for more breakout setups and swing trading ideas!
💬 Drop your thoughts in the comments — will this Cup & Handle breakout hit the ₹270 zone?
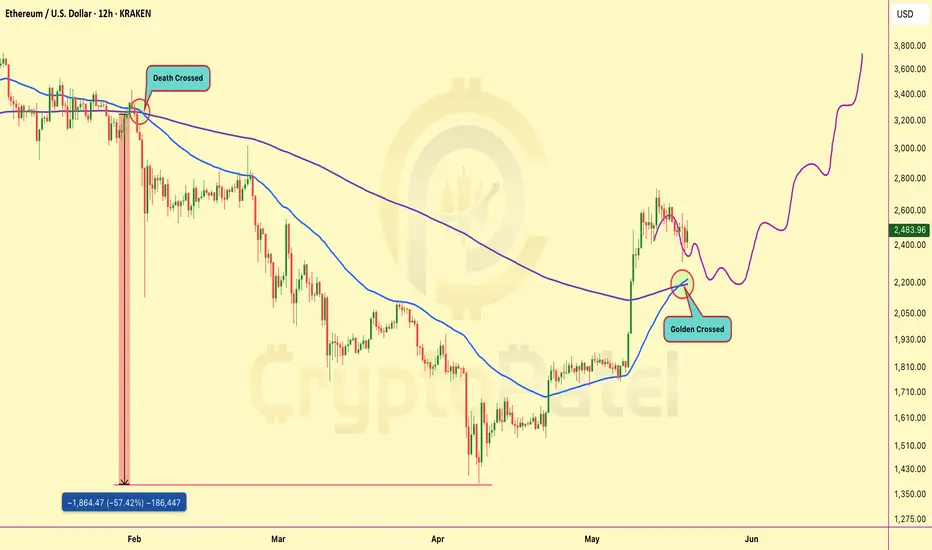
Ethereum Golden Crossed so What Next? $5000?🚨 CHART ALERT: CRYPTOCAP:ETH just flashed a GOLDEN CROSS on the 12H after months of bleeding!
Last time we saw a DEATH CROSS, #Ethereum crashed -57%.
Now it's doing the opposite — this could be the start of a massive pump! 🚀
TARGET? Maybe $3,800-$5000+ soon! 📈
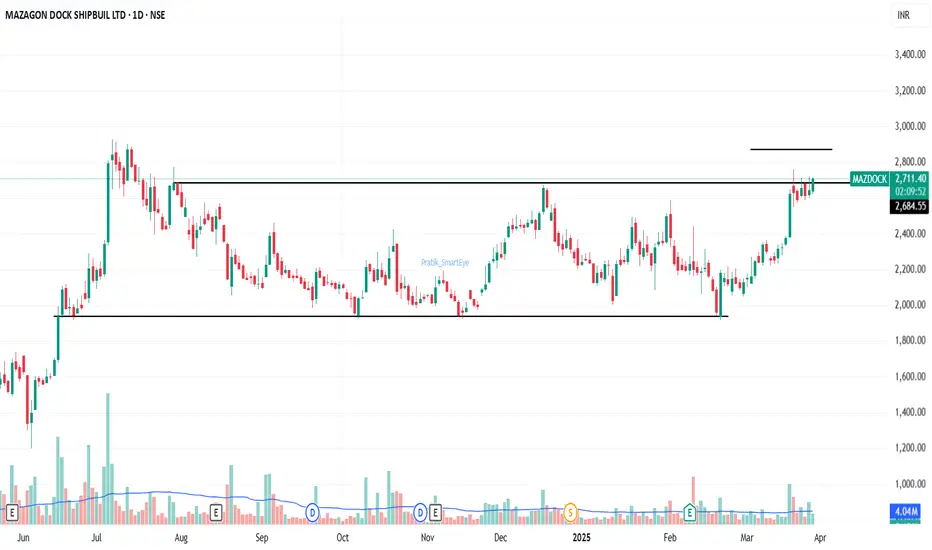
Mazagaon Dock - Consolidation BreakoutMazagon Dock Shipbuilders Ltd. CMP 2700. Attempting a consolidation range breakout. Resistance at all time high levels.
Syrma SGS Tech. at Buy Breakout#Syrma SGS Technology Ltd. Breakout above 570 sustained closing basis. CMP 574.
Resistance 595/685. Expected Level 765. Mid-Long Term.
View negated below 519.
#TMPV #EMS #BreakoutStock #StockInvesting #SmartEye

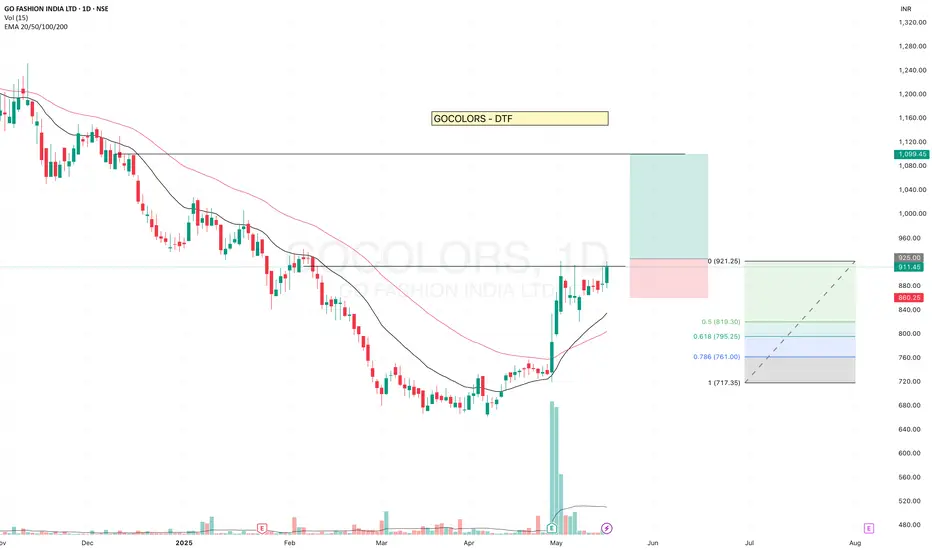
GOCOLORS - Getting ReadyGOCOLORS is getting ready and has been testing the resistance level.
- It is consistently trading above the 20 EMA. Recent high-volume candles suggest clear institutional participation. Although volume is currently drying up, the price is sustaining — a positive sign.
- The stock reversed after touching the 0.5 Fibonacci retracement level, indicating strength.
✅ If you like my analysis, please follow me as a token of appreciation :)
in.tradingview.com/u/SatpalS/
📌 For learning and educational purposes only, not a recommendation. Please consult your financial advisor before investing.
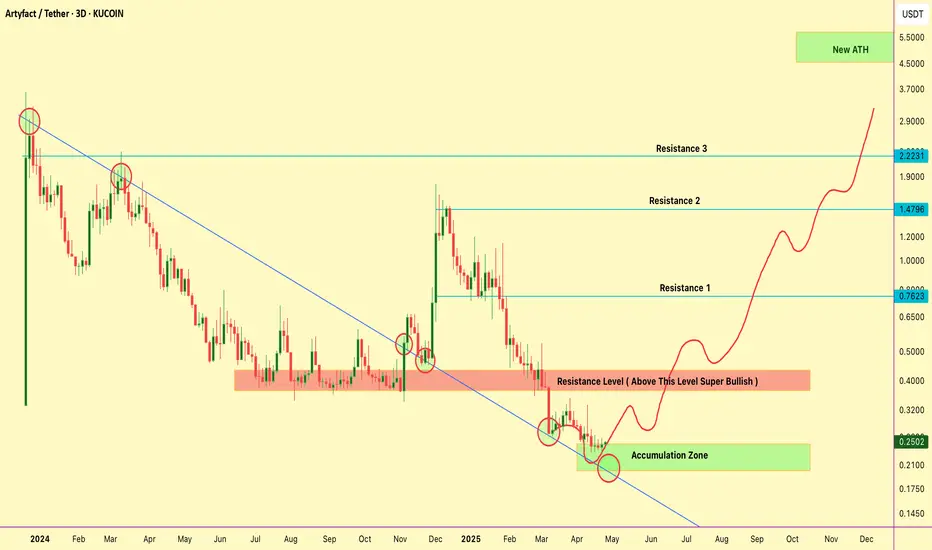
Heavy Accumulation Complete: $ARTY Is Ready to Explode-Don’t MovAMEX:ARTY Chart Looks Perfect – Breakout Coming Soon?
After months of heavy accumulation and technical compression, AMEX:ARTY has officially bottomed out and is now looking extremely undervalued. I’ve personally Bullish at these levels — and here’s why I believe AMEX:ARTY is a massive opportunity before the storm.
Why I Am Bullish on AMEX:ARTY :
✅ Price Action Reversal: The downtrend is broken. AMEX:ARTY has reclaimed key structure and is now sitting firmly in an accumulation zone.
✅ Super Low Market Cap: With a micro-cap valuation and over 80% of tokens already in circulation, this is not just scarce — it’s primed for a supply shock.
✅ Growing Holder Base: On-chain metrics show a steadily increasing number of AMEX:ARTY holders, a strong signal of organic adoption.
✅ Major Catalysts Ahead: Artyfact isn’t just another token — it’s building a next-gen GameFi ecosystem with upcoming launches on PlayStation, Xbox, AppStore, and Google Play. This will potentially attract millions of users globally.
Technical Setup
▶️ Accumulation Zone: $0.20–$0.25 (current entry range)
▶️ Breakout Level (Super Bullish above): $0.37
▶️ Resistance Targets: $0.76/$1.47/$2.22 ( Resistance = Targets)
▶️ Bullrun Target: $5+ — once it clears major resistance, the chart shows high probability for a parabolic run toward new ATHs.
Vascon Engineers – Weekly CT BreakoutA clean Weekly CT breakout supported by strong volume (19M+), signaling strength. Key levels and structure:
🔍 Technical Breakdown:
📏 CT Line (White): Clean breakout from weekly closing-based counter-trendline
🕵️ Hidden Line (Dotted White): Secondary hidden resistance cleared
🟧 ₹45.49 Zone: Major gap-up area on DTF – key retracement demand zone
🔵 200 DEMA (Blue Line): Historical resistance now flipped – strength confirmed
🟥 Supply Zone (₹78–₹83): Overhead resistance – long-term target zone
📈 Volume: 🔥 Spiked to 19M+ – highest since Jan ‘24 – confirms breakout strength

ASTRAMICRO in Bullish modeHey Family, here’s another stock showing a strong technical setup! 🚀
📈 Stock: Astra Microwave Ltd (NSE: ASTRA)
🔍 Key Observations:
📊 Chart Pattern:
The chart shows a Horizontal Breakout from a long-term consolidation zone. This is a bullish continuation setup, signaling potential for further upside as the stock breaks above key resistance levels.
📈 Recent Price Action:
• The stock broke out last week, showing strong bullish momentum.
• This week’s price action indicates a healthy consolidation above the breakout level, suggesting buyer strength and continued interest.
• Volume activity supports the move, adding conviction to the breakout.
💡 Trading Recommendation:
Aggressive Entry:
• Enter based on current price structure to ride the breakout early.
• Use a stop-loss according to your risk tolerance and trading capacity.
Conservative Entry:
• Wait for a decisive move above the highlighted supply zone for confirmation.
• This approach helps minimize risk and confirms sustained strength.
🧠 Rationale:
The breakout from horizontal resistance, backed by solid price and volume structure, suggests a high-probability bullish continuation. Choose an entry style that aligns with your trading plan and risk profile.
🚨 Disclaimer: This is not financial advice. All views are shared for educational purposes only. Always do your own research and manage risk responsibly before making any trading decisions.
What is your view please comment it down and also boost the idea this help to motivate us.

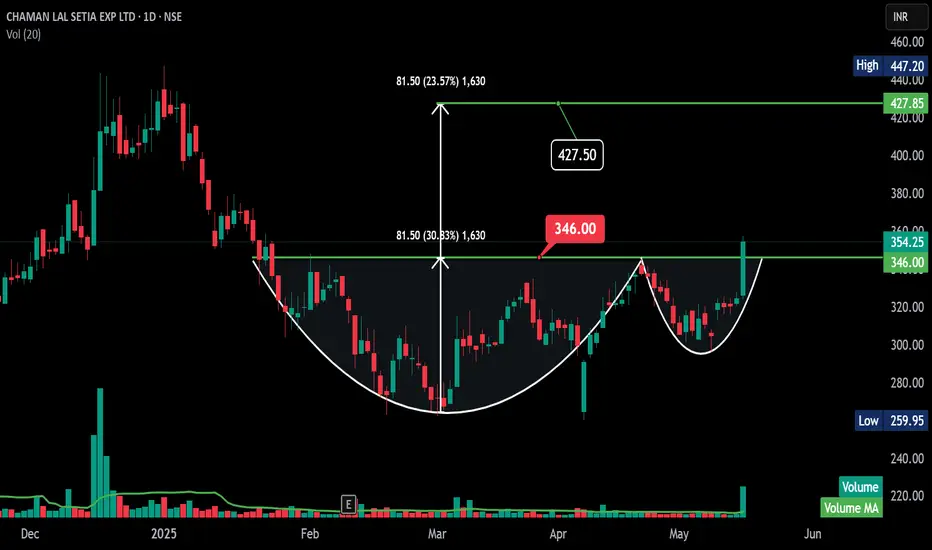
CLSEL -Daily - Cup and Handle -Breakout -Good Volume CHAMAN LAL SETIA EXP LTD daily chart definitely presents a compelling case for a **cup and handle breakout**.
Here's what aligns with your observation:
* **Clear Cup and Handle:** The chart shows a well-formed rounded bottom (the cup) followed by a smaller, slightly downward-sloping consolidation (the handle).
* **Neckline Breakout:** Today's price action (May 17, 2025) shows a strong bullish candle that has decisively broken above the neckline you've identified at ₹346.00.
* **Good Volume:** Importantly, the volume bar for today is significantly higher than the recent average volume, indicating strong buying pressure accompanying the breakout. This adds significant credence to the validity of the breakout.
* **Target:** Your target of ₹427.50 aligns well with the typical measurement for a cup and handle pattern. The depth of the cup (roughly from the low around ₹265 to the neckline at ₹346, which is ₹81) added to the breakout level (₹346) gives a target of ₹427.
**In summary, this looks like a textbook cup and handle breakout for CHAMAN LAL SETIA EXP LTD, supported by good volume, increasing the likelihood of the price reaching your target of ₹427.50.**
It's always wise to consider potential resistance levels along the way and to have a stop-loss in place, but the initial signs here are quite bullish.
BSE Ltd - Breakout Setup, Move is ON...#BSE trading above Resistance of 4169
Next Resistance is at 6645
Support is at 2586
Here is previous chart:
Chart is self explanatory. Levels of breakout, possible up-moves (where stock may find resistances) and support (close below which, setup will be invalidated) are clearly defined.
Disclaimer: This is for demonstration and educational purpose only. This is not buying or selling recommendations. I am not SEBI registered. Please consult your financial advisor before taking any trade.

Mazagon Dock Shipbuilders - Breakout Setup, Move is ON...#MAZDOCK trading above Resistance of 4315
Next Resistance is at 6033
Support is at 2955
Here are previous charts:
Chart is self explanatory. Levels of breakout, possible up-moves (where stock may find resistances) and support (close below which, setup will be invalidated) are clearly defined.
Disclaimer: This is for demonstration and educational purpose only. This is not buying or selling recommendations. I am not SEBI registered. Please consult your financial advisor before taking any trade.
