Consolidation happening in BBTC (Bombay burmah trading)1. is having consolidation pattern between 1750 - 2100 levels
2. One can watch for breakout above 2100 with good Risk : Reward
3. stock has give strong results attracting buyers and accumulation seen at 1850 levels
with strong buyer coming taking stock to 2050 levels in single day
4. stock may test its all time high if breaches 2400 levels
Breakout!

Titan Breakout Watch: Spotting the Ideal EntryTitan has confirmed a clean breakout on the weekly timeframe. Watching to see whether momentum continues or if a pullback offers a better risk-reward entry.

BUY TODAY SELL TOMORROW for 5%DON’T HAVE TIME TO MANAGE YOUR TRADES?
- Take BTST trades at 3:25 pm every day
- Try to exit by taking 4-7% profit of each trade
- SL can also be maintained as closing below the low of the breakout candle
Now, why do I prefer BTST over swing trades? The primary reason is that I have observed that 90% of the stocks give most of the movement in just 1-2 days and the rest of the time they either consolidate or fall
Resistance Breakout in SEQUENT
BUY TODAY SELL TOMORROW for 5%

Technical Analysis of BTCUSD – Is a Correction Approaching?BINANCE:BTCUSD is currently moving within a clearly defined falling wedge pattern, with price now pressing against the lower boundary of the structure. This level may act as dynamic support, and if price shows a strong rejection, a corrective move toward the resistance zone near 102,000 could occur.
If sellers manage to defend that resistance area, the bearish structure remains intact, giving BTCUSD the potential to continue dropping to lower levels. But if price breaks above that zone, there is room for a higher correction toward the upper boundary of the wedge.
At this stage, paying close attention to candlestick patterns and volume behavior around this key area is crucial for identifying the best selling opportunities. Make sure every trade setup is supported by clear confirmation, and always apply solid risk management.
If you have any additional insights or a different perspective on this setup, I’d love to hear it. Feel free to share your thoughts in the comments!

XAUUSD Double Bull Flag — Danger AheadHello my dear traders, Laura here.
This week, the market has been extremely tense, and the price action reflects it well.
As I mentioned before, we are currently seeing the formation of a large bull flag. Just above it, a smaller flag is developing, and this smaller structure is the key trigger for any potential continuation. The bullish outlook remains valid only if this smaller flag breaks cleanly.
The recent pullback dipped deeper than expected, which signals hesitation from buyers. When confidence fades, even a promising breakout can turn into a sweet trap that lifts briefly before falling sharply.
Because of this, patience becomes essential. Before entering, we need a clear and decisive breakout that confirms strength. Specifically, we should look for a candle that breaks through resistance with firmness and clarity. If such a confirmation appears, the path toward the 4,300 level becomes structurally supported.
On the other hand, if the price falls below the lower trendline, the bullish scenario is invalidated immediately. At that point, the setup no longer holds and should not be traded.
For now, the principle is straightforward.
No breakout means no entry. Stay disciplined and avoid letting the market pull you into unnecessary risk.

HEROMOTOCO - Strong Bullish Momentum Breakout💹 Hero Motocorp Ltd (NSE: HEROMOTOCO)
Sector: Auto | CMP: 5798 | View: Strong Bullish Momentum Breakout
Chart Pattern: Bullish Rectangle Breakout
Candlestick Pattern: Strong Bullish Candle
Swing High: 6246.25
Swing low:3344
HNI Trade Analysis:
Bullish Breakout: 5798.50 - 5810
Stop Loss: 5537.16
Low Risk Level: 5755.13
Stop Loss: 5465.16
STWP Trade Analysis:
Bullish Breakout: 5810
Stop Loss: 5455.95
Strong Momentum with Extremely High Volume
Resistances: 5882|5965.5|6121
Supports: 5643|5487.5|5404
STWP Stock Analysis:
Final Outlook:
Momentum: Strong | Trend: Bullish | Risk: Low | Volume: High
HEROMOTOCO is displaying a powerful continuation of its long-term uptrend, marked by a strong bullish candle and a fresh breakout backed by high institutional activity. The recent structure shows a clear VCP-style contraction, where volatility progressively narrowed before the price expanded sharply — fully validated by the VCP dashboard’s breakout signal. Price has surged with a wide-range move, reclaiming short- and medium-term EMAs while maintaining higher highs and higher lows since early April. Momentum indicators remain firmly bullish — RSI is in the strong zone, MACD has triggered a fresh upward crossover, and Stochastic shows renewed strength, signalling buyers’ dominance across timeframes. Volume behaviour reinforces the setup, with expanding bars confirming accumulation phases followed by trend expansion. Additional confluences such as Bollinger Band expansion, Bullish Supertrend alignment, and multiple technical triggers (RSI breakout, VMA rejection, Bollinger mid-band strength) further strengthen the bullish bias. Overall, the stock reflects a healthy, institutionally supported uptrend with strong momentum, clear VCP validation, and a technically clean continuation structure that favours upside extensions as long as it sustains above its short-term demand zones.
⚠️ Disclosure & Disclaimer – Please Read Carefully
The information shared here is meant purely for learning and awareness. It is not a buy or sell recommendation and should not be construed as investment advice.
I am not a SEBI-registered investment adviser, and this analysis is based on chart observations, technical patterns, and public data.
Trading involves risk; market movements can be sudden, and losses may exceed invested capital.
Past performance or setups do not guarantee future results.
Please evaluate your risk management and suitability before taking any trading decision.
Consult a SEBI-registered financial adviser before acting on any trade idea.
Position Status: No active position in (HEROMOTOCO) at the time of analysis.
Data Source: TradingView & NSE India (Past Chart Reference).
💬 Found this useful?
🔼 Give this post a Boost to help more traders discover structured learning.
✍️ Drop your thoughts, queries, or setups in the comments — let’s grow together!
🔁 Share this with fellow traders and learners to promote structured analysis.
👉 “If you liked this breakdown, follow for more clean, disciplined setups with patience at the core.”
🚀 Stay Calm. Stay Clean. Trade With Patience.
Trade Smart | Learn Zones | Be Self-Reliant 📊

BUY TODAY SELL TOMORROW for 5%DON’T HAVE TIME TO MANAGE YOUR TRADES?
- Take BTST trades at 3:25 pm every day
- Try to exit by taking 4-7% profit of each trade
- SL can also be maintained as closing below the low of the breakout candle
Now, why do I prefer BTST over swing trades? The primary reason is that I have observed that 90% of the stocks give most of the movement in just 1-2 days and the rest of the time they either consolidate or fall
Trendline Breakout in SAKSOFT
BUY TODAY SELL TOMORROW for 5%

BUY TODAY SELL TOMORROW for 5%DON’T HAVE TIME TO MANAGE YOUR TRADES?
- Take BTST trades at 3:25 pm every day
- Try to exit by taking 4-7% profit of each trade
- SL can also be maintained as closing below the low of the breakout candle
Now, why do I prefer BTST over swing trades? The primary reason is that I have observed that 90% of the stocks give most of the movement in just 1-2 days and the rest of the time they either consolidate or fall
Trendline Breakout in MRPL
BUY TODAY SELL TOMORROW for 5%

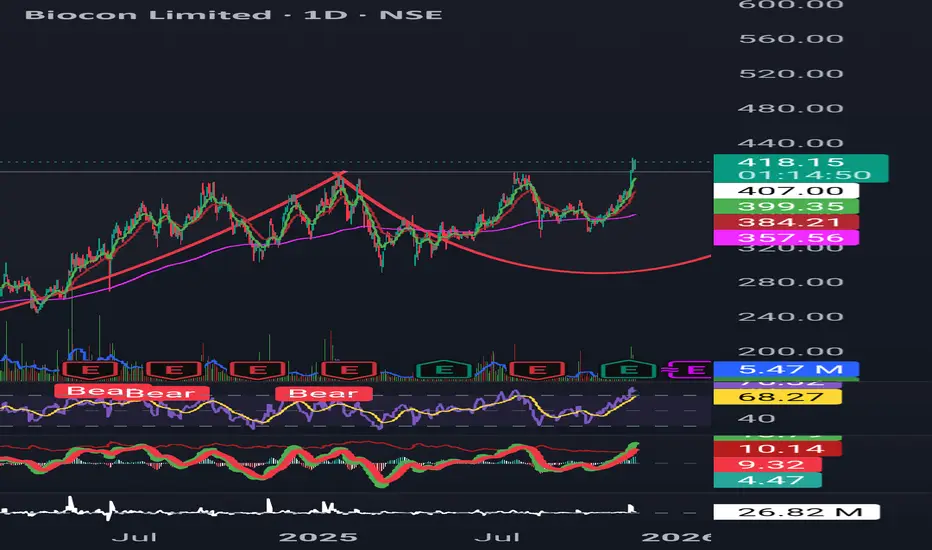
Biocon breaks out of 4-year consolidationStructure: Breakout from a long-term 4-year consolidation base
Volume: Strong expansion indicating institutional participation
Momentum:
RSI > 70 and holding → bullish trend zone
MACD positive and rising → trend confirmation
Trend:
9 EMA > 21 EMA > 200 EMA → multi-timeframe trend alignment
Sector Strength:
Pharma sector outperforming (Sun Pharma, JB Chem, Lupin, Biocon)
Broad-based buying visible across sector
Bias: Bullish as long as price sustains above breakout levels
Invalidation: Close back below breakout zone or loss of EMA/MACD trend
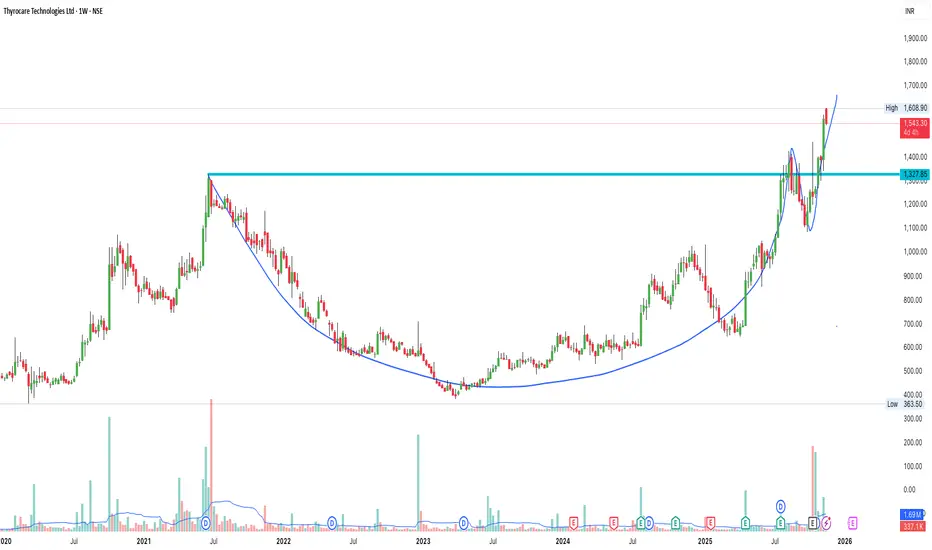
Thyrocare Technologies – Weekly Chart Breakout AnalysisCup & Handle pattern breakout visible on higher timeframe (1W).
Price has retested the breakout zone around ₹1325 and given a strong bounce with volume.
Key Points:
🔹 Multi-year Cup & Handle formation
🔹 Breakout + successful retest
🔹 Strong momentum candles after retest
🔹 Next potential zone: ₹1650 – ₹1750 (if momentum continues)
Support : ₹1325
Short-term trend : Bullish
Structure : Higher highs – Higher lows
Not a recommendation. Just sharing my chart study.
Warning: $ETH Is About to Hit Its Most Critical Zone of 2025!Warning: CRYPTOCAP:ETH Is About to Hit Its Most Critical Zone of 2025!
Macro Structure
ETH remains macro bullish, currently in a healthy correction after rejecting the premium zone near $4,960.
The strong displacement from $1,577 (0.618 Fib) confirmed bullish structure, but price is now retracing into discount levels.
Key Fibonacci Levels
Measured from $879 → $4,960, ETH is deeply entering ICT discount territory:
0.382 – $3,048 (Tested)
0.500 – $2,622
0.618 – $2,256 ← Top probability zone
0.786 – $1,821
FVG & OB Zones (Major Decision Area)
1️⃣ Unfilled FVG → $2,875
👉 This is the most important decision point right now.
👉 High probability that ETH will fill this FVG.
👉 If price holds above this FVG, bullish continuation becomes very strong.
👉 If ETH fails to hold $2,875, expect the correction to deepen.
2️⃣ Next Major Support
Bullish OB: $2,622 – $2,256
→ Perfect confluence of Order Block + 0.5/0.618 Fib.
👉 This is the strongest demand zone on the entire chart and a top accumulation area.
Expectations
Most likely:
ETH fills the $2,875 FVG, then either bounces → resumes uptrend
or
breaks down → moves into $2,250–$2,620 OB to accumulate before the next macro leg.
Targets After Correction: $4,058 / $4,960 / $5,800 / $7,200 (1.618 extension)
Conclusion
ETH remains strongly bullish on HTF.
Watch $2,875 FVG as the key decision level.
If lost → $2,250–$2,620 OB becomes the premium accumulation zone before ETH heads toward new ATH.
NFA. DYOR.

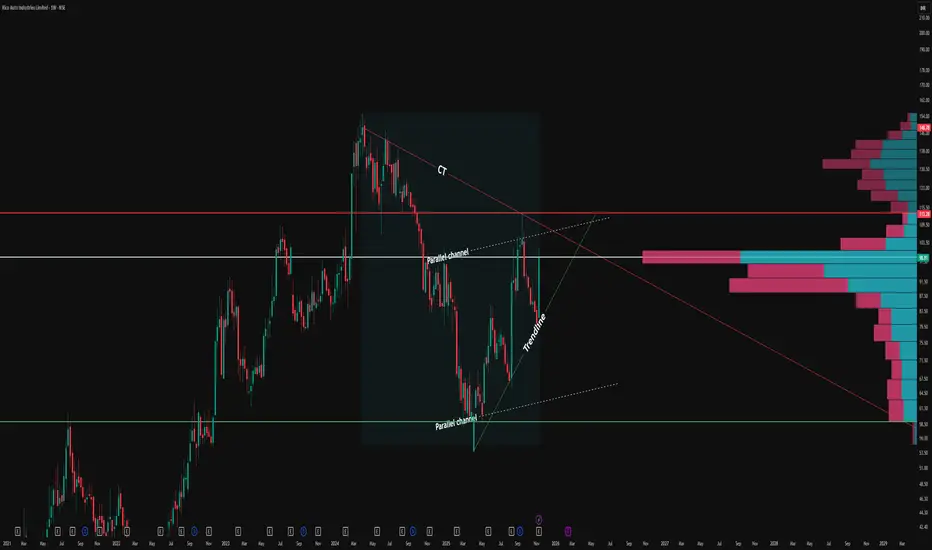
How Counter Trendlines and Parallel Channels Reveal Price StructThe CT (Counter Trendline) as the prime technical feature. The red CT line distinctly marks recurring lower high rejections, shaping significant supply pockets and creating low-liquidity price zones at every inflection point.
Each touch validates the CT’s relevance, highlighting how price is repeatedly capped at these lower highs before reversing downward.
Overlaying this, a hidden parallel channel (dotted white lines) frames the swing movement. The channel not only encapsulates price but also serves as a running test of trend strength: each upper boundary touch confirms resistance, while bottoms act as support.
Notably, more hits at the upper parallel line than the base typically signal rising underlying bullish energy, especially when accompanied by the green trendline’s upward momentum.
No breakout, no prediction—just objective structure. The parallel channel and trendlines, when mapped carefully, elevate clarity on price balancers, guidance zones, and the ongoing duel between support and rejection.
Observe how these formations reveal crowd psychology and liquidity placement without forcing a directional view.
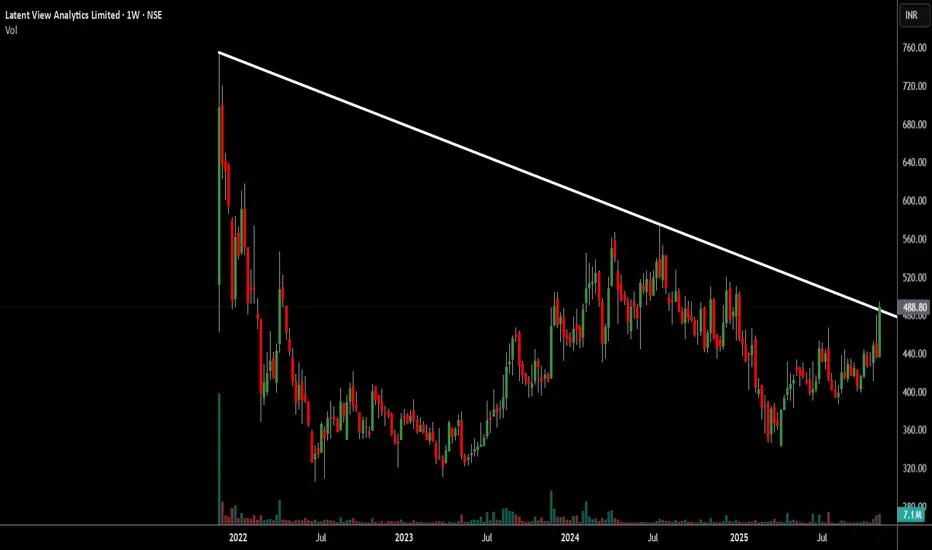
Latent View Analytics Ltd (Latentview) CnH Trendline BreakoutLatent View Analytics Limited (Nse: latentview) share is ready for a trendline breakout. The technical pattern appears to be a cup and handle. The stock is already closed outside the line. #latentview #breakout
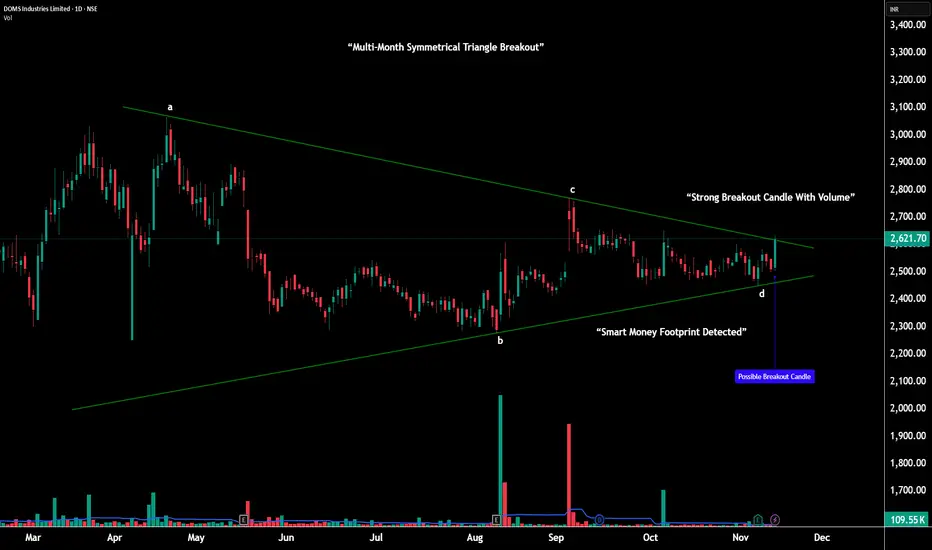
DOMS – Multi-Month Triangle Breakout |________________________________________
💹 DOMS Industries Ltd (NSE: DOMS)
Sector: Consumer & Stationery Products | CMP: 2621.70 |
View: Multi-Month Symmetrical Triangle Breakout With Expanding Momentum
________________________________________
📊 Price Action:
DOMS has spent the last five months forming a large symmetrical triangle — a volatility contraction structure marked by steady lower highs and higher lows from points A–B–C–D.
Throughout this period, buyers consistently defended the broader 2470–2500 demand belt, while sellers lost strength on every push lower.
This slow tightening shows how the market was preparing for a decisive move.
In the latest session, DOMS finally broke above the upper trendline, backed by a strong bullish range candle and a clear rise in volume, confirming the start of a fresh expansion phase.
________________________________________
📉 Chart Pattern Analysis – Large A–B–C–D Symmetrical Triangle:
This multi-month structure represents a major volatility compression following a previous uptrend — a classic continuation setup.
Point A: First major lower high
Point B: Deep anchor low
Point C: Lower high confirming supply weakening
Point D: Higher low showing demand strengthening
This clean A–B–C–D formation validates the symmetrical triangle perfectly.
As price approached the apex, volatility dried up, volume decreased, and the range narrowed — all ideal ingredients for a strong breakout.
The breakout candle now signals the end of compression and beginning of trend expansion.
________________________________________
📈 STWP Trading Analysis:
Bullish Breakout Zone: 2621.70 – 2633.20 | Stop Loss: 2498.60
The breakout candle shows high momentum and elevated volume, signaling institutional activity. Price has reclaimed all key moving averages with trend strength visible across 1H–1D–1W timeframes. As long as DOMS holds above the 2570–2590 structure zone, the bullish continuation bias remains active. Upside resistance levels can be used as potential levels of partial profit-taking, momentum checkpoints, and trend continuation targets.
________________________________________
🕯️ Candlestick Structure – Strong Bullish Breakout Candle:
The latest session printed a wide-range bullish candle, breaking through the upper triangle boundary decisively.
This type of candle — strong body, controlled wicks, clean range expansion — reflects conviction buying, not speculative spikes.
When this appears at the apex of a large compression pattern, it often marks the start of a new trending phase.
________________________________________
📏 Fibonacci Analysis:
Measured from swing low 2275.40 to swing high 2585.70:
38.2% @ 2393 → Secondary support
50% @ 2430 → Balanced support zone
61.8% @ 2467 → Strong golden zone (defended repeatedly)
The rebound from the 61.8% area aligns with the D-point of the triangle — reinforcing the structural validity and strengthening the breakout.
________________________________________
🧭 STWP Support & Resistance:
Resistances: 2667 | 2713 | 2794
Supports: 2540 | 2459 | 2413
The 2470–2500 region remains a major demand base, where the stock formed its higher lows at point D.
Immediate supply lies near 2667–2713, the first test zone after the breakout.
________________________________________
📊 STWP Volume & Technical Setup:
Volume climbed to 109.55K, significantly higher than recent averages — showing accumulation on the breakout.
RSI at 59 and Stochastic at 67 suggest healthy momentum with room for continuation.
MACD structure remains bullish, and multi-timeframe trend strength is intact.
Trend Direction: UPTREND | Volume Confirmation: Strong Buying Activity
________________________________________
🧩 STWP Summary View:
Momentum: Strong
Trend: Bullish
Risk: Moderate
Volume: High
DOMS has broken out of a large multi-month symmetrical triangle, a pattern known for initiating strong directional moves once volatility expands.
The structure remains bullish above 2570–2590, with continuation potential toward 2667 → 2713 → 2794 in the coming sessions.
________________________________________
⚠️ Disclosure & Disclaimer – Please Read Carefully
This analysis is for educational purposes only and should not be treated as investment advice.
I am not a SEBI-registered financial advisor.
Trading carries risk — use stop-loss, risk limits, and disciplined position sizing.
Please consult a SEBI-registered adviser before making trading decisions.
________________________________________
Position Status: No active position in (DOMS) at the time of this analysis.
Data Source: TradingView & NSE India
________________________________________
💬 Found this useful?
🔼 Boost this post to help more traders learn structured analysis
💭 Share your thoughts — does this breakout hold the strength for trend expansion?
🔁 Share with traders who study breakout structures
👉 Follow for more clean, price-action-driven institutional breakdowns
🚀 Stay Calm. Stay Clean. Trade With Patience.
Trade Smart | Learn Zones | Be Self-Reliant 📊
________________________________________
XAUUSD: Continuing Uptrend with Potential Expansion to $4,280OANDA:XAUUSD has shown strong performance in the ascending channel, and I expect this trend to continue as shown in my chart, with a target price of $4,280.
The current area represents a key turning point, where prices could find support allowing them to rise, or they may break down, which could lead to a further downward movement.
If I were to choose the most likely direction, I would lean towards upward price movement. However, only market action will determine whether the channel will continue or not.
If the downtrend line is breached strongly, it will invalidate the bullish scenario, meaning that the bullish momentum could weaken or even reverse in the short term.
These are just my personal forecasts based on technical analysis, and they do not represent financial advice. Always make sure to verify your setups and manage risks wisely.
Wishing you successful and profitable trading!

Thyrocare-A beautiful breakout is done!Thyrocare has given a good closing today above its previous ATH.
Stock has formed a beautiful rounding bottom pattern. Volumes buildup before breakout is decent as well.
Previously, i had covered Policybazar & Zomato with such patterns and they have given amazing returns.
Keep this stock in watchlist. This can give similar move as well.
Entering at ATH levels is tricky but these stocks come with excellent reward opportunity.
I am NISM certified RA and not SEBI registered.
This is not a recommendation but is shared for you to learn.

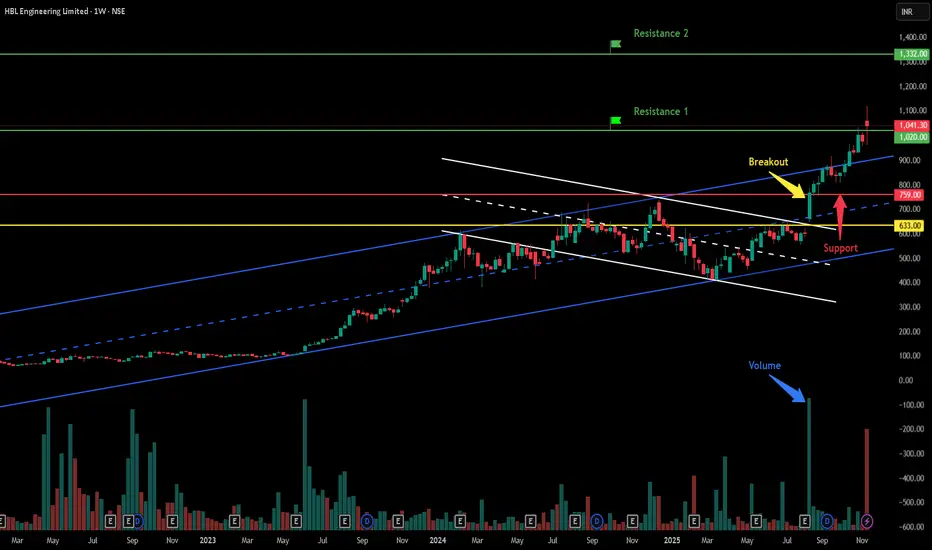
HBL Engineering Ltd - Breakout Setup, Move is ON...#HBLENGINE trading above Resistance of 1020
Next Resistance is at 1332
Support is at 759
Here is previous chart:
Chart is self explanatory. Levels of breakout, possible up-moves (where stock may find resistances) and support (close below which, setup will be invalidated) are clearly defined.
Disclaimer: This is for demonstration and educational purpose only. This is not buying or selling recommendations. I am not SEBI registered. Please consult your financial advisor before taking any trade.
BUY TODAY SELL TOMORROW for 5%DON’T HAVE TIME TO MANAGE YOUR TRADES?
- Take BTST trades at 3:25 pm every day
- Try to exit by taking 4-7% profit of each trade
- SL can also be maintained as closing below the low of the breakout candle
Now, why do I prefer BTST over swing trades? The primary reason is that I have observed that 90% of the stocks give most of the movement in just 1-2 days and the rest of the time they either consolidate or fall
Resistance Breakout in
PARAS
BUY TODAY SELL TOMORROW for 5%

BUY TODAY SELL TOMORROW for 5%DON’T HAVE TIME TO MANAGE YOUR TRADES?
- Take BTST trades at 3:25 pm every day
- Try to exit by taking 4-7% profit of each trade
- SL can also be maintained as closing below the low of the breakout candle
Now, why do I prefer BTST over swing trades? The primary reason is that I have observed that 90% of the stocks give most of the movement in just 1-2 days and the rest of the time they either consolidate or fall
Cup & Handle Breakout in IFBAGRO
BUY TODAY SELL TOMORROW for 5%

BUY TODAY SELL TOMORROW for 5%DON’T HAVE TIME TO MANAGE YOUR TRADES?
- Take BTST trades at 3:25 pm every day
- Try to exit by taking 4-7% profit of each trade
- SL can also be maintained as closing below the low of the breakout candle
Now, why do I prefer BTST over swing trades? The primary reason is that I have observed that 90% of the stocks give most of the movement in just 1-2 days and the rest of the time they either consolidate or fall
Consolidated Breakout in CCL
BUY TODAY SELL TOMORROW for 5%

Emerging Symmetry: Spotting Recurrent Patterns on the WtfNoticing an interesting structural similarity on the weekly chart, where a previous impulsive move (highlighted) was followed by a prolonged corrective phase confined within dynamic support and resistance lines. The current price action is developing above a rising support and beneath a descending trendline, reflecting the classic ingredients of compression after expansion seen earlier.
This type of setup warrants attention for those studying recurring market behaviours and pattern symmetry.
No directional bias—just a pure market structure observation drawn from historical context.

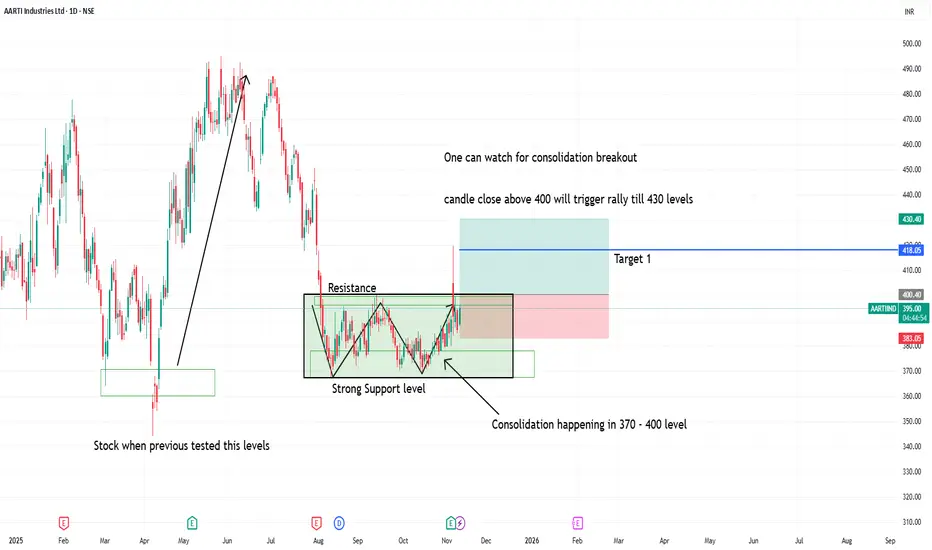
Watch for consolidation breakout in aarti industries1. Above 400 daily candle close will give strength to buyers to reach 430 level targets
2. Stock previously tested support levels gave big upside movement.
3. With good R:R one can watch for upside movement
4. normally the range of consolidation is target after breakout
if 30 points is consolidation range then target will 30 points after the consolidation breakout
Unlocking Chart Vision: Why One Breakout Isn’t EnoughRetail traders often gravitate towards the familiar—you’ll notice on the right chart, a classic breakout above the counter trendline (CT) is the “go-to” setup most focus on. This approach is common, but it can signal limited experience or a lack of exposure to complex, multi-pattern scenarios.
As a full-time trader, my scanning process involves viewing charts through a multi-pattern lens, not just relying on a single breakout narrative. On the left chart, you’ll spot another prominent CT in red—this additional hurdle isn’t always visible to less experienced eyes. Notably, a hidden parallel channel (orange) adds further nuance, underscoring the importance of assessing every structure before deciding on bias or trade management.
This post is purely observational—there’s no forecasting or trade advice here. The goal is to highlight why expanding your pattern recognition toolkit and investing more screen time can reveal deeper price action dynamics often missed in simplistic approaches. If you want to bring your technical analysis to a professional level, start looking for what’s not immediately obvious!
