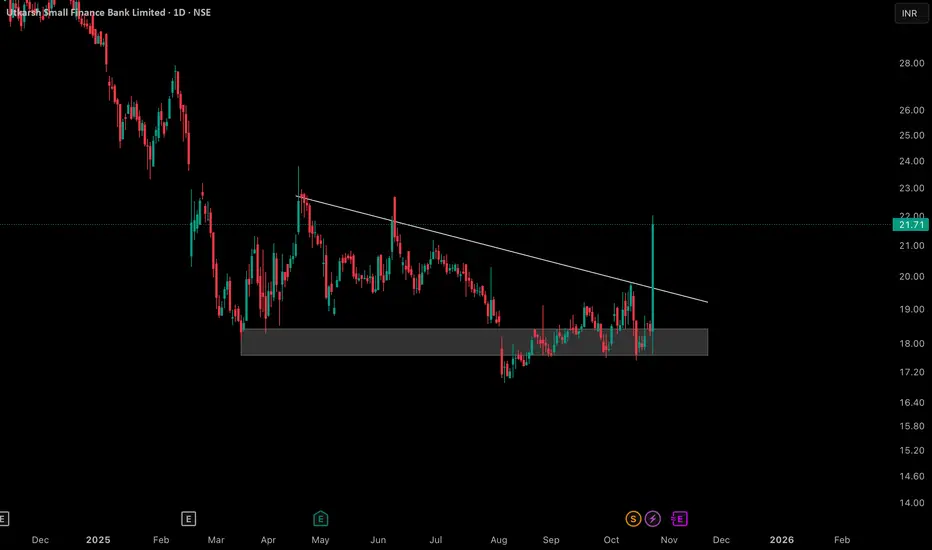
Descending Triangle fake breakdowns explainedThe daily chart for Utkarsh Small Finance Bank Limited displays a well-defined descending triangle, marked by a consistent supply trendline and an established horizontal support zone. During the recent price action, there was a temporary dip below the support, which was quickly retraced as price action returned within the range and formed a distinct lower wick rejection candle at the base.
This chart highlights the role of false moves and re-entries within important technical zones, as well as the reaction to a descending trendline. No trading advice or forecast is implied—this is for educational and analytical purposes, providing an example of how certain classical patterns and market behaviors may unfold within price structure.
Breakout!
Jayneco (W) - Breaks Out on Massive VolumeAfter an incredible 181%+ rally since April 2025, Jayaswal Neco Industries (JAYNECO) has been consolidating in a sideways trend for the past few weeks. This period of consolidation has now been decisively resolved to the upside.
This Week's Powerful Breakout
The past week's price action (ending Oct 24, 2025) was a significant win for the bulls:
- Strong Price Surge: The stock rallied by +15.95% for the week.
- Enormous Volume: This move was backed by a massive volume of 67.09 million shares , confirming strong buyer conviction.
- Key Resistance Breach: The surge shattered the consolidation's upper resistance trendline, and most importantly, closed the week above it .
Broad-Based Technical Strength
The breakout is underpinned by strong momentum across multiple timeframes. On both the Monthly and Weekly charts:
- The short-term Exponential Moving Averages (EMAs) are in a bullish Positive Crossover (PCO) state.
- The Relative Strength Index (RSI) is in a rising trend.
This alignment confirms that the primary momentum is strongly bullish and supports the case for a new leg up.
Outlook and Key Levels to Watch
With the resistance now cleared, the path of least resistance has shifted firmly upwards.
- Bullish Target: If this strong momentum is sustained, the next logical area of resistance and potential price target is the ₹84 level.
- Critical Support: The recently broken resistance, around the ₹75 level, now becomes the most critical new support zone.
As you noted, the price action next week will be crucial. Traders should watch for follow-through buying or a potential retest of the ₹75 breakout level, which would now be expected to act as strong support.

BUY TODAY SELL TOMORROW for 5%DON’T HAVE TIME TO MANAGE YOUR TRADES?
- Take BTST trades at 3:25 pm every day
- Try to exit by taking 4-7% profit of each trade
- SL can also be maintained as closing below the low of the breakout candle
Now, why do I prefer BTST over swing trades? The primary reason is that I have observed that 90% of the stocks give most of the movement in just 1-2 days and the rest of the time they either consolidate or fall
Trendline Breakout in HCG
BUY TODAY SELL TOMORROW for 5%

KOTAKBANK - Rectangle Consolidation Breakout Watch🚀 Kotak Mahindra Bank Ltd (NSE: KOTAKBANK) | Rectangle Consolidation Breakout Watch
📊 Current Market Snapshot
CMP: ₹2,063.30
Sector: Banking & Financial Services
Pattern Observed: 📦 Rectangle Consolidation (Range-Bound)
Candlestick Signal: Strong Bullish Candle + Bullish Engulfing
Strength Rating: ⭐⭐⭐⭐ (Bullish Breakout Watch)
________________________________________
📈 Price Action & Chart Pattern
The stock has been trading between support near ₹1,970 and resistance near ₹2,020, forming a sideways rectangle box. Today’s move shows a decisive bullish candle with high volume, suggesting a breakout attempt from this consolidation.
Support Range: ₹1,968 – ₹1,970
Resistance Range: ₹2,018 – ₹2,020
Breakout Zone: Above ₹2,020 with volume confirmation
Breakdown Zone: Below ₹1,970 may trigger renewed weakness
🔍 Why Important? Rectangle consolidations represent accumulation or distribution phases. A breakout above resistance often leads to strong directional moves.
________________________________________
🔎 Technical Indicators
RSI (14): 61.37 → Breaking out of consolidation zone.
EMA Support: Price reclaiming above EMA50, signaling trend strength.
Volume: Breakout attempt supported by 1.5x+ average volumes.
Kotak Bank — a strong bullish candle with Bullish Engulfing, RSI breakout, and Open = Low showing aggressive buying from the start. Price holding above VWAP signals institutional support, while the BB squeeze off suggests volatility expansion ahead. Together, these factors strengthen the case for a rectangle breakout continuation.
________________________________________
📍 Key Levels to Watch
Immediate Support: ₹1,968 – ₹1,970
Immediate Resistance: ₹2,018 – ₹2,020
Upside Possible (if breakout): ₹2,120 – ₹2,150
Downside Possible (if breakdown): ₹1,920 – ₹1,900
________________________________________
🔮 Bullish & Bearish Scenarios
✅ Bullish Case: Sustained close above ₹2,020 with strong volume may trigger a rally towards ₹2,120+.
⚠️ Bearish Case: Rejection near ₹2,020 and breakdown below ₹1,970 may drag the stock back to ₹1,920 or lower.
________________________________________
📝 STWP Trade Analysis
Entry: ₹2,063.30
Stop-loss: ₹1,968.60 (below rectangle support)
Risk: ~₹94.70 points
Strength: ⚡ Strong Bullish Momentum + High Volume + EMA Breakout
Demand Zone: ₹2,009 – ₹1,970 | SL: 1,968.60
📌 Note: Rectangle breakouts backed with volume tend to give quick moves. Traders should stay disciplined with SL.
________________________________________
🎯 Final Outlook
Kotak Mahindra Bank is attempting a bullish breakout from a rectangle consolidation zone. If the stock sustains above ₹2,020 with volumes, it could rally towards ₹2,120–₹2,150. However, failure to hold may drag it back inside the range.
________________________________________
💡 Learning Note: Rectangle patterns represent market indecision zones where buyers and sellers balance out. Breakouts with strong volume often indicate institutional participation, providing reliable trade setups.
________________________________________
⚠️ Disclosure & Disclaimer – Please Read Carefully
The information shared here is meant purely for learning and awareness. It is not a buy or sell recommendation and should not be taken as investment advice. I am not a SEBI-registered investment adviser, and all views expressed are based on personal study, chart patterns, and publicly available market data.
Trading—whether in stocks or options—carries risk. Markets can move unexpectedly, and losses can sometimes exceed the money you have invested. Past performance or past setups do not guarantee future results.
If you are a beginner, treat this as a guide to understand how the market works and practice on paper trades before risking real money. If you are experienced, always assess your own risk, position sizing, and strategy suitability before entering trades.
Consult a SEBI-registered financial adviser before making any real trading decision. By engaging with this content, you acknowledge full responsibility for your trades and investments.
💬 Found this useful?
🔼 Give this post a Boost to help more traders discover clean, structured learning.
✍️ Drop your thoughts, questions, or setups in the comments — let’s grow together!
🔁 Share with fellow traders and beginners to spread awareness.
👉 “If you liked this breakdown, follow for more clean, structured setups with discipline at the core.”
🚀 Stay Calm. Stay Clean. Trade With Patience.
Trade Smart | Learn Zones | Be Self-Reliant 📊
________________________________________

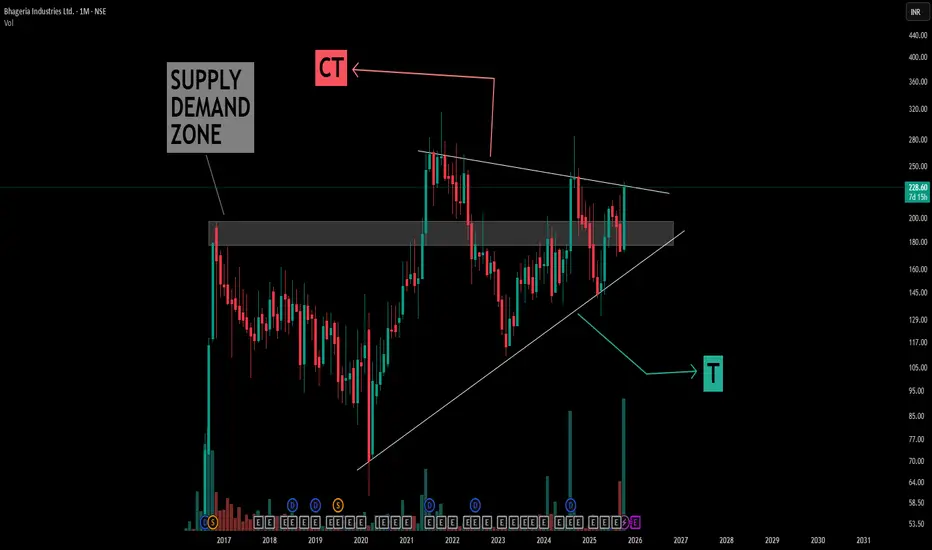
Understanding Symmetrical Triangle Patterns in depthThis chart illustrates a classic example of a symmetrical triangle pattern formed over several years, with simple compression trendline (CT) and trigger (T) lines drawn in white for clarity.
Key learning points from the structure:
- Symmetrical Triangle Formation: The pattern is defined by converging trendlines representing successive lower highs and higher lows, indicating a period of price consolidation and market indecision
- Supply Converts to Demand: The boxed area initially acted as supply, where price faced resistance repeatedly. Over time, after multiple interactions and a structural shift, this area began to act as demand, offering support to subsequent price movements. This showcases how prior resistance can evolve into a support zone as market dynamics shift.
- Pattern Context: A large symmetrical triangle is forming above this zone, highlighting sustained equilibrium between buyers and sellers, and price compressing within clearly defined boundaries.
- Educational Note: Patterns like these offer valuable case studies for understanding consolidation phases, the role of supply and demand flipping, and how market structure can evolve. They can be identified and studied without making directional assumptions, serving as an excellent foundation for technical analysis practice.
This post is aimed purely at technical education, emphasizing the process of chart marking, pattern recognition, and structural interpretation, without making market predictions or outcome forecasts.
BUY TODAY SELL TOMORROW for 5%2 days ago
DON’T HAVE TIME TO MANAGE YOUR TRADES?
- Take BTST trades at 3:25 pm every day
- Try to exit by taking 4-7% profit of each trade
- SL can also be maintained as closing below the low of the breakout candle
Now, why do I prefer BTST over swing trades? The primary reason is that I have observed that 90% of the stocks give most of the movement in just 1-2 days and the rest of the time they either consolidate or fall
Resistance Breakout in SBFC
BUY TODAY SELL TOMORROW for 5%

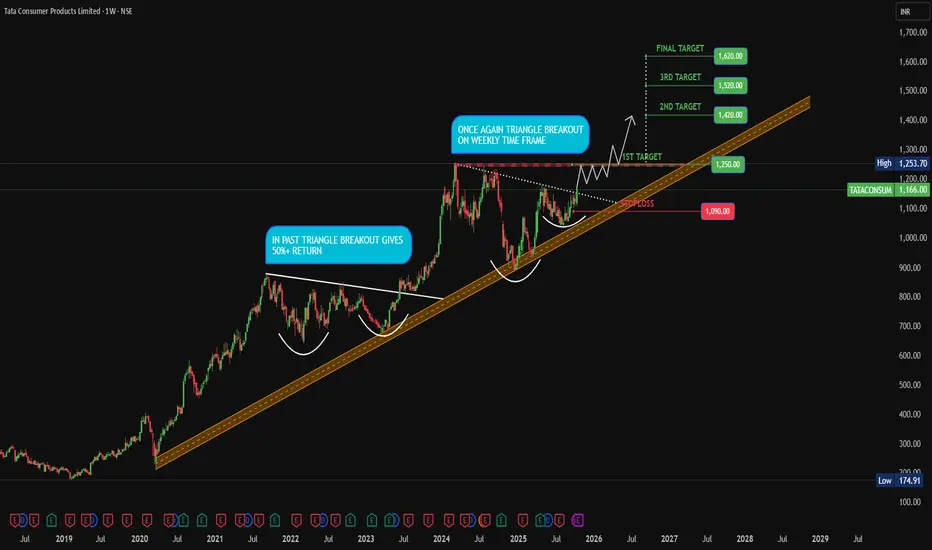
BUY TATA CONS HISTORICAL BREAKOUT in past TATA CONS stock make same triangle structure and gives a breakout than consolidated for 6 to 7 week for accumulation and than gives 52%++ return in a year. Last week its gives same breakout with strong support and good to consider for long term with good risk return. Do your own study and research before entering any position. No guarantee return.
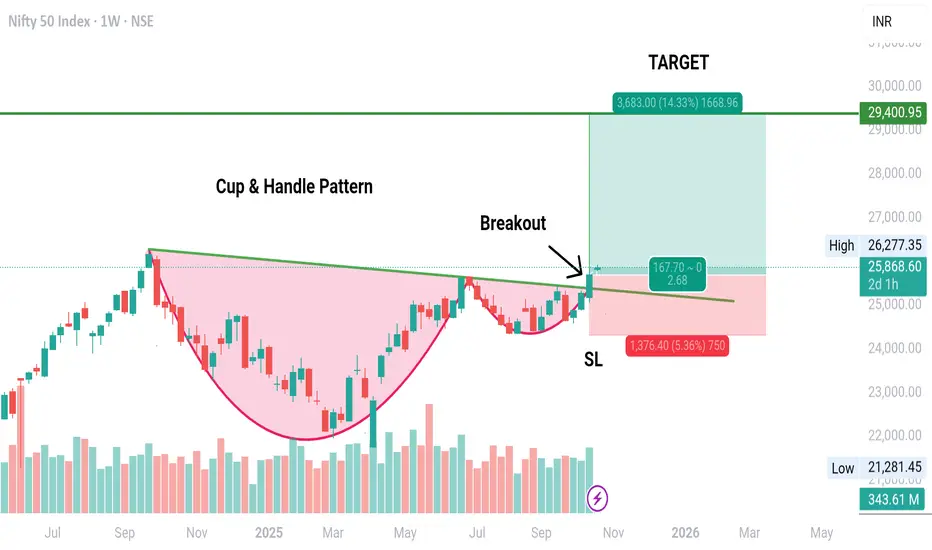
CUP & HANDLE Pattern Breakout in NIFTYA Breakout with good volume has happened in NIFTY 50 INDEX.
The breakout is has happened in weekly Time Frame 😱😱.
A Big target of 29400 is available to be achieved🎯
SL will be below the Handle's Low on sustaining Basis.
A better entry could be the one after retracement💡. As there are high chances of retracement from here as the price is very near to lifetime high.
One should always be cautious with the trade as the time is weekly. And, there can be many factors which can become hurdle like War, Tariff War, US economic bubble burst leading to crash etc etc.
However, entry target and SL are also mentioned in the chart.
Subscribe to my YouTube Channel for more details and more analysis.
Note: This analysis is for Educational Purpose Only. Please invest after consulting a professional financial advisor.
XAUUSD Forms a Cup and Handle PatternOANDA:XAUUSD has been steadily rising, maintaining strong and consistent upward momentum. If you’ve been following my previous analyses, you’ll notice a familiar pattern developing on the chart — the classic Cup and Handle formation.
Looking closer, the left side of the chart reveals a strong supply zone, forming the cup. Then, we see the market building a potential handle on the right, indicating that the price is accumulating strength for the next move.
Now, here’s where things get interesting: if buying pressure aligns with Dow Theory waves and the Fibonacci retracement levels at 0.786 and 0.618 hold steady, with the price breaking through the neckline, this setup could push gold to 4500 USD.
However, if selling pressure comes in stronger than expected, the pattern may fail, and we could see a price pullback.

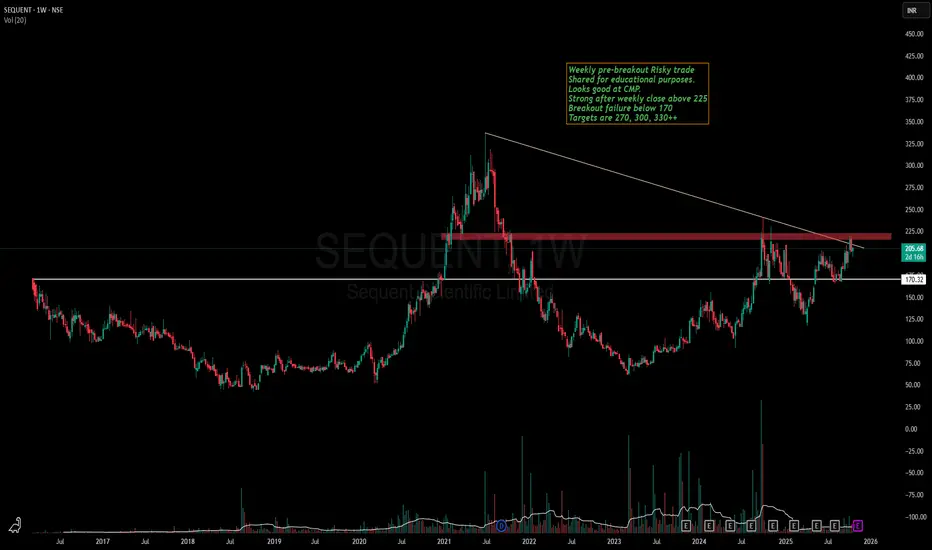
Sequent Scientific - Is it ready for a run towards ATH now?Sequent has been in my watchlist since the breakout of 170 levels.
Stock is making a good Higher high , Higher low pattern in weekly time frame and VCP in lower time frame.
Recently stock gave breakout of a strong resistance zone of 190-200 and is currently consolidating above the same.
If the breakout of 225 happens, we might see stock making a new ATH soon.
Keep this stock in watchlist and lets learn together how the patterns unveils.
This is not a recommendation and idea shared only for educational purposes
I am a NISM Certified RA & not SEBI registered.
AdityaBirlaCapital - Investment IdeasAditya Birla Capital Ltd - Technical Analysis
Simple Technical Analysis Summary
Aditya Birla Capital is breaking out from a multi-year resistance zone with a classic and perfect rounding bottom pattern playing out on the monthly timeframe.
Fibonacci targets have been activated!
Key Technical Observations
1. Multi-Year Rounding Bottom Pattern
The stock has completed a textbook rounding bottom formation spanning multiple years. This is one of the most reliable bullish reversal patterns in technical analysis, indicating a fundamental shift from bearish to bullish sentiment.
2. Breakout from Multi-Year Resistance
After years of consolidation and base building, the stock has successfully broken out from a significant resistance zone around ₹255. This breakout signals the potential beginning of a new uptrend cycle.
3. Monthly Timeframe Confirmation
The pattern is forming and confirming on the monthly timeframe, which carries significantly more weight than shorter timeframes. Monthly breakouts tend to lead to sustained moves.
4. Fibonacci Extension Framework
Multiple Fibonacci extension levels have been identified and activated, providing a clear roadmap for potential price targets based on the measured move from the rounding bottom pattern.
#Fibonacci Extension Target Levels
Based on the rounding bottom pattern measurement and Fibonacci extensions:
- Target 1: 314.20 (1.272 Fibonacci Extension)
- Target 2: 345.10 (1.414 Fibonacci Extension)
- Target 3: 389.90 (1.618 Fibonacci Extension)
- Extended Target: 472.00 (2.0 Fibonacci Extension)
Key Support Levels
- Immediate Support: 255.00 (Breakout level / Previous resistance turned support)
- Secondary Support: 171.86 (0.618 Fibonacci retracement)
- Critical Support: 146.17 (0.5 Fibonacci retracement)
- Base Support: 42.35 (Rounding bottom base)
- Pattern suggests long-term bullish structure - Risk-reward favorable for position building on dips
Risk Management:
- Maintain stoploss below 255 on monthly closing basis
- For aggressive traders: 240 (allowing some wiggle room)
- For conservative traders: 235 (below breakout zone)
Invalidation Level:
- Monthly close below 240 would weaken the bullish structure
- Break below 220 would invalidate the immediate bullish setup
DISCLOSURE & RISK WARNING:
This analysis is provided for educational and informational purposes only and should not be construed as financial advice, investment recommendation, or an offer to buy or sell securities. Past performance is not indicative of future results.

UJJIVANSFB - VCP Breakout in DTF Script: UJJIVANSFB
Key highlights: 💡⚡
📈 VCP Breakout in DTF
📈 Short consolidation below Resistance
📈 Volume spike seen during Breakout.
📈 MACD Bounce
📈 Can go for a swing trade
⚠️ Important: Always Exit the trade before any Event.
⚠️ Important: Always maintain your Risk:Reward Ratio as 1:2, with this RR, you only need a 33% win rate to Breakeven.
✅Like and follow to never miss a new idea!✅
Disclaimer: I am not SEBI Registered Advisor. My posts are purely for training and educational purposes.
Eat🍜 Sleep😴 TradingView📈 Repeat 🔁

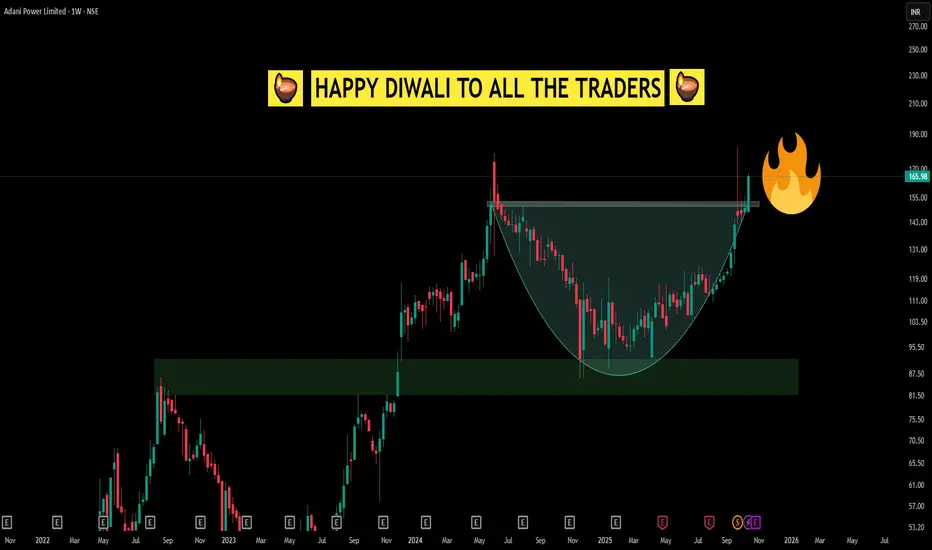
Simple CUP Pattern looking like a Diwali Diya Happy Diwali to All Traders!
This Diwali, the chart tells a special story—a classic cup breakout, but look closely and you'll notice it also resembles a beautifully lit diya. Just like Diwali celebrates the light conquering darkness, this breakout is a reminder of the power of patience, conviction, and disciplined observation in trading.
The cup pattern, much like the diya, signifies a period of accumulation, resilience, and hope before an illuminating breakout. As traders, we learn that enduring through the consolidation (the “darkness”) allows us to witness the rewarding move (the “light”) when the right moment comes.
May this Diwali fill your life and trading journey with wisdom, clarity, and prosperity. Wishing everyone strong breakouts, bright candles, and the perseverance to hold your lamp high, both in the markets and in life.
BITCOIN DECLARED DEAD... AGAIN (498th TIME)BITCOIN DECLARED DEAD... AGAIN (498th TIME)
You know what happened the first 497 times?
It came back stronger. Every. Single. Time.
Meanwhile:
✅ Countries buying it
✅ Institutions loading bags
✅ Miners refusing to sell
But sure, THIS time it's different 😂
The graveyard is full of Bitcoin doubters. Don't be next 💀
CRYPTOCAP:BTC #Bitcoin
Note: NFA & DYOR

Stallion India Fluorochemicals Ltd - Breakout Setup, Move is ON#STALLION trading above Resistance of 312
Next Resistance is at 524
Support is at 204
Here are previous charts:
Chart is self explanatory. Levels of breakout, possible up-moves (where stock may find resistances) and support (close below which, setup will be invalidated) are clearly defined.
Disclaimer: This is for demonstration and educational purpose only. This is not buying or selling recommendations. I am not SEBI registered. Please consult your financial advisor before taking any trade.

Le Travenues Technology Ltd - Breakout Setup, Move is ON...#IXIGO trading above Resistance of 327
Next Resistance is at 460
Support is at 249
Here is previous chart:
Chart is self explanatory. Levels of breakout, possible up-moves (where stock may find resistances) and support (close below which, setup will be invalidated) are clearly defined.
Disclaimer: This is for demonstration and educational purpose only. This is not buying or selling recommendations. I am not SEBI registered. Please consult your financial advisor before taking any trade.

Inox Green Energy Services Ltd - Breakout Setup, Move is ON...#INOXGREEN trading above Resistance of 245
Next Resistance is at 363
Support is at 143
Here are previous charts:
Chart is self explanatory. Levels of breakout, possible up-moves (where stock may find resistances) and support (close below which, setup will be invalidated) are clearly defined.
Disclaimer: This is for demonstration and educational purpose only. This is not buying or selling recommendations. I am not SEBI registered. Please consult your financial advisor before taking any trade.

Inox Green Energy Services Ltd - Breakout Setup, Move is ON...#INOXGREEN trading above Resistance of 160
Next Resistance is at 245
Support is at 99
Here are previous charts:
Chart is self explanatory. Levels of breakout, possible up-moves (where stock may find resistances) and support (close below which, setup will be invalidated) are clearly defined.
Disclaimer: This is for demonstration and educational purpose only. This is not buying or selling recommendations. I am not SEBI registered. Please consult your financial advisor before taking any trade.

Nifty 50 Hits Major Supply Zone After Trendline & VCP Breakout!Today, we're diving deep into the Nifty 50 chart, which is painting a very interesting picture. After a significant downturn, the bulls have been patiently and persistently fighting back. We've seen the index respect several supply zones in the past, leading to temporary declines. However, the character of the market seems to be shifting, and a major breakout has just occurred that we need to talk about.
🚀 A Tale of Two Patterns: Triangles and VCPs
If you look closely at the price action, a story unfolds. For months, Nifty was constrained by a sloping trendline, getting rejected from it on two separate occasions. At the same time, the price was carving out a series of higher lows. This convergence of a flat top (the trendline resistance) and rising bottoms formed a classic ascending triangle pattern—a sign of building bullish pressure.
What makes this setup even more compelling is the subtle pattern within the pattern: a Volatility Contraction Pattern (VCP). Notice how after each minor decline, the pullbacks became shallower. This "drying up" of selling pressure is a textbook sign that sellers are losing control and the big players are accumulating positions. The formation of this VCP right before the breakout was a strong hint that the subsequent move could be powerful and decisive.
Yesterday, we witnessed the culmination of this battle. The price broke out of the triangle and shattered the downward-sloping trendline with significant momentum, slicing through previously tested supply zones. This is a clear victory for the bulls in the short to medium term.
What's Next? Navigating the Path Ahead 🎯
Now for the million-dollar question: where do we go from here? The breakout is strong, but the path ahead isn't without its obstacles.
The Immediate Hurdle: Price is currently pushing into a fresh supply zone . This is the first significant test for the bulls post-breakout. We should anticipate some friction here as sellers who were waiting at these levels might try to defend their territory. This could lead to a bit of consolidation or a minor pullback, which is perfectly healthy.
The Ultimate Test: If the momentum continues and buyers overwhelm the sellers at the current zone, the next major target comes into view. This upper supply zone is particularly critical because it coincides with the All-Time High (ATH). The ATH is not just a technical level; it's a major psychological barrier where many traders may look to book profits. A rejection from this all-important zone is a high probability, given its significance.
In the upcoming sessions, we'll be watching closely to see how the price behaves at these key levels. The strength of the current momentum suggests that the immediate supply zone could be overcome, but the real test awaits at the peak.
Lastly, Thank you for your support, your likes & comments. Feel free to ask if you have questions.
The goal of a successful trader is to make the best trades. Money is secondary.
Disclaimer: Please note that this analysis is purely for educational purposes and should not be considered as a trading or investment recommendation. I am not a SEBI registered Analyst. Always conduct your own research and consult with a financial advisor before making any investment decisions.

GOKULAGRO – A Strong Demand Zone Meets Classic Breakout Retest 📈 Market Insights 📈
In the world of price action, every rally and pullback leaves behind clues — and supply and demand zones are among the most telling. These zones are the footprints of institutions — areas where large players once entered or exited positions, creating visible imbalances on the chart. When price revisits these zones, it often reacts sharply, as unfilled orders get triggered once again.
🧩 Supply & Demand View 🧩
In the case of GOKULAGRO , we’re witnessing this principle in action. After a powerful rally that pushed the stock to fresh all-time highs, the inevitable profit-booking wave stepped in — giving birth to a clean supply zone near the top. This is where sellers briefly took control, pausing the bullish momentum and cooling off the rally.
Now, what’s particularly interesting is where the price has landed. It’s currently hovering around a strong demand zone — not just any support level, but the very origin of the rally that broke previous resistance barriers and fueled the stock’s breakout run. These areas are historically loaded with pending buy orders, and a return to them often sparks a renewed upward reaction.
Demand Zone Strength: Located at the base of a prior impulse move, signaling prior institutional buying.
Price Reaction Potential: Sharp reversals often emerge from such zones as demand reactivates.
Buyer Interest Area: This zone marks where large players previously entered the market aggressively.
🚀 Classical Chart View 🚀
From a traditional technical standpoint, the broader structure also paints a bullish narrative. The stock recently broke through a significant resistance level — a level that had previously capped price for weeks. The breakout was accompanied by a notable volume surge , suggesting strong conviction behind the move.
What’s unfolding now is a textbook example of “resistance turning into support.” As price revisits this breakout zone, selling pressure has notably declined — reflected in a visible drop in volume during the pullback. This reduced activity indicates that sellers are losing steam, and the correction might simply be a healthy retest rather than a reversal.
Old Resistance → New Support: A classic structural shift confirming bullish continuation.
Volume Behavior: Declining sell volume during the pullback suggests waning bearish momentum.
Zone Confluence: The overlap of the demand zone with this retested level strengthens the bullish setup.
✨ Final Takeaway ✨
Both analytical lenses — supply and demand as well as classical technical — align seamlessly here. GOKULAGRO has already found footing at a high-quality demand zone , one that previously launched a major impulse move. If buyers step in again from this region, the stock could well be gearing up for its next leg higher .
For those observing this setup, keeping a protective stop-loss below ₹162.5 could provide a sensible cushion beneath structural support.
💡 Risk Management Reminder 💡
Even the cleanest patterns can fail — that’s the reality of trading. What separates consistent traders from the rest is discipline . Always size your positions wisely and respect your stop-loss.
“The art of trading is not about being right all the time, but about losing less when you are wrong.”
🔄 Patience, consistency, and emotional control often beat bold predictions in the long run.🔄
Lastly, thank you for your support, your likes & comments. Feel free to ask if you have questions.
⚡ Keep learning, keep analyzing — because every chart tells a story! ⚡
This analysis is purely for educational purposes and should not be considered as trading or investment advice. I am not a SEBI-registered analyst.

Ethereum’s Next Move: $3,000 Buy Zone or $10,000 Breakout?Ethereum’s Next Move: $3,000 Buy Zone or $10,000 Breakout?
Current Market Overview:
Ethereum is currently trading below $4,000, indicating short-term weakness as bulls struggle to regain control. The $4,000 level remains a key pivot point, holding above it is essential for any sustained move toward higher targets.
Key Levels to Watch:
🔹 Immediate Resistance: $4,000
🔹 Major Support Zone: $3,000 – $2,600 (ideal accumulation area)
🔹 Upside Targets: $8,000 – $10,000 (if $4,000 is reclaimed)
Bullish Scenario:
If Ethereum breaks and holds above $4,000, it confirms bullish momentum and opens the path toward $8,000–$10,000 in the mid to long term.
Bearish / Accumulation Scenario:
If ETH remains below $4,000, expect a possible retracement toward $3,000 – $2,600. This zone could act as a strong accumulation area for long-term investors.
Outlook:
The broader structure remains long-term bullish despite short-term pullbacks. Dips into major support zones should be viewed as opportunities for strategic accumulation.
⚠️ Note: Always DYOR (Do Your Own Research) before making any investment decisions. This analysis is for educational purposes only.

BUY TODAY SELL TOMORROW for 5%DON’T HAVE TIME TO MANAGE YOUR TRADES?
- Take BTST trades at 3:25 pm every day
- Try to exit by taking 4-7% profit of each trade
- SL can also be maintained as closing below the low of the breakout candle
Now, why do I prefer BTST over swing trades? The primary reason is that I have observed that 90% of the stocks give most of the movement in just 1-2 days and the rest of the time they either consolidate or fall
Resistance Breakout in ICICIGI
BUY TODAY SELL TOMORROW for 5%
