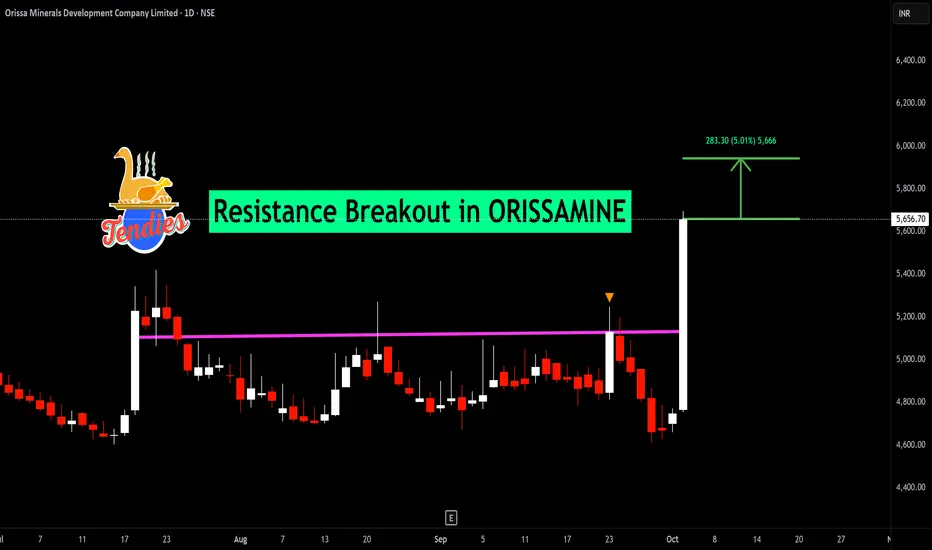
BUY TODAY SELL TOMORROW for 5%DON’T HAVE TIME TO MANAGE YOUR TRADES?
- Take BTST trades at 3:25 pm every day
- Try to exit by taking 4-7% profit of each trade
- SL can also be maintained as closing below the low of the breakout candle
Now, why do I prefer BTST over swing trades? The primary reason is that I have observed that 90% of the stocks give most of the movement in just 1-2 days and the rest of the time they either consolidate or fall
Resistance Breakout in ORISSAMINE
BUY TODAY SELL TOMORROW for 5%
Breakout
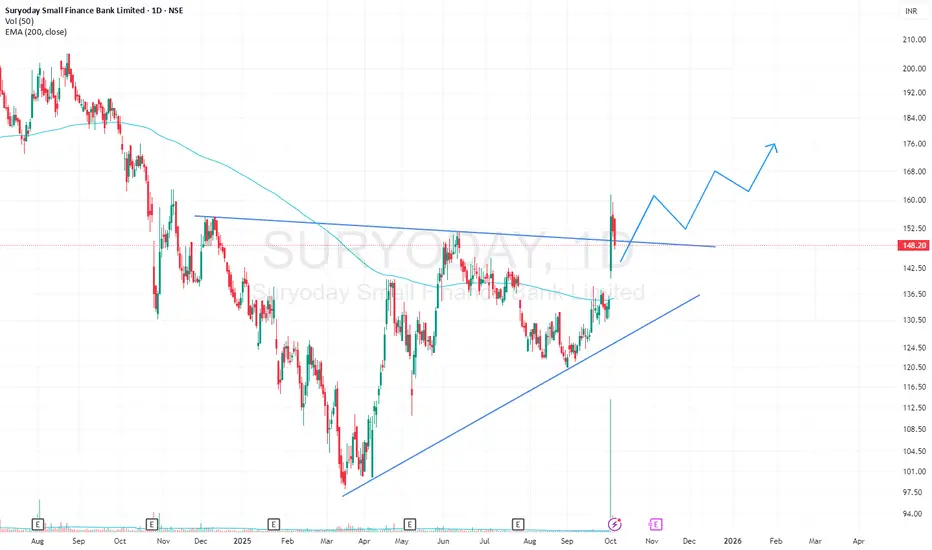
SURYODAY SFB Triangle BreakOutSuryoday SFB has given a breakout from a Triangle pattern with high volumes on 1D timeframe. The stock is apparently retesting its resistance trendline. The stock is also trading above its 200EMA.
Full Replay Breakdown! From Planning to Execution of a TradeWatch as I use the Bar Replay feature to walk you through the planning, execution, and post-trade phases of a real swing trade. Don’t miss these actionable insights, mindsets, and mistakes from start to finish for smarter trading decisions!
Chart used is older than 3 months for explanation

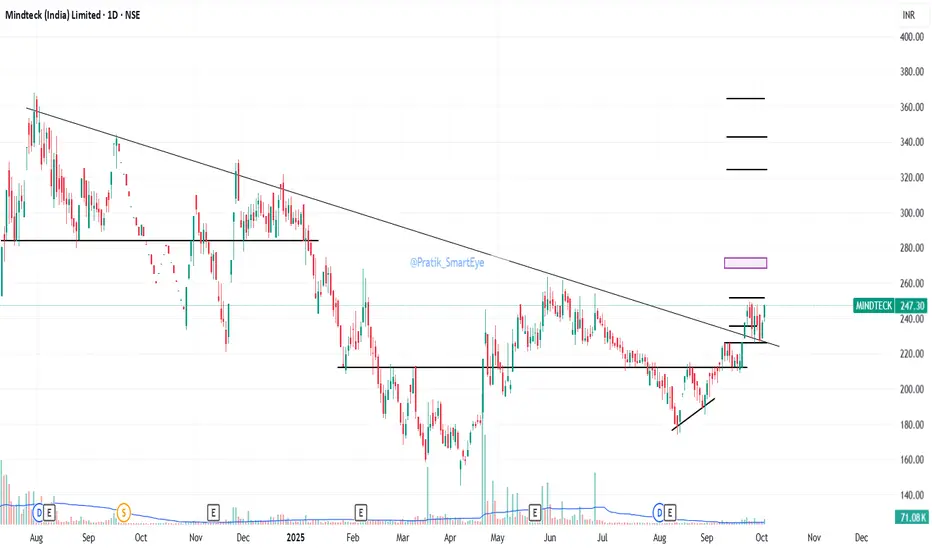
Mindtech India: Breakout at 255.Mindtech India: Breakout at 255. CMP 247.
Resistance 275/324/364
Support 235/226
Semiconductor Sector Tailwinds
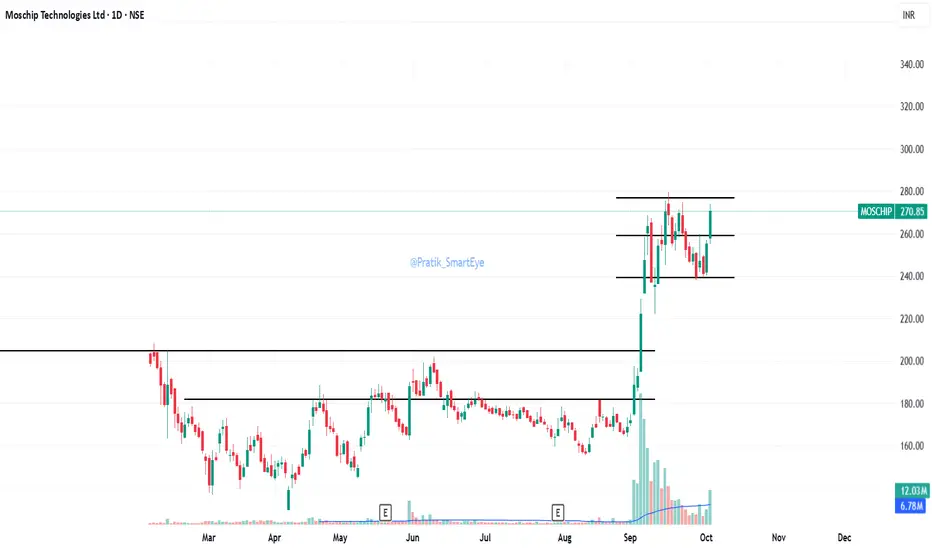
Moschip Technologies: Breakout at 277.Moschip Technologies: Breakout at 277. CMP 270.
Resistance 320
Support 241
Semiconductor Sector Tailwinds
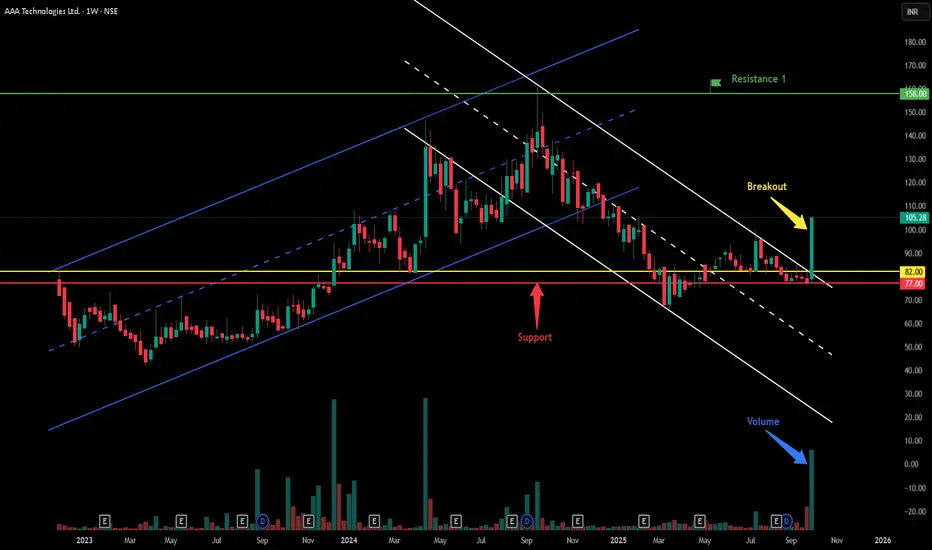
Breakout in AAA Technologies Ltd...Chart is self explanatory. Levels of breakout, possible up-moves (where stock may find resistances) and support (close below which, setup will be invalidated) are clearly defined.
Disclaimer: This is for demonstration and educational purpose only. This is not buying or selling recommendations. I am not SEBI registered. Please consult your financial advisor before taking any trade.
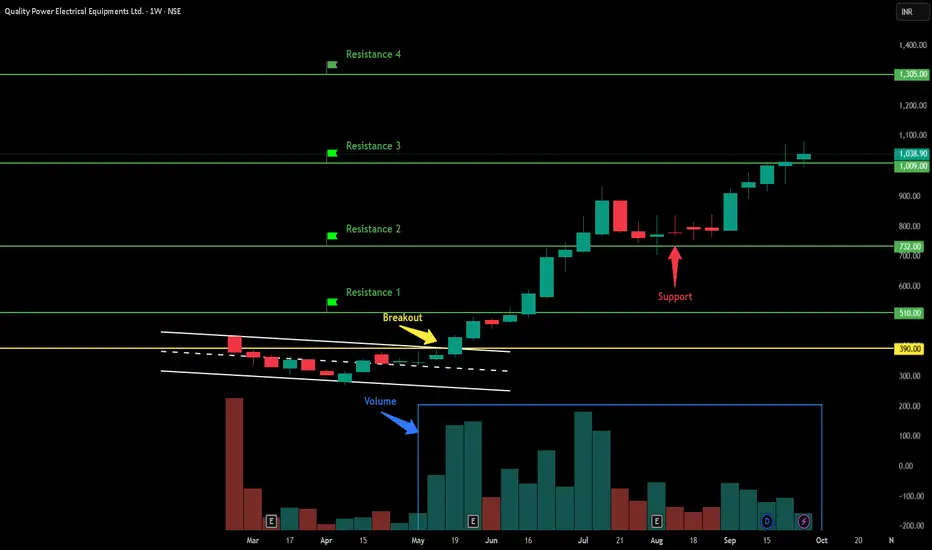
QPOWER - Breakout Setup, Move is ON...#QPOWER trading above Resistance of 1009
Next Resistance is at 1305
Support is at 732
Here are previous charts:
Chart is self explanatory. Levels of breakout, possible up-moves (where stock may find resistances) and support (close below which, setup will be invalidated) are clearly defined.
Disclaimer: This is for demonstration and educational purpose only. This is not buying or selling recommendations. I am not SEBI registered. Please consult your financial advisor before taking any trade.
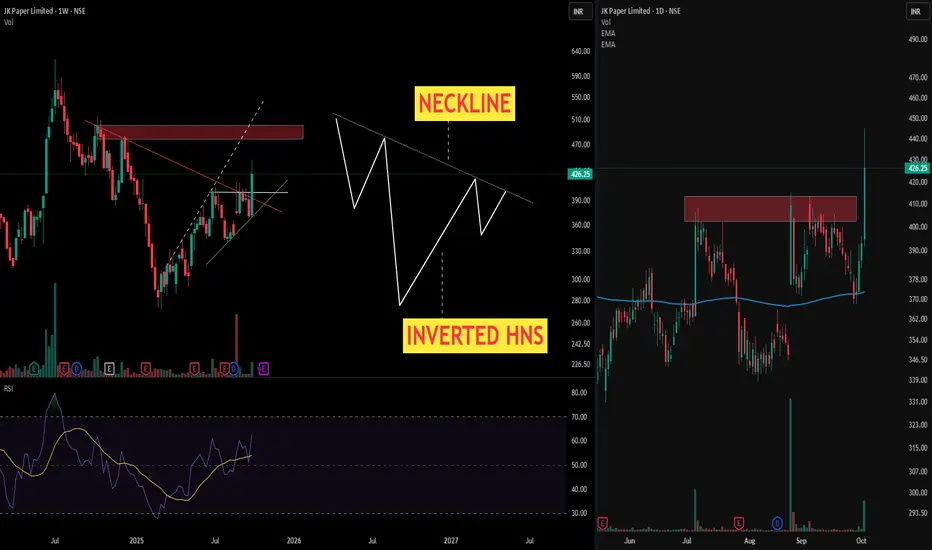
Inverted Head and Shoulders - Tale of a Bullish Reversal Pattern> Chart presents a textbook Inverted Head and Shoulders pattern on the weekly timeframe—one of the most reliable bullish reversal formations in technical analysis. This sophisticated pattern structure demonstrates the gradual shift from bearish exhaustion to bullish momentum, offering astute traders a high-probability setup.
> Anatomical Breakdown of the Pattern
- Left Shoulder: Initial decline to approximately ₹280 levels, followed by a relief rally—representing the first phase of selling pressure exhaustion
- Head: The decisive low zone forming the deepest trough—marking the capitulation point where maximum bearish sentiment peaks
- Right Shoulder: Higher low formation, demonstrating diminishing selling pressure and emerging buying interest
- Neckline: The critical resistance zone connecting the intermediate highs—serving as the pattern's confirmation level
> The Right side chart showcase the Daily time frame movement forclear outlook on Multi time frame basis .
Disclaimer: Technical analysis provides probability-based insights. Always implement proper risk management and consider multiple timeframe confirmations before executing trades.
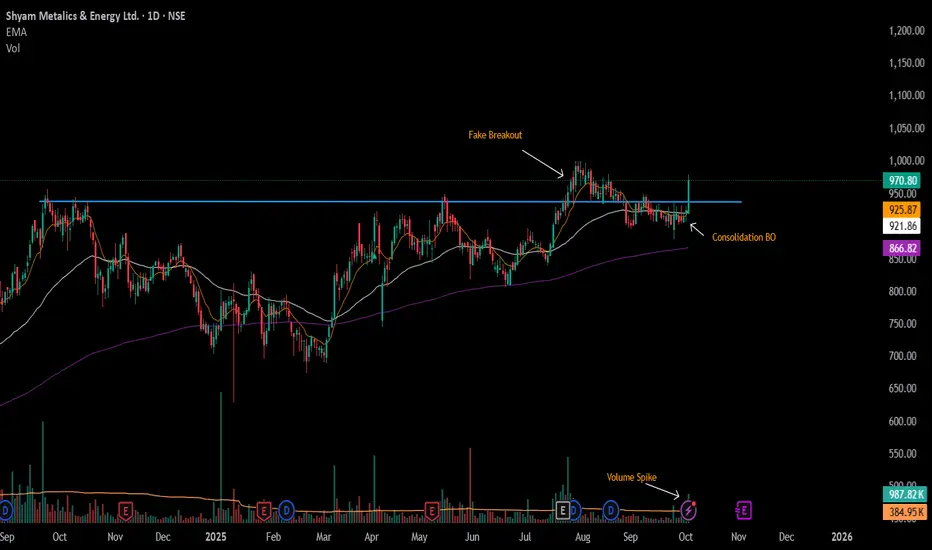
#SHYAMMETL - 2nd BreakOut in DTFScript: SHYAMMETL
Key highlights: 💡⚡
📈 VCP BreakOut in DTF which Failed
📈 2nd BreakOut in DTF after a short consolidation below Resistance
📈 Volume spike seen during Breakout.
📈 MACD Bounce
📈 Can go for a swing trade
⚠️ Important: Always Exit the trade before any Event.
⚠️ Important: Always maintain your Risk:Reward Ratio as 1:2, with this RR, you only need a 33% win rate to Breakeven.
✅Like and follow to never miss a new idea!✅
Disclaimer: I am not SEBI Registered Advisor. My posts are purely for training and educational purposes.
Eat🍜 Sleep😴 TradingView📈 Repeat 🔁
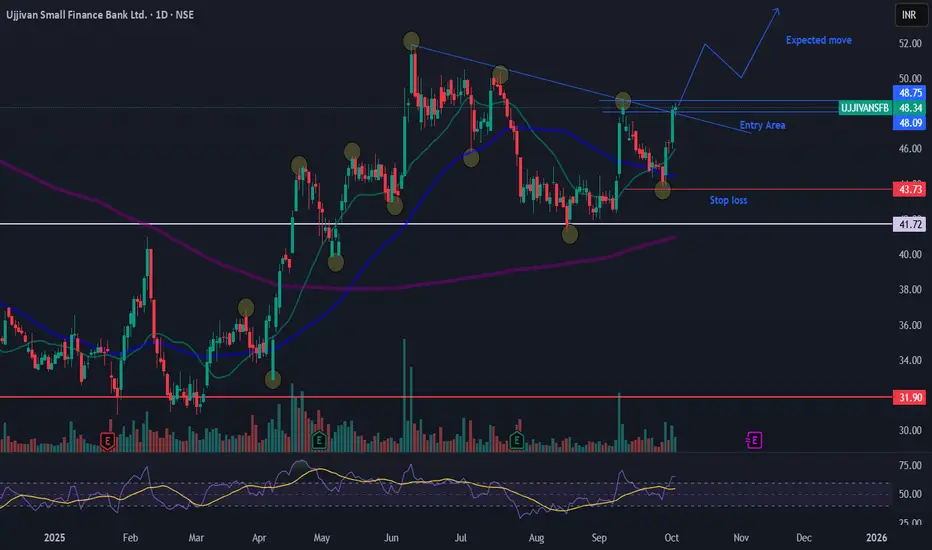
Ujjivan Small Finance Bank Ltd stage 2 continuation breakoutUjjivan Small Finance Bank Ltd stage 2 continuation breakout
Entry 48-49
SL 43.7
Only for journaling, not a trading/investing tip.
This post is for my personal use.
Note : only for learning, not a trading recommendation. i am posting as a trading journal for learning before and after breakout.
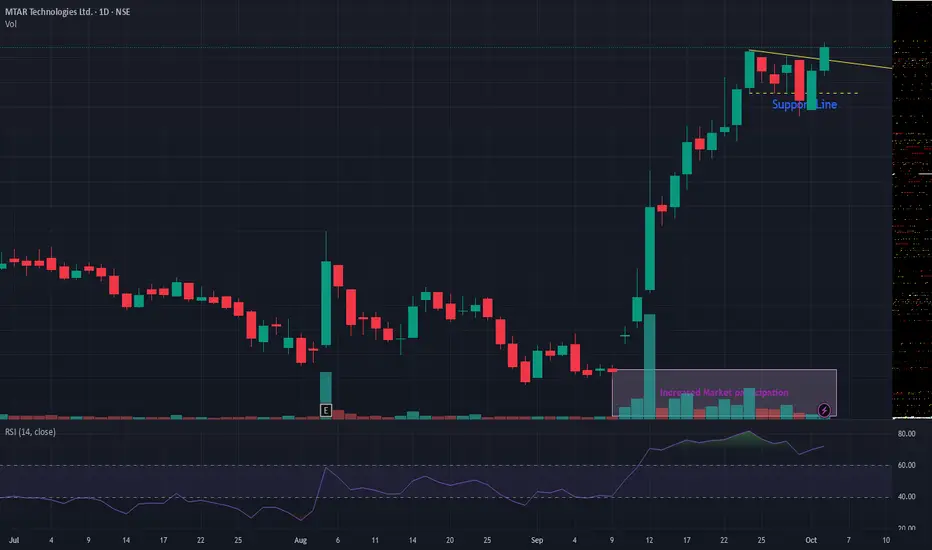
MTARTECHMTARTECH giving trend-line breakout. VCP breakout also observed. Volume too has spiked. As long as it is above support line, the stock seems attractive. Many defense stocks are showing strength and trying to give a run! Keep in your watchlist
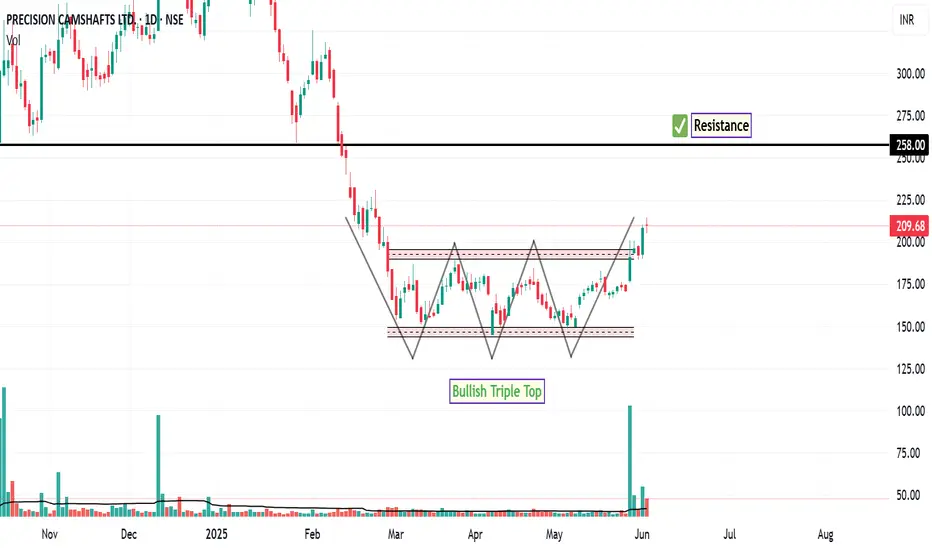
PRECAM: Next Level InsightThe daily chart of PRECAM is currently displaying a technically constructive setup. Notably, the price structure resembles a bullish triple top formation, which, in this context, appears to be acting as a continuation pattern rather than a reversal. This is further supported by a breakout above the recent consolidation range.
Importantly, this breakout has been accompanied by a noticeable increase in trading volume over the past five sessions, which may suggest growing market participation and interest in the stock at current levels.
Key technical indicators are aligned with this bullish momentum:
RSI is trading above the 70 mark , indicating strong upward momentum.
MACD is positioned above the zero line , with the signal line maintaining a positive crossover.
MACD Histogram remains in positive territory, reinforcing the prevailing bullish sentiment.
Based on this setup, the next potential area of price interest or resistance could emerge near the ₹258 level. On the downside, the immediate support lies just below the prior consolidation zone near ₹145 . A sustained move below this level could act as a technical invalidation point for short-term bullish setups and may prompt risk management actions.
Disclaimer:
This analysis is intended solely for informational and educational purposes. It does not constitute investment advice, a recommendation, or an offer to buy or sell any financial instrument. All investments carry risk, and past performance is not indicative of future results. Individuals should conduct their own due diligence or consult with a qualified financial advisor before making any investment decisions.
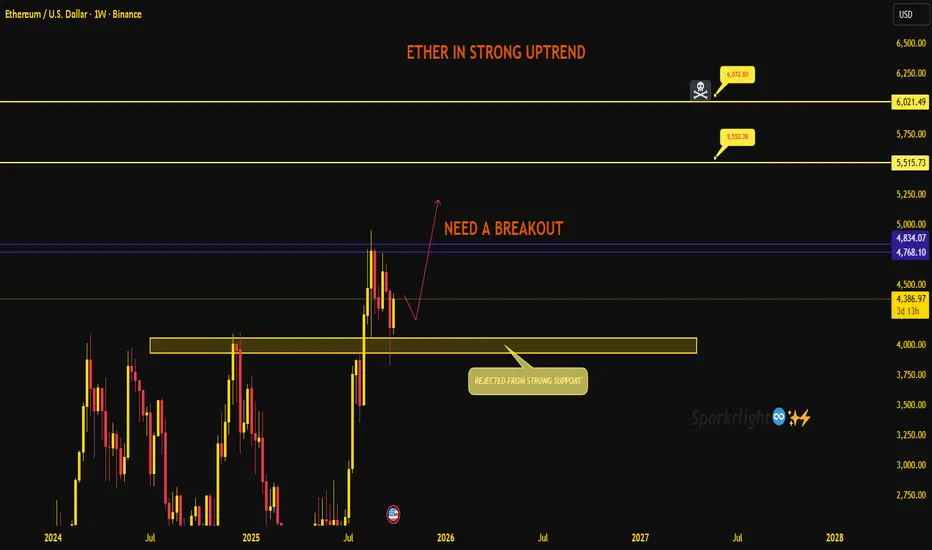
Ethereum – Strong Uptrend but Needs a Breakout!!Ether is still holding its strong uptrend, and the recent rejection from support has kept the bullish structure intact. The bigger picture remains positive, but short-term price action now demands a clear breakout to confirm continuation.
Current structure:
Price bounced cleanly from the 4000 zone, showing that buyers are defending the base.
The rally stalled just below the 4800–4850 resistance. This is the key barrier that needs to give way for the next leg higher.
Until then, we are stuck in a consolidation between strong support below and heavy resistance above.
Key levels to track:
Support: 4050–3950. As long as this zone holds, bulls keep the upper hand.
Breakout zone: 4768–4834. A weekly close above here should trigger momentum buyers.
Upside targets: 5515 → 5550, and if momentum extends, 6,000+.
Short-term view:
Ethereum is in a strong trend but needs that breakout above 4,800 to unlock the next wave higher. If buyers fail to push through, expect more back-and-forth action near support before another attempt.
The structure favors patience – wait for the breakout confirmation rather than chasing inside the range. Trade safe.
BUY TODAY SELL TOMORROW for 5%DON’T HAVE TIME TO MANAGE YOUR TRADES?
- Take BTST trades at 3:25 pm every day
- Try to exit by taking 4-7% profit of each trade
- SL can also be maintained as closing below the low of the breakout candle
Now, why do I prefer BTST over swing trades? The primary reason is that I have observed that 90% of the stocks give most of the movement in just 1-2 days and the rest of the time they either consolidate or fall
Round Bottom Breakout in PAUSHAKLTD
BUY TODAY SELL TOMORROW for 5%

How to Backtest, Create a Strategy and Execute a Trade In this video I have showed a good trade is executed with proper planning and mindset .
Charts Used in this video are older than 3 months . Only for educational content .

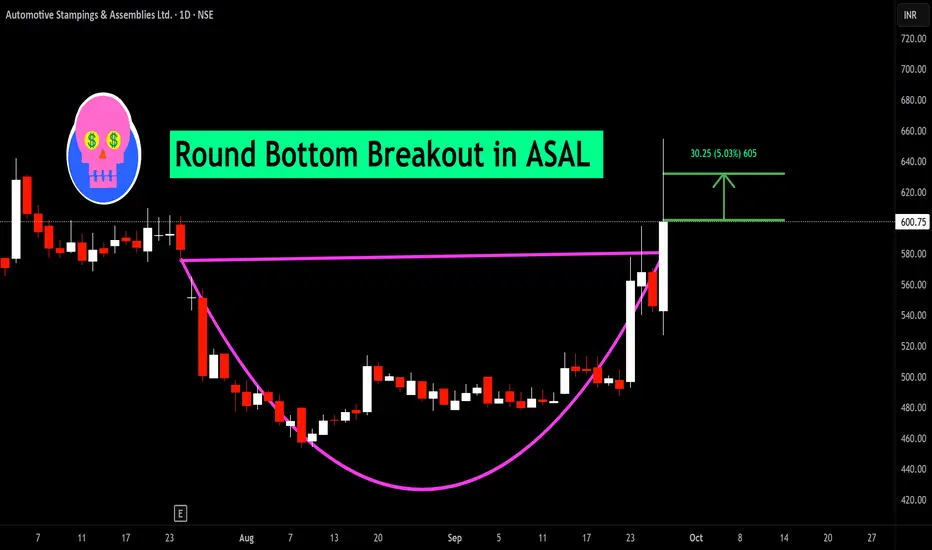
BUY TODAY SELL TOMORROW for 5%DON’T HAVE TIME TO MANAGE YOUR TRADES?
- Take BTST trades at 3:25 pm every day
- Try to exit by taking 4-7% profit of each trade
- SL can also be maintained as closing below the low of the breakout candle
Now, why do I prefer BTST over swing trades? The primary reason is that I have observed that 90% of the stocks give most of the movement in just 1-2 days and the rest of the time they either consolidate or fall
Round Bottom Breakout in ASAL
BUY TODAY SELL TOMORROW for 5%
Godawari Power And Ispat Limited - Breakout Setup, Move is ON...#GPIL trading above Resistance of 793
Next Resistance is at 1270
Support is at 497
Here is previous chart:
Chart is self explanatory. Levels of breakout, possible up-moves (where stock may find resistances) and support (close below which, setup will be invalidated) are clearly defined.
Disclaimer: This is for demonstration and educational purpose only. This is not buying or selling recommendations. I am not SEBI registered. Please consult your financial advisor before taking any trade.

Silver Bullish Breakout on Monthly & Weekly CharPattern Formed: Symmetrical Triangle (Long-Term Consolidation)
Breakout Type: Bullish Breakout on Monthly & Weekly Chart
Volume Confirmation: Strength in breakout with price expansion
Measured Move Target: ~$44 (based on triangle height projection)
Immediate Resistance Zone: $44.11 (Historical supply zone)
Support Levels Post-Breakout:
Immediate Support: $34.78
Strong Support: $33.28

How to Spot Trend Changes Using Simple Market StructureMastering Market Structure: Where to Find the Best Trading Setups in line with simple observation done using Price action .

BUY TODAY SELL TOMORROW for 5%DON’T HAVE TIME TO MANAGE YOUR TRADES?
- Take BTST trades at 3:25 pm every day
- Try to exit by taking 4-7% profit of each trade
- SL can also be maintained as closing below the low of the breakout candle
Now, why do I prefer BTST over swing trades? The primary reason is that I have observed that 90% of the stocks give most of the movement in just 1-2 days and the rest of the time they either consolidate or fall
Cup and Handle Breakout in DIXON
BUY TODAY SELL TOMORROW for 5%

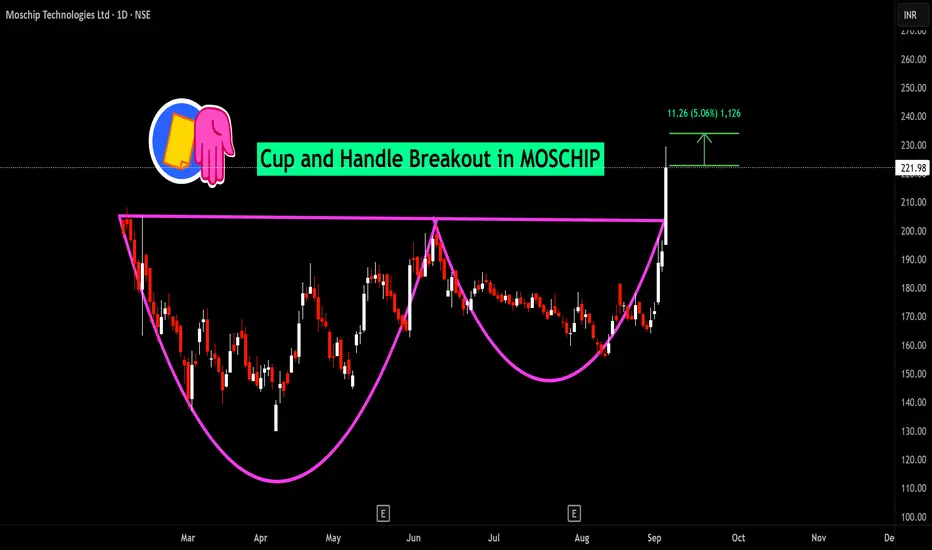
BUY TODAY SELL TOMORROW for 5%DON’T HAVE TIME TO MANAGE YOUR TRADES?
- Take BTST trades at 3:25 pm every day
- Try to exit by taking 4-7% profit of each trade
- SL can also be maintained as closing below the low of the breakout candle
Now, why do I prefer BTST over swing trades? The primary reason is that I have observed that 90% of the stocks give most of the movement in just 1-2 days and the rest of the time they either consolidate or fall
Cup and Handle Breakout in MOSCHIP
BUY TODAY SELL TOMORROW for 5%
BUY TODAY SELL TOMORROW for 5%DON’T HAVE TIME TO MANAGE YOUR TRADES?
- Take BTST trades at 3:25 pm every day
- Try to exit by taking 4-7% profit of each trade
- SL can also be maintained as closing below the low of the breakout candle
Now, why do I prefer BTST over swing trades? The primary reason is that I have observed that 90% of the stocks give most of the movement in just 1-2 days and the rest of the time they either consolidate or fall
Trendline Breakout in GMDCLTD
BUY TODAY SELL TOMORROW for 5%

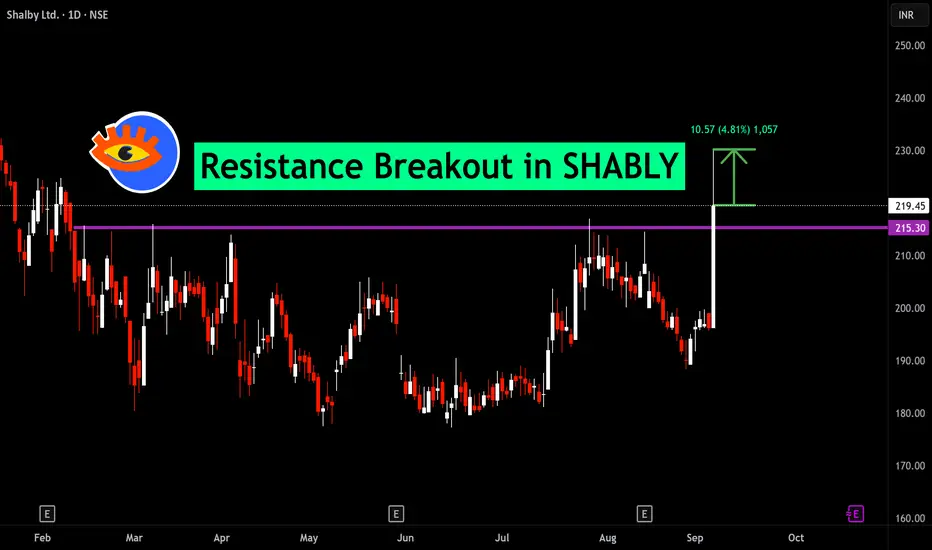
BUY TODAY SELL TOMORROW for 5%DON’T HAVE TIME TO MANAGE YOUR TRADES?
- Take BTST trades at 3:25 pm every day
- Try to exit by taking 4-7% profit of each trade
- SL can also be maintained as closing below the low of the breakout candle
Now, why do I prefer BTST over swing trades? The primary reason is that I have observed that 90% of the stocks give most of the movement in just 1-2 days and the rest of the time they either consolidate or fall
Resistance Breakout in SHABLY
BUY TODAY SELL TOMORROW for 5%