MTAR Technologies Ltd.MTAR Technologies is showing a powerful earnings breakout, with Q4 FY26 revenue up 67% YoY to about ₹306 crore and PAT up 222% YoY to about ₹44 crore, while FY26 revenue rose to about ₹876 crore and FY26 PAT to about ₹94 crore. Management has also turned more constructive on FY27, raising revenue g
MTAR Technologies Ltd.
No trades
Last report date
May 12, 2026
Report period
Q4 2025
EPS
14.40 INR
Revenue
3.06 B INR
30.55 INR
940.30 M INR
8.76 B INR
21.38 M
About MTAR Technologies Ltd.
Sector
Industry
CEO
Parvat Srinivas Reddy
Website
Headquarters
Hyderabad
Founded
1970
IPO date
Mar 15, 2021
Identifiers
2
ISIN INE864I01014
MTAR Technologies Ltd. provides precision engineering solutions. It engages in the manufacturing and development of mission critical precision components with close tolerances and critical assemblies catering to nuclear, space, defense and clean energy sectors. The company was founded by P. Ravindra Reddy, K. Satyanarayana Reddy, and P. Jayaprakash Reddy in 1970 and is headquartered in Hyderabad, India.
Related stocks
MTAR Technologies Ltd - Breakout Setup, Move is ON...#MTARTECH trading above Resistance of 7044
Next Resistance is at 9896
Support is at 4838
Here are previous charts:
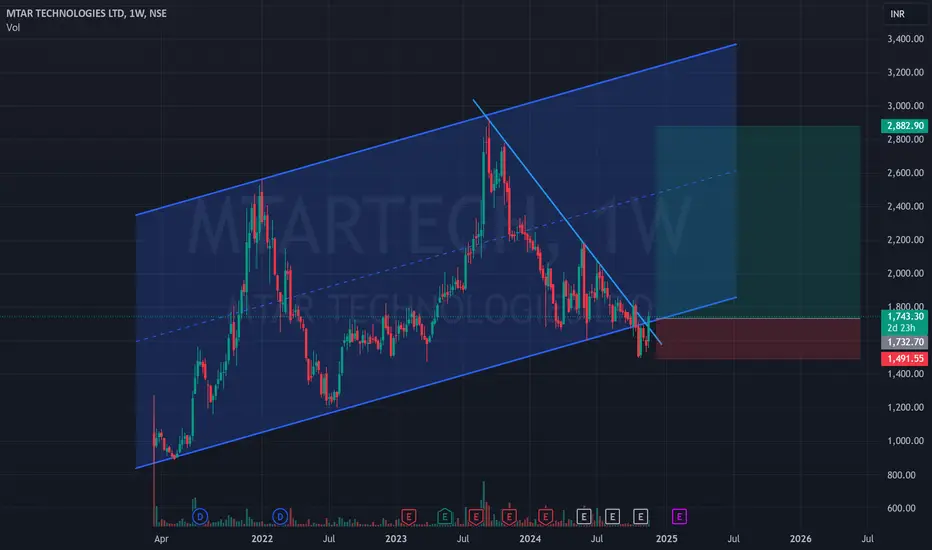
The Parallel channel is a powerful chart pattern that combines several forms of technical analysis to provide traders with potential points for entering and exiting trades
#MTARTECH1. Price Action: The "Vertical" Move
Parabolic Run: The stock has surged from approximately 3,500 to 6,457.10 in just a few weeks. The current weekly candle is exceptionally large, showing a +25.64% gain, which indicates massive institutional buying.
Blue Sky Territory: The stock is at an All-Time
BUY TODAY SELL TOMORROW for 5%DON’T HAVE TIME TO MANAGE YOUR TRADES?
- Take BTST trades at 3:25 pm every day
- Try to exit by taking 4-7% profit of each trade
- SL can also be maintained as closing below the low of the breakout candle
Now, why do I prefer BTST over swing trades? The primary reason is that I have observed that
MTARTECH 1 Week Time Frame 📊 Current Price Snapshot
MTAR Technologies closed around ₹2,931–₹2,932 recently.
📈 Weekly Pivot & Support/Resistance Levels
(Important zones likely to act as reference over ~1 week)
🔹 Pivot Levels
These are calculated based on recent price activity and help gauge short-term bias:
Central Pivot
MTAR Tech – Monthly Chart View (Breakout Note)MTAR Tech – Monthly Chart View (Breakout Note) 📈
MTRA Tech has moved out of its horizontal consolidation channel on the monthly timeframe, indicating a potential trend reversal / fresh bullish phase.
✅ Key Highlight:
Horizontal range breakout confirmed on monthly chart
Volume expansion during br
See all ideas
Summarizing what the indicators are suggesting.
Neutral
SellBuy
Strong sellStrong buy
Strong sellSellNeutralBuyStrong buy
Neutral
SellBuy
Strong sellStrong buy
Strong sellSellNeutralBuyStrong buy
Neutral
SellBuy
Strong sellStrong buy
Strong sellSellNeutralBuyStrong buy
An aggregate view of professional's ratings.
Neutral
SellBuy
Strong sellStrong buy
Strong sellSellNeutralBuyStrong buy
Neutral
SellBuy
Strong sellStrong buy
Strong sellSellNeutralBuyStrong buy
Neutral
SellBuy
Strong sellStrong buy
Strong sellSellNeutralBuyStrong buy
Displays a symbol's price movements over previous years to identify recurring trends.
Weight 4.06%
Market value 5.86 M
Weight 0.07%
Market value 386.02 K
Weight 4.30%
Market value 346.10 K
Explore more ETFs
Frequently asked questions
The current price of MTARTECH is 7,158.00 INR — it has increased by 3.49% in the past 24 hours. Watch MTAR Technologies Ltd. stock price performance more closely on the chart.
Depending on the exchange, the stock ticker may vary. For instance, on NSE exchange MTAR Technologies Ltd. stocks are traded under the ticker MTARTECH.
MTARTECH stock has risen by 13.68% compared to the previous week, the month change is a 45.11% rise, over the last year MTAR Technologies Ltd. has showed a 337.26% increase.
We've gathered analysts' opinions on MTAR Technologies Ltd. future price: according to them, MTARTECH price has a max estimate of 10,007.00 INR and a min estimate of 7,995.00 INR. Watch MTARTECH chart and read a more detailed MTAR Technologies Ltd. stock forecast: see what analysts think of MTAR Technologies Ltd. and suggest that you do with its stocks.
MTARTECH reached its all-time high on May 14, 2026 with the price of 7,730.00 INR, and its all-time low was 860.00 INR and was reached on Mar 19, 2021. View more price dynamics on MTARTECH chart.
See other stocks reaching their highest and lowest prices.
MTARTECH stock is 7.01% volatile and has beta coefficient of 1.86. Track MTAR Technologies Ltd. stock price on the chart and check out the list of the most volatile stocks — is MTAR Technologies Ltd. there?
Today MTAR Technologies Ltd. has the market capitalization of 209.49 B, it has increased by 13.83% over the last week.
Yes, you can track MTAR Technologies Ltd. financials in yearly and quarterly reports right on TradingView.
MTAR Technologies Ltd. is going to release the next earnings report on Aug 11, 2026. Keep track of upcoming events with our Earnings Calendar.
MTARTECH net income for the last quarter is 442.83 M INR, while the quarter before that showed 346.89 M INR of net income which accounts for 0.00% change. Track more MTAR Technologies Ltd. financial stats to get the full picture.
MTAR Technologies Ltd. dividend yield was 0.00% in 2025, and payout ratio reached 0.00%. The year before the numbers were 0.00% and 0.00% correspondingly. See high-dividend stocks and find more opportunities for your portfolio.
EBITDA measures a company's operating performance, its growth signifies an improvement in the efficiency of a company. MTAR Technologies Ltd. EBITDA is 1.71 B INR, and current EBITDA margin is 19.54%. See more stats in MTAR Technologies Ltd. financial statements.
Like other stocks, MTARTECH shares are traded on stock exchanges, e.g. Nasdaq, Nyse, Euronext, and the easiest way to buy them is through an online stock broker. To do this, you need to open an account and follow a broker's procedures, then start trading. You can trade MTAR Technologies Ltd. stock right from TradingView charts — choose your broker and connect to your account.
Investing in stocks requires a comprehensive research: you should carefully study all the available data, e.g. company's financials, related news, and its technical analysis. So MTAR Technologies Ltd. technincal analysis shows the buy rating today, and its 1 week rating is buy. Since market conditions are prone to changes, it's worth looking a bit further into the future — according to the 1 month rating MTAR Technologies Ltd. stock shows the buy signal. See more of MTAR Technologies Ltd. technicals for a more comprehensive analysis.
If you're still not sure, try looking for inspiration in our curated watchlists.