Gold at Make-or-Break Zone – Will Sellers Strike Back?Gold is staging a rebound, but don't let it fool you — the real battle is just ahead.
After last week's sharp drop, the price is now approaching a key resistance near 3,355, where the 34 and 89 EMAs meet a supply zone. This is not just any level — it's the perfect spot for sellers to step in.
Meanwhile, markets are bracing for high-impact US data this week, including Core PCE and Q1 GDP. If inflation runs hot, it could crush gold’s momentum and fuel another leg down.
If rejection happens here, gold could drop back toward the 3,265 zone. Bulls need a breakout to regain control — but right now, the edge leans bearish.
Are you ready for the next move?
Breakout

EUR/USD Stuck in a Box – Breakout or Breakdown Ahead?EUR/USD is currently moving sideways within a narrow range around 1.1700–1.1750, as traders await key economic data from both the US and the Eurozone. The chart reflects a consolidation phase, with repeated resistance tests but no clear breakout yet.
This week, the euro remains under pressure after the ECB delivered a more dovish tone than expected, reinforcing the view that interest rates in the euro area may stay unchanged for longer. Although inflation data has stabilized, the euro’s recovery momentum has stalled.
Looking ahead, EUR/USD must break above the 1.1740 resistance zone to resume its longer-term bullish trend. Otherwise, the bearish pullback scenario, as outlined in the chart, could come into play.
What’s your take — will we see a breakout, or is a correction coming first? 📉📈
Share your view in the comments!

Update the latest gold price todayGold kicks off the new week with a sharp drop, sliding to around $3,258/oz, down more than $14 from Friday’s close. The primary driver behind this decline is the easing geopolitical tension in the Middle East, following a ceasefire agreement between Israel and Iran, which has significantly reduced demand for safe-haven assets.
In addition, stubborn inflation and weak global growth are forcing central banks — especially the Federal Reserve — to keep interest rates elevated for longer. This policy stance continues to pressure gold prices.
From my perspective, gold had surged too quickly in recent weeks due to geopolitical risks. Now that those tensions have calmed, capital is flowing out of gold and rotating into risk-on assets like stocks, bonds, and real estate.
Looking ahead, this week brings a wave of high-impact economic data from the US, Eurozone, China, and Japan — including the June PMIs from the US and China, and preliminary CPI from the Eurozone. These releases are likely to shape gold’s short-term direction.
For now, the bearish bias remains, with $3,300 acting as a key resistance level to watch.

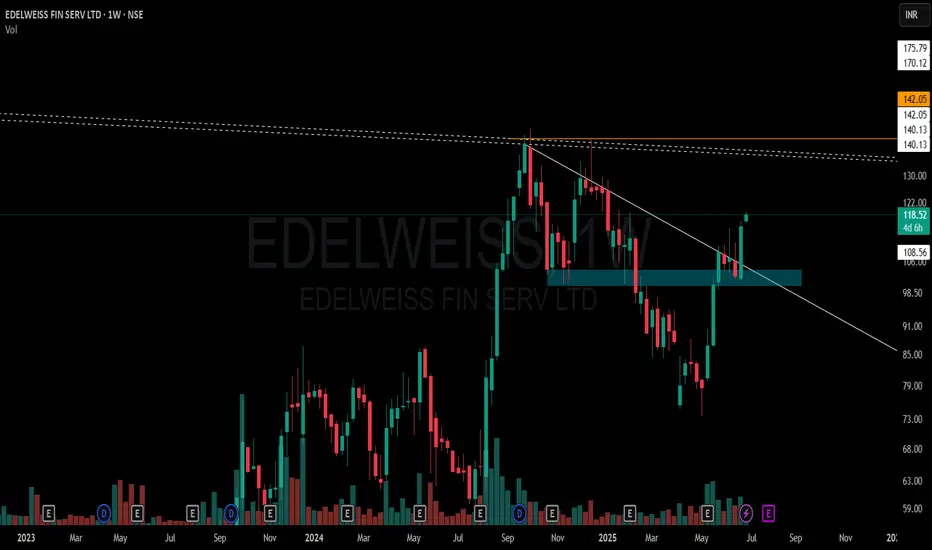
EDELWEISS FIN SERV LTD – Weekly Structure A few key observations on this weekly chart without any forecast bias:
🔹 White Solid Trendline – Marks the active CT (counter-trend) level which has now been decisively taken out.
🔹 Blue Zone – A previously tested supply and demand area has been regained and price is now sustaining above it.
🔹 White Dotted Lines – Multiple short-term weekly hindrances lie just above, acting as micro-resistances.
🔹 Orange Line – Reflects multi-timeframe level confluence and a known volume cluster region to watch ahead.
🔹 Volume has seen a healthy pickup during this breakout, suggesting participation.
📌 Not a recommendation. Just sharing chart structure and price behavior.
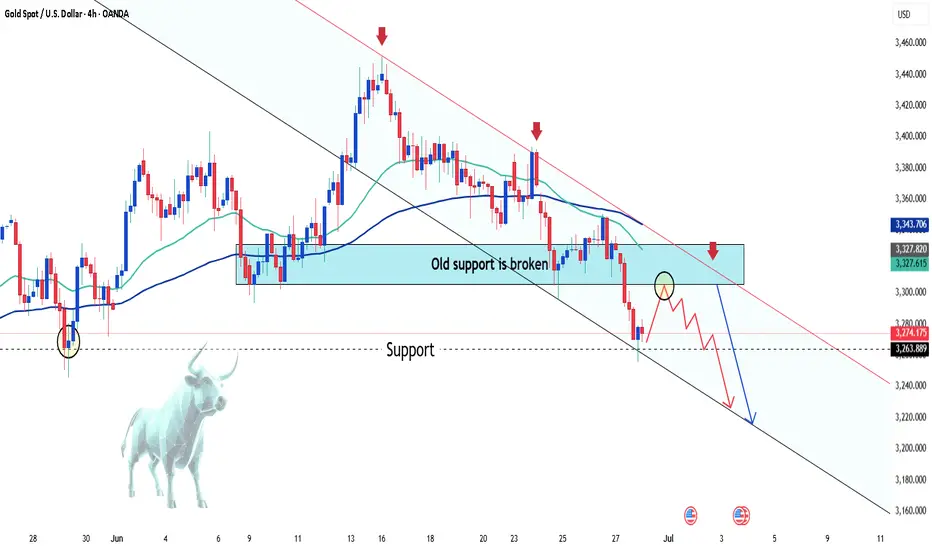
Gold in Free Fall – Is This Just the Beginning?Hey fellow traders!
Today, gold is taking a serious dive — price has crashed below the critical $3,300 support, and things aren't looking great for the bulls. The chart says it all: the old support zone has been wiped out, and the recent minor bounce? Just the calm before a deeper selloff.
💣 What’s dragging gold down?
-The reasons are crystal clear:
-US Treasury yields are spiking, pulling capital away from gold.
-The US dollar is rebounding strongly, boosted by hawkish Fed commentary.
Global markets are optimistic, with geopolitical tensions easing — which means gold is losing its safe-haven appeal.
In short: there's not much left to keep gold afloat right now.
📉 Technical outlook – Breaking down and breaking lower?
On the H4 chart, gold has officially lost the EMA 34 (~$3,322) — a key dynamic support that's held multiple times in the past. With that breach, sellers rushed in. Price is now sliding toward the bottom of the descending channel, targeting $3,240, and possibly $3,200 if bearish momentum continues.
And if gold pulls back to retest the broken zone? Don’t celebrate too soon — it could be the perfect trap for sellers to reload.
So, what’s your take?
HINDCOPPER | Supply-Demand Flip & Structure This chart shows a clean structural shift on the weekly timeframe for Hindustan Copper Ltd (NSE: HINDCOPPER):
🔷 Blue Zone: A key Supply-to-Demand Flip area. Price reacted strongly from this zone after multiple touches, showing its relevance.
📉 CT Line (Compression Trendline): Price was getting compressed under this trendline. It's now visibly breached.
➡️ Arrow Zone: Highlights a smaller supply-demand zone, formed after consolidation and breakout. Marked for structural clarity.
Volume also shows higher activity during this move, indicating strength behind the recent price action.

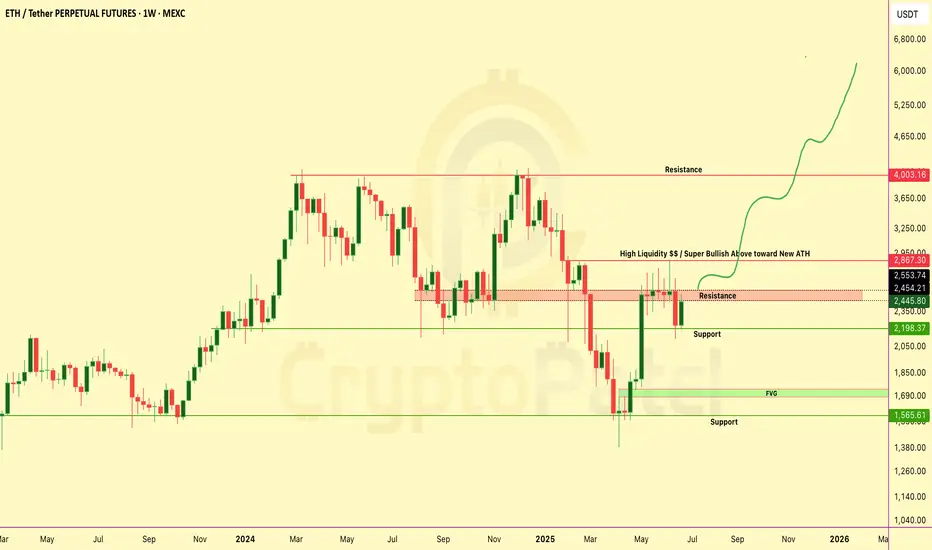
ETHEREUM Weekly Chart Breakdown – Massive Move Loading?ETHEREUM Weekly Chart Breakdown – Massive Move Loading?
ETH just pumped +9.9% this week... but it’s what comes next that really matters 👇
Key Resistance Wall → $2,867
🔹 This zone is packed with liquidity traps and past rejections.
🔹 Break this level = Unlocks ATH push toward $4K–$6K-$10k
Why This Chart Matters:
✅ Bullish structure reclaim
✅ Targeting “High Liquidity” zone above
✅ Possible parabolic rally if breakout confirms
Dips = Opportunities
If ETH dips from here... don’t panic.
→ Every dip = fresh accumulation zone
→ Below $2,000 = golden buy zone for long-term bulls
Liquidity Zone Break it = ATH rally incoming
Reject it = Buy the dip and ride the next wave
Comment & tag a friend who needs this alpha!
NFA & Dyor
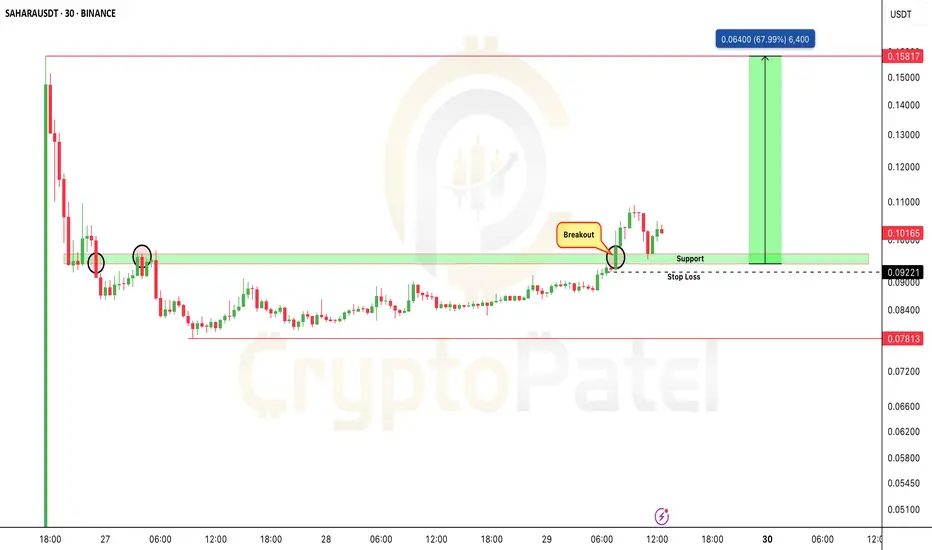
$SAHARA is at a critical level BSE:SAHARA is at a critical level
If the $0.09 support holds, a 60% upside is on the table.
But if it fails to hold $0.095… We could be looking at new lows.
This support zone decides the next big move.
Keep it on your radar
Retweet if you're watching
How I Read Price Action Like a Pro (Most Miss This Step)The REAL Way to Read Price Action — No Indicators, Just Logic
I make educational content videos for swing trading .

Laurus Labs Limited - Breakout Setup, Move is ON...#LAURUSLABS trading above Resistance of 553
Next Resistance is at 699
Support is at 420
Here are previous charts:
Chart is self explanatory. Levels of breakout, possible up-moves (where stock may find resistances) and support (close below which, setup will be invalidated) are clearly defined.
Disclaimer: This is for demonstration and educational purpose only. This is not buying or selling recommendations. I am not SEBI registered. Please consult your financial advisor before taking any trade.

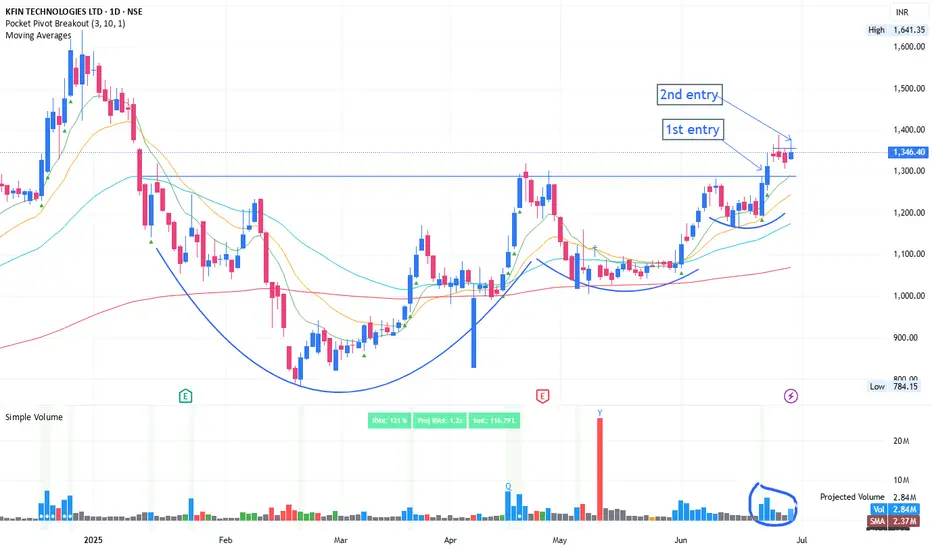
Volatility contraction, breakout and tightnessKFINTECH: Recent breakout which was marked as 1st entry. It is the safest entry, good thing is, post breakout it is forming tightness in price. This acts like spring. Once it bounce from this level, then there are high chance of blasted move.
2nd entry could be above the tightness breakout with 200-300x RVOL during early starting of trading session. This could give huge intraday returns and good topup over existing position
Stay connected for upcoming development and notes.
Disclaimer:
The information provided herein is for educational and informational purposes only and should not be construed as investment advice. The stock analysis and recommendations are based on publicly available information, data sources believed to be reliable, and our interpretation at the time of writing.
Investing in equities involves risks, including the risk of loss of capital. Past performance is not indicative of future results. Readers and investors are advised to conduct their own research or consult a qualified financial advisor before making any investment decisions.
The author(s), affiliates, or associated entities may hold positions in the stocks mentioned, and such positions are subject to change without notice.
We do not guarantee the accuracy, completeness, or timeliness of any information presented, and we disclaim any liability for financial losses or damages resulting from the use of this content.
EURUSD Bulls in Charge – Can They Push Higher?EURUSD continues to demonstrate strength, maintaining a clear uptrend on the H4 timeframe. After breaking above the former resistance zone near 1.1600, price surged and is now consolidating around 1.1706. This breakout confirms strong bullish momentum, especially following a long period of consolidation.
That said, the area around 1.1730–1.1740 is showing signs of minor rejection, with a potential double-top pattern emerging. However, this appears to be a healthy pullback within the broader bullish trend.
The most reliable support is currently found at 1.1620, which also aligns with the EMA 34 — a dynamic level that has acted as a pivot throughout this rally.
As long as price remains above 1.1620, the bullish trend remains firmly intact.

Gold Pullback in Play – Will $3,300 Be Hit Today?Hello traders!
What’s your take on gold today?
OANDA:XAUUSD remains tilted to the downside, currently trading around $3,318, down over 100 pips on the day.
The bearish bias is still favored — and the reason is pretty clear. For short-term traders using pattern-based setups, gold has broken out of a flag pattern and successfully retested the breakout zone, confirming a potential reversal.
If this momentum holds, the next target could be $3,300 by the end of the day.
Do you agree with this scenario?

Tata steel cup Handle breakoutTata steel cup and handle breakout and the price is near resistance also with support coming close to the resistance suggesting possible breakout.
Buy around - 160
Target - 180 (13%)
Duration - 1 month
Tata steel have good fundamentals and showing breakout possibility

Weekly CT & Hiddenline Cracked – Supply/Demand Zones In PlayThis weekly chart shows a well-defined price structure shaped around multi-timeframe supply and demand dynamics:
🟩 Green Zone – Broad demand zone, price has respected this area multiple times recently.
🟥 Red Zone – Long-standing WTF supply zone, tested multiple times in the past.
⚪️ White Solid Line – Active CT (corrective trendline), which has been broken cleanly on this week’s candle. Being a weekly close (Friday), the breakout carries more weight.
⚪️ Dotted White Line – A hidden resistance trendline, possibly acting as a confluence level for prior rejections. That too has been convincingly breached.
📊 Notice the strong volume spike on the breakout – always worth watching in a structure like this.
🔁 No predictions. Not a call. Just chart structure and context.

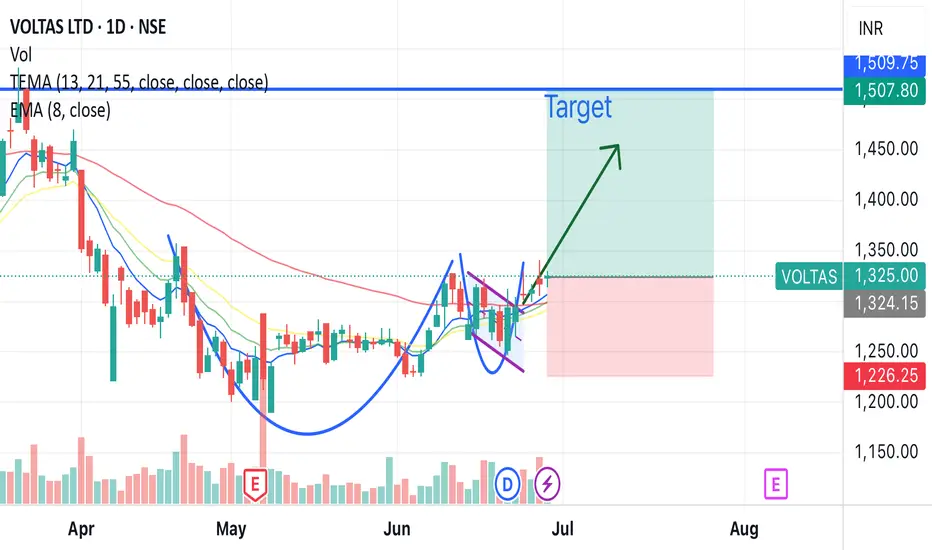
Voltas breakout soon cup and handle patternVoltas will soon be flying, cup and handle breakout pattern, pattern is very prominent, high chances of breakout in short term 15% profit.
Also reaching golden crossover
Buying range - 1310 - 1330
Target - 1507 (15%)
Hold duration - 1-2 month
Voltas belongs to Tata groups and have good fundamentals.
EURUSD Breaks Free – Is the Rally Just Beginning?After several days of bearish expectations, EURUSD has finally regained its bullish momentum. The pair surged sharply, breaking out of the descending channel and climbing from 1.146 to 1.162 at the time of writing.
The current resistance zone is being tested, yet buyers remain supported by strong technical factors, notably the stability of EMA 34 and 89.
On the fundamental side, expectations that the Fed will keep interest rates steady—reinforced by dovish remarks from Chair Powell before Congress—alongside a weakening USD due to easing geopolitical tensions and reduced euro-hedging by European funds, have fueled fresh demand for the euro.
What about you—do you think EURUSD will continue to rise or pull back from here?

Titan | Swing | Breakout Titan has just given a clean trendline breakout followed by a successful retest, which makes this setup quite interesting from a positional swing trade perspective.
✅ Trendline Breakout
• The stock broke a strong descending trendline that had been acting as resistance for several months.
✅ Retest and Bounce
• After the breakout, Titan came back to retest the breakout level near ₹3,380, which held well — a classic bullish sign. This bounce happened around the 38.2% Fibonacci retracement zone — another technical confluence that adds weight to the trade idea.
⸻
📈 Entry, Targets & Stop Loss
• Entry Zone: Around ₹3,665 – ₹3,695
• Stop Loss (SL): Below ₹3,202
Important note: If price breaks below ₹3,500 without RSI crossing 75, it might lead to negative RSI divergence — a warning of weakening momentum. In that case, better to exit to avoid capital getting stuck.
⸻
🎯 Targets Based on Fibonacci Extensions:
• Target 1: ₹4,123
• Target 2: ₹4,324
• Target 3: ₹4,580
These targets are calculated using Fibonacci extension levels, with the final one being the 1.618 golden ratio zone.
⸻
Disclaimer: Do your own analysis before putting money in investment. Idea is for education purpose to share and learn within trading view community. Not a suggestion to put your hard earn money.

Nuvama Wealth: Breakout at 7660Nuvama Wealth: Breakout at 7660. CMP 7880.
Resistance at 7960
Support at 7300

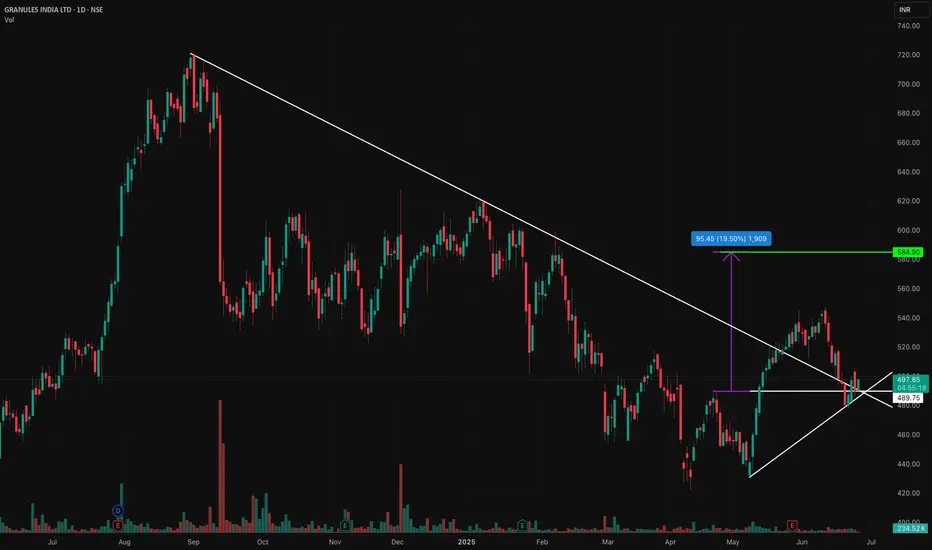
Granules - Double Bottom Breakout Double Bottom Breakout and Retest Done
Buy @ 495-497
SL 475
Target - 585
Resistance Trendline Breakout as well !!
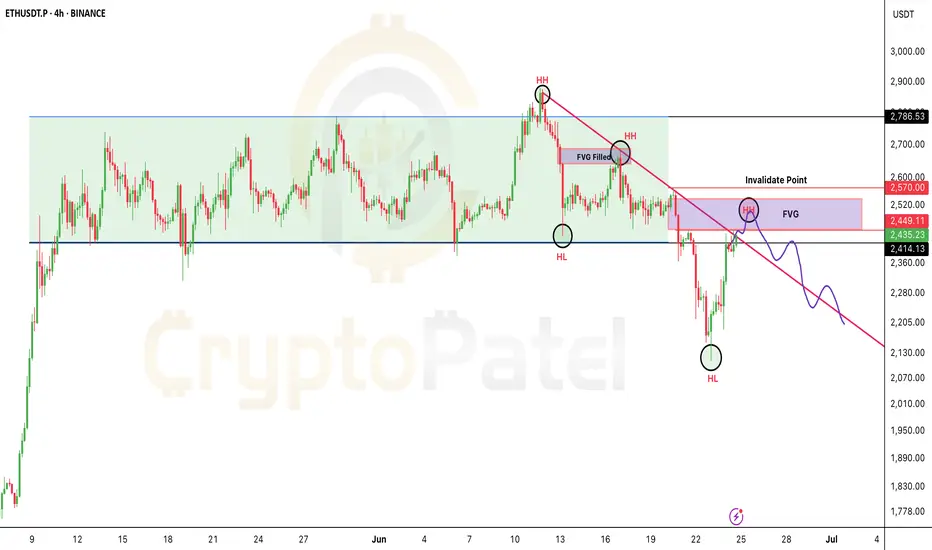
If you're shorting Ethereum, watch $2570 closely.If you're shorting Ethereum, watch $2570 closely.
If a candle closes above $2570, that invalidates the short — time to exit.
Why?
Because above this level, the risk/reward flips against you.
Better to wait for a cleaner entry with less risk, more reward.
Target: $2000
Retweet if this helps your trade plan.
NFA & DYOR
Midhani: Breaks Out of Consolidation: Ready for Lift-Off ?NSE:MIDHANI Breaks Out of Consolidation: A Technical Powerhouse Ready for Lift-Off ?
Price Action Analysis:
- Current Price: ₹463.60 (as of June 23, 2025)
- Price Movement: +20.30 points (+4.58%) on the day
- The stock has demonstrated a spectacular breakout from a lengthy consolidation phase
- Sharp vertical surge from ₹340 levels to current highs of ₹463.60
- Strong momentum evident with substantial volume expansion
Volume Spread Analysis:
- Current Volume: 6.03M shares (significantly elevated)
- Average Volume: 2.36M shares
- Volume surge of approximately 155% above average indicates strong institutional participation
- Volume spike during breakout confirms genuine buying interest
- The previous consolidation period showed declining volume, typical of accumulation phases
Key Technical Levels:
Base Formation:
- Primary Base: ₹220-₹340 range (March 2025 to May 2025)
- Base Duration: Approximately 3 months
- Base Type: Cup and Handle pattern with rectangular consolidation
- Base Depth: From ₹463 high to ₹220 low (52.5% correction)
- Quality: High-quality base with proper volume characteristics
Support Levels:
- Immediate Support: ₹420-₹440 (previous resistance turned support)
- Secondary Support: ₹380-₹400 (50% retracement of recent move)
- Major Support: ₹340-₹360 (breakout point and upper base boundary)
- Ultimate Support: ₹280-₹300 (middle of base formation)
Resistance Levels:
- Immediate Resistance: ₹480-₹500 (psychological round numbers)
- Next Resistance: ₹520-₹540 (measured move from base)
- Major Resistance: ₹580-₹600 (long-term projection target)
Technical Patterns Identified:
Primary Pattern:
- Cup and Handle Formation: Completed with successful breakout
- Handle Formation: Tight consolidation between ₹320-₹340 levels
- Breakout Volume: Exceptional with 155% above average volume
Secondary Patterns:
- Ascending Triangle: Formed during the handle phase
- Flag Pattern: Brief consolidation after initial breakout surge
- Higher Lows: Consistent pattern throughout base formation
Trend Analysis:
- Primary Trend: Strongly Bullish (breakout confirmed)
- Intermediate Trend: Bullish momentum accelerating
- Short-term Trend: Overbought but maintaining strength
Trade Setup and Strategy:
Entry Levels:
- Aggressive Entry: ₹445-₹460 (current levels on minor pullbacks)
- Conservative Entry: ₹420-₹440 (on deeper retracement to support)
- Breakout Entry: ₹350-₹360 (for those who missed the initial move)
Exit Levels:
- Target 1: ₹500 (near-term psychological resistance)
- Target 2: ₹540 (measured move from base)
- Target 3: ₹600 (extended target based on base width)
Stop-Loss Strategy:
- Tight Stop: ₹420 (for aggressive entries)
- Standard Stop: ₹380 (below key support zone)
- Conservative Stop: ₹340 (below breakout point)
Position Sizing and Risk Management:
Position Sizing Guidelines:
- Conservative Allocation: 2-3% of portfolio
- Moderate Allocation: 3-5% of portfolio
- Aggressive Allocation: 5-7% of portfolio (for high-risk tolerance)
Risk Management Framework:
- Maximum Risk per Trade: 2% of total capital
- Risk-Reward Ratio: Minimum 1:3 for all entries
- Scaling Strategy: Add positions on pullbacks to support levels
- Profit Booking: Book 30% at Target 1, 40% at Target 2, 30% at Target 3
Portfolio Considerations:
- Sector Allocation: Limit defence/aerospace exposure to 10-15% of portfolio
- Correlation Risk: Monitor other defence stocks for overexposure
- Market Timing: Consider broader market conditions before position sizing
Sectoral and Fundamental Backdrop:
Defence and Aerospace Sector Overview:
- India's defence budget targeting ₹1.75 lakh crore turnover by 2025
- The government focus on Atmanirbharta (self-reliance) in defence manufacturing
- The global aerospace and defence market is showing a strong growth trajectory
- Space economy growing at 7.4% year-over-year globally
Company Fundamentals:
- Market Cap: ₹8,693 crore
- Revenue: ₹1,074 crore (FY2025)
- Net Profit: ₹110 crore with 21.28% growth in Q4 FY2025
- Promoter Holding: 74% (strong management confidence)
- Specialisation: High-grade alloys, aerospace materials, defence components
Recent Developments:
- Strong presence at Aero India 2025 with indigenous aerospace materials
- Launch of High-Temperature Nickel Alloy Billets and Superni 41 Plates
- Strategic partnerships with HAL, GTRE, ADA, and the Indian Air Force
- Focus on critical materials for defence and aerospace applications
Industry Catalysts:
- Increasing defence procurement by the Indian government
- Export opportunities in aerospace components
- Technological advancement in the space and defence sectors
- The government push for indigenous manufacturing capabilities
Risk Factors and Considerations:
Technical Risks:
- Overbought conditions in the near term may lead to consolidation
- High volatility expected due to recent breakout
- Potential for profit booking at psychological resistance levels
Fundamental Risks:
- Dependence on government orders and policy changes
- Competition from private sector players
- Raw material cost fluctuations
- Execution risks in scaling up production
Market Risks:
- Broader market correction could impact momentum
- Sector rotation away from defence stocks
- Geopolitical factors affecting defence spending
- Interest rate environment impacting valuations
My Take:
NSE:MIDHANI presents a compelling technical setup with a successful breakout from a well-formed base pattern. The combination of strong volume confirmation, favourable sector dynamics, and improving fundamentals creates an attractive investment opportunity. However, investors should be mindful of the recent sharp move and consider appropriate position sizing and risk management strategies.
The stock appears well-positioned to benefit from India's growing defence and aerospace sector, supported by government initiatives and increasing focus on indigenous manufacturing capabilities. Technical indicators suggest further upside potential, making it suitable for both momentum and growth-oriented investment strategies.
Keep in the Watchlist.
NO RECO. For Buy/Sell.
📌Thank you for exploring my idea! I hope you found it valuable.
🙏FOLLOW for more
👍BOOST if you found it useful.
✍️COMMENT below with your views.
Meanwhile, check out my other stock ideas on the right side until this trade is activated. I would love your feedback.
Disclaimer: "I am not a SEBI REGISTERED RESEARCH ANALYST AND INVESTMENT ADVISER."
This analysis is intended solely for informational and educational purposes and should not be interpreted as financial advice. It is advisable to consult a qualified financial advisor or conduct thorough research before making investment decisions.

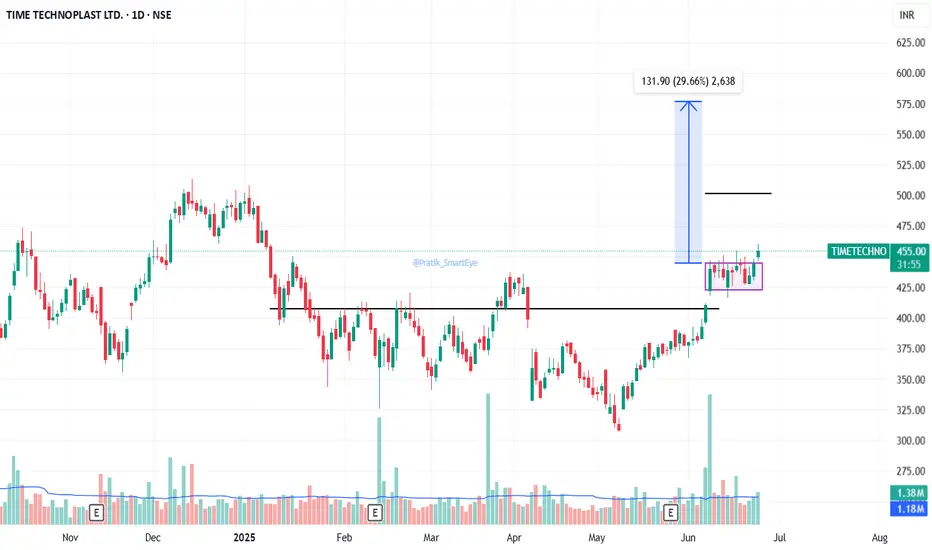
Time Technoplast: Box / Flag BreakoutTime Technoplast: Box / Flag Breakout. CMP 454.
Resistance at 500/576.
Support at 423.