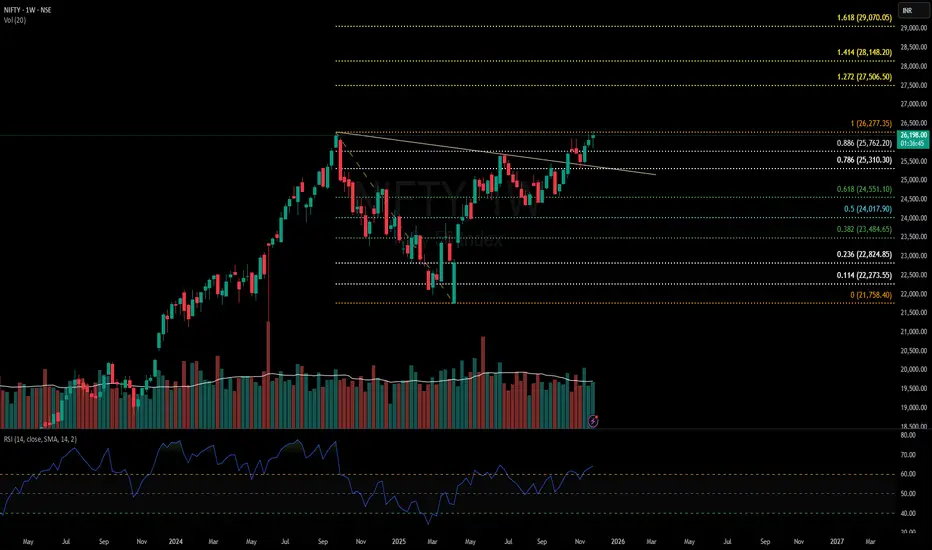
NIfty50 Analysis: Is it start of new bull run or a bull trap?Nifty50 Has given a cup& handle breakout and has already retested this breakout.
Currently, it is hovering near ATH and already looks ready for a breakout.
If this breakout sustains, we might see a good rally coming till budget(Feb'26) and levels to watch according to fib are 27500, 28150 & 29000.
However, December is a favourite season for FIIs to offload money and a correction is historically seen during Christmas season. So, there is a high probability of a bull trap formation as well.
25300 will be a crucial support for Nifty. a breakdown of this level will be confirmation of bull trap and we might see a sharp fall towards 24000 level.
I will suggest to keep a watch on Nifty price action if you have any swing trades open.
Breakoutretest
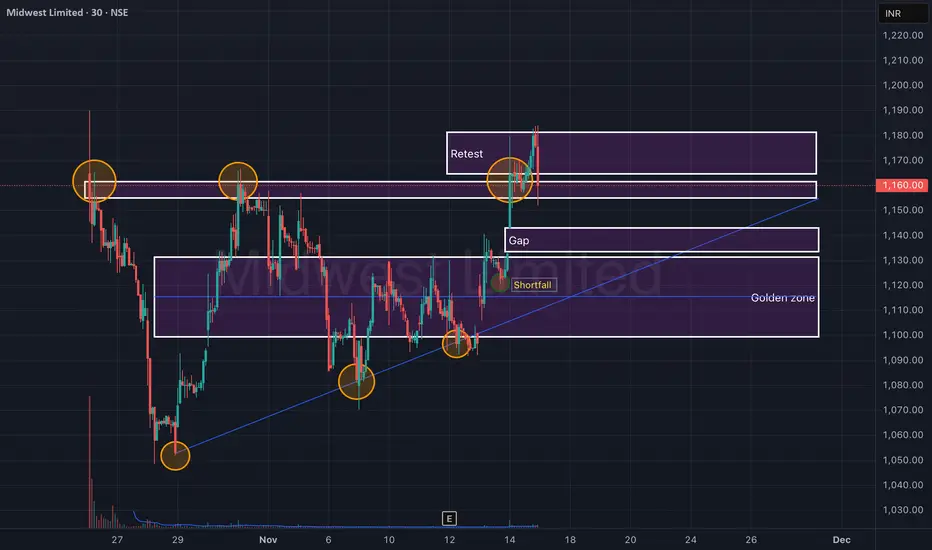
Midwest Ltd – Retest Confirmation After Breakout (30-Min)Midwest Ltd has shown a clean breakout–retest structure on the 30-minute timeframe, respecting both the trendline support and supply zones. The price successfully reclaimed the ₹1,140–₹1,150 range after a short pullback, confirming a bullish retest setup.
The chart highlights how historical rejections (orange circles) have turned into support retests, strengthening the validity of the breakout. If momentum sustains above ₹1,165, a continuation move toward ₹1,180+ could unfold.
🎯 Key Levels:
CMP: ₹1,160 (+3.95%)
Immediate Resistance (Retest Zone): ₹1,165 – ₹1,180
Support / Gap Zone: ₹1,130 – ₹1,145
Golden Zone (Major Support): ₹1,090 – ₹1,115
Stop-Loss: Below ₹1,120 (on 30-min closing basis)
📊 Technical View:
Ascending structure forming higher lows along trendline support.
Gap zone retested successfully, showing demand absorption.
Shortfall recovery followed by a sharp volume rise on breakout.
Sustaining above ₹1,165 may lead to a new swing leg toward ₹1,200.
🧠 View:
Midwest Ltd is showing a textbook breakout–retest structure. Sustaining above ₹1,165 with volume confirmation could trigger a quick 3–4% upside, while ₹1,115 remains the key demand zone.
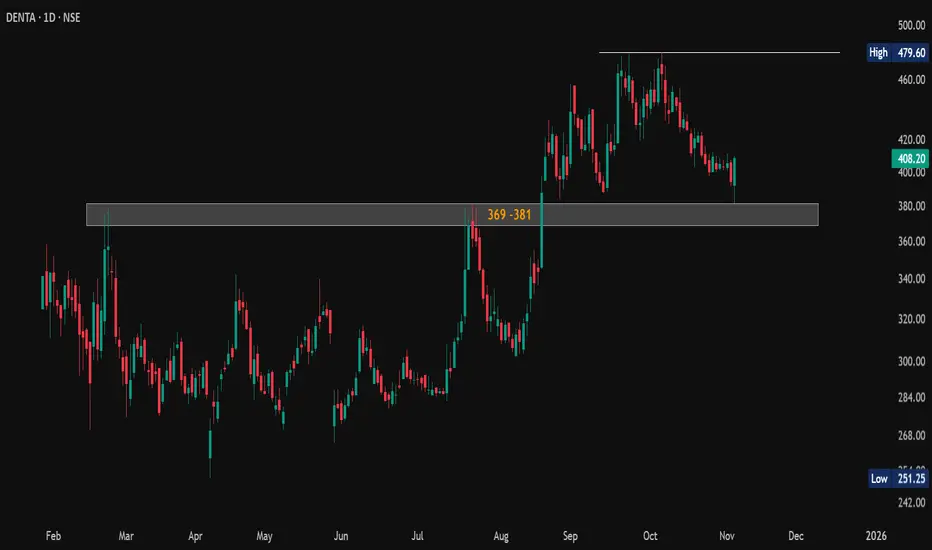
#DENTA Rebounds Strongly from Key Support!#DENTA (Denta Water & Infra Solutions Ltd.)
🔥 Strong bounce from key demand zone 369–381.
📉 Next support: 345–357 (WCB below 345 weakens setup).
📈 Previous resistance now acting as solid support.
💪 Trend intact above 345 (WCB).
🎯 Next resistance: 479–480.
Structure remains bullish — buy-on-dips setup in play! ⚡
#BreakoutRetest #PriceAction #Investing #TradingSetup #ChartAnalysis
📌 Disclaimer: This analysis is shared for educational purposes only. It is not a buy/sell recommendation. Please do your own research before making any trading decisions.
BANCOINDIA Testing Powerful Demand Zone + Breakout Retest 🧠 Understanding the Smart Money Footprints 🧠
Demand and supply zones are not just colorful boxes on a chart — they represent the footprints of smart money . When institutions buy, they don’t enter all their orders at once like retail traders do. Instead, they accumulate positions in parts — leaving behind a visible trail that we can identify on charts through price imbalances. These imbalances structures — form demand and supply zones .
When price returns to these zones, it’s essentially revisiting the footprints of big players — the levels where unfilled institutional orders might still exist.
In BANCOINDIA, we can clearly see this institutional footprint. The stock is now trading near a high-quality demand zone . The structure here is clean and powerful — a perfect Rally–Base–Rally (RBR) formation.
The leg-out candle that formed this demand zone had strong follow-through and even broke past the previous all-time high , confirming intense buying pressure. Now that price is revisiting this zone, it’s showing potential for a fresh upside move.
📉 Traditional Technical Lens 📉
Let’s now analyze BANCOINDIA through the classical technical perspective.
The stock had earlier broken a significant resistance level with massive bullish volume . That breakout confirmed strong demand participation. Now, price is retracing back toward that same level — which, according to the Law of Polarity , should act as new support.
Moreover, the 50 EMA is aligning beautifully beneath the price. The ongoing pullback is approaching both the EMA 50 and the previous resistance — a confluence that further strengthens the bullish bias.
If we observe the volume , we can see that the selling volume is drying up compared to the prior rally. This shows a lack of bearish momentum, increasing the probability of a bounce from current levels.
🎯 Confluence & Trading View 🎯
When we combine both lenses — Demand & Supply Zone Analysis and Traditional Technical Analysis — we find strong confluence:
The stock is sitting inside a powerful Rally–Base–Rally Demand Zone .
The previous resistance has now turned into support (Law of Polarity).
The 50 EMA is acting as an additional support layer.
Volume analysis shows selling pressure drying up.
Together, these signals suggest a high-probability reversal zone. If BANCOINDIA respects this area, we could see the next leg of rally begin soon.
However — as all seasoned traders know — no setup is 100% guaranteed. Risk management is your best friend. Always define your stop loss before thinking about your target. Even the strongest setups can fail, and protecting your capital must come first.
Identify your demand zone and entry level precisely.
Place your stop loss logically below the zone.
Aim for a 1:2 or 1:3 risk-to-reward ratio .
Let the market do the work — not emotions.
"In trading, patience and risk control build fortunes — not predictions."
Lastly, Thank you for your support, your likes & comments. Feel free to ask if you have questions. 🚀
📚 This analysis is purely for educational purposes and is not intended as a trading or investment recommendation. I am not a SEBI registered analyst.

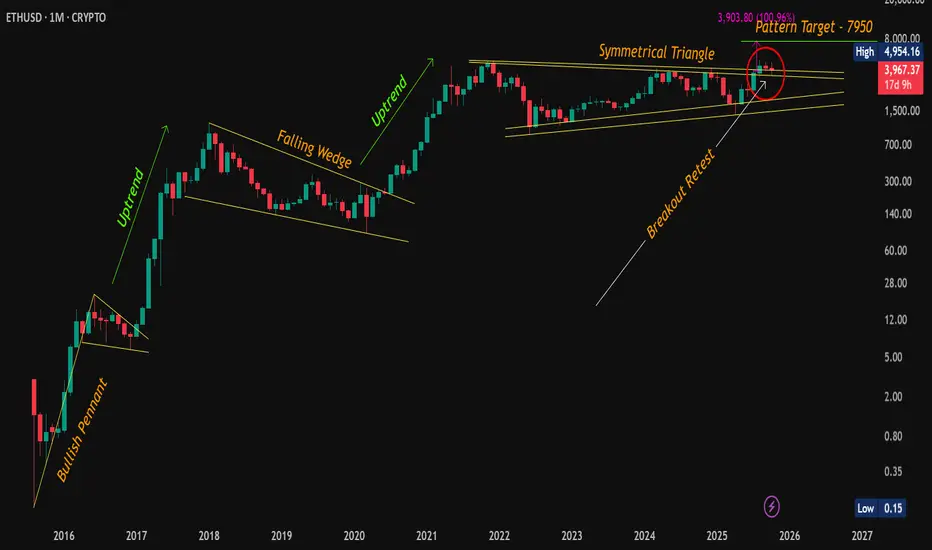
ETH Retest Confirmed – Bullish Momentum Intact!CMP: $3,968
Ethereum is holding strong above the symmetrical triangle breakout zone after a textbook breakout + retest . Despite the recent consolidation, the structure remains bullish , and the bigger pattern is still in play.
🔶 Technical Highlights:
✅ Symmetrical Triangle Breakout: ETH successfully broke out and retested the upper trendline (see red circle). This retest confirms the breakout validity.
✅ Consolidation Above Resistance: ETH is consolidating in a tight range above previous resistance , forming a potential bull flag .
✅ Pattern Targets Remain Active:
📍 Symmetrical Triangle Target: ~$7,950
📍 Bull Flag Target (if breakout confirms): ~$7,365+
📈 Market Structure:
📍 Previous breakouts (Bullish Pennant in 2016, Falling Wedge in 2019) led to strong uptrends .
📍 Current consolidation mirrors historical patterns that preceded major rallies.
🟢 Key Level to Watch:
📍 A monthly close above $4,954.16 (previous ATH) would mark the next major confirmation, likely attracting breakout traders and institutions.
💡 ETH is showing maturity in structure – breakouts, retests, and consolidations are happening on higher timeframes with clear technical precision. The longer this base holds, the stronger the eventual move could be.
📌 Disclaimer: This analysis is shared for educational purposes only. It is not a buy/sell recommendation. Please do your own research before making any trading decisions.
#ETH | #Ethereum | #Crypto | #Breakout | #ChartPatterns | #SymmetricalTriangle | #BullFlag | #PriceAction
Breakout ReTest StrategyI see my GBPUSD short setup with the supply zone marked and stop-loss above the rejection area.
👉 A few thoughts on this trade:
I respected my zone + rejection entry rule (good).
Strong bearish impulse followed after my entry, so the idea was correct.
The sharp drop suggests momentum was in my favor, likely news-driven or liquidity sweep.
My stop placement looks safe above structure (not too tight).
✅ This looks like an A+ setup execution — clean zone, rejection confirmation, and follow-through.

BUY TODAY SELL TOMORROW for 5%DON’T HAVE TIME TO MANAGE YOUR TRADES?
- Take BTST trades at 3:25 pm every day
- Try to exit by taking 4-7% profit of each trade
- SL can also be maintained as closing below the low of the breakout candle
Now, why do I prefer BTST over swing trades? The primary reason is that I have observed that 90% of the stocks give most of the movement in just 1-2 days and the rest of the time they either consolidate or fall
Trendline Support in SUZLON
BUY TODAY SELL TOMORROW for 5%

ASIAN PAINTS LTD. – INTRADAY ZONE ANALYSIS________________________________________________________________________________
📈 ASIAN PAINTS LTD. – INTRADAY ZONE ANALYSIS
📆 Date: June 29, 2025 | ⏱ Timeframe: 15-Minute Chart
🔍 Educational Analysis for Learning Purposes Only
________________________________________________________________________________
📊 Zone Breakdown:
• 🔴 Top Range Resistance – 2,364.50
Marked in Red: This is a potential supply zone, where price may face resistance after a strong move up. Ideal for observing bearish reversal patterns like a shooting star, bearish engulfing, or a doji — especially if volume drops or candles show exhaustion.
• 🟠 Neutral Zone – Avoid Trade Area (2,320–2,340)
Marked in Orange: Historically indecisive. Avoid trades here as price often moves sideways or with false breakouts.
• 🟢 Demand Zone – 2,302.90 to 2,293.70 | SL: 2,292
Marked in Green: Price broke out with strong volume from this area. A retest may offer bullish pullback opportunities with proper confirmation candles.
• 🟩 Bottom Support – 2,275.40
Important base level. Breakdown below this zone may change overall short-term bias.
________________________________________________________________________________
🔍 Candlestick Observation:
At the resistance zone, the last candle shows slight upper rejection and reduced body size.
🧠 Interpretation: A possible early signal of exhaustion. Traders can watch for confirmation via volume drop or follow-up bearish candle for a short bias — or wait for breakout strength for long continuation.
________________________________________________________________________________
⚙️ Educational Trade Ideas (Study Purpose Only)
▶️ Reversal Setup – Bearish Bias
• Entry: Below ₹2,358 on bearish candle confirmation
• Stop Loss: Above ₹2,365
• Risk-Reward: 1:1 | 1:2+
• 🧠 Ideal for studying price rejection after a rally into resistance
________________________________________________________________________________
▶️ Pullback Setup – Bullish Bias
• Entry: Near ₹2,300 with bullish confirmation at demand zone
• Stop Loss: ₹2,292
• Risk-Reward: 1:1 | 1:2+
• 🧠 Useful example of “breakout → retest → continuation” pattern
________________________________________________________________________________⚠️ Disclaimer (SEBI-Compliant):
This content is shared strictly for educational and informational purposes. It is not investment advice or a trading recommendation. Please consult a SEBI-registered financial advisor before taking any investment decisions.
STWP | Learn. Trade. Grow.
________________________________________________________________________________
💬 What do you think about this setup?
Did you observe any other key patterns or zones?
👇 Drop your thoughts in the comments — let’s grow together!
________________________________________________________________________________

KOTAKBANK | Full 5+ years range consolidation and breakoutKOTAKBANK | Full 5+ years range consolidation and breakout in monthly time frame
CMP : 2074
Stable bluechip stock - can expect atleast 40% ROI from here

Coforge-A perfect watchlist stock!Coforge is an IT services company providing end-to-end software solutions and services and is among the top-20 Indian software exporters according to Screener data. Stock has give 20% compounded sales growth in last 5 years which is quite remarkable.
Hence, It can be a good stock to be kept in watchlist for medium to long term.
Stock had given breakout of cup and handle pattern in weekly time frame and is now retesting the same.
Stock has formed a kind of morning star pattern at the retest support zone. Need to watch if it sustains above this zone.
As you can see, retest zone also coincides with 50% fib retracement which makes it even stronger.
If we see good buying in this stock from here, we can see ATH levels soon and even bigger levels in coming years.
However, If stock goes below 61.8% retracement, it is not advisable to hold.

BSE Retesting BO Levels with King CandleNSE:BSE aggressive Short trade as it made a king candle and is close to the previous BO levels and closing below 20 DSMA today.
About:
NSE:BSE is an Indian Stock Exchange at Dalal Street in Mumbai. The Co. facilitates a market for trading in equity, currencies, debt instruments, derivatives, and mutual funds.
F&O Activity:
Short Buildup in Futures with 6000 CE Gaining Significant OI.
Trade Setup:
It looks like a good 1:2 trade setup, with the recent swing high as a strong resistance zone, the RSI is Trending Down and closed below 20 DSMA, If levels are broken Can test 200 DSMA.
Target(Take Profit):
Around 200 DSMA Levels for Swing & Positional Trader.
Stop Loss:
Entry Candle Low for Swing Trader and Recent Swing High or 20 DSMA for Positional Trader.
📌Thank you for exploring my idea! I hope you found it valuable.
🙏FLLOW for more
👍BOOST if useful
✍️COMMENT Below your views.
Meanwhile, check out my other stock ideas on the right side until this trade is activated. I would love your feedback.
Disclaimer: "I am not SEBI REGISTERED RESEARCH ANALYST AND INVESTMENT ADVISER."
This analysis is intended solely for informational and educational purposes only and should not be interpreted as financial advice. It is advisable to consult a qualified financial advisor or conduct thorough research before making investment decisions.

Motherson Sumi-Can it fly from here?Motherson Sumi is now available at a very beautiful demand zone.
It is retesting previous cup and handle breakout and also is near a trendline support.
Any bounce from this zone will give good returns in stock.
Levels are mentioned on chart. One of the best stock within auto ancillary sector.
If you trust EV theme, this stock should be on radar.

Asso Alcohol-Darvas box breakout and Retest done.
✅Stock is in an uptrend
✅Broke out of a base and retested
✅Trading above Key DMAs
✅consolidating right above the base forming base on
base with narrow-range candles
Keep this in your sight and find long opportunity.
CMP: 1128.75
Entry: 1132
SL: 935(Closing Basis)
Risk: 17.3%
Reward: 20.7%
The view shared is for educational purposes. Please do your due diligence.

BSE Bouncing from a support Zone...Stock: BSE Ltd.
Chart Pattern: Potential breakout with retest near support.
Key Levels:Entry: ₹5,553.30
Target (T1): ₹5,848.10
Stop Loss (SL): ₹4,985.95
Observations:
✅Retesting a key zone and taking support at 50 DMA and bouncing.
✅Cup and handle formation played out earlier, now forming higher lows.
✅Volume remains supportive for upward momentum.
✅Resalient to market fall
✅Trading above Key DMAs
✅Strong RSI
Risk-Reward: Moderate-to-high, ideal for positional traders.
Can consider fresh entry further addition if it gives a clean breakout from 5849 levels.
⚠️Remember, we are trading against the trend. If Overall Markets were to fall further then this would also fall.
Disclaimer: This post is for educational purposes, not financial advice.

Nippon LIAM setting up again after Breakout-Pullback. Watch!Breakout from Previous Resistance of 739 with Huge volume and Wide Range Candle on 10 Dec 2024...
🟢Pulled Back/Retested on the back of low volumes.
🟢Setting up again with a wide range/Bullish Engulfing Candle.
🟢Forming a VCP on DTF.
🟢Apt for building positions than short-term trade in my opinion.
▶️Entry-772.5
▶️SL 668.4(13.3%)
▶️Target 1 - 817
▶️Target 2 878
📢 This is for educational purposes only. Trade responsibly. The market trend is not clear yet. Risk Management Rules are extremely important. Kindly do your due diligence and do not rush into a trade without understanding.
#Trading #TechnicalAnalysis #NipponLife #StockMarket

Ashoka Buildcon. Breakout and retest done-Broke out of a base and retest done.
-Volumes are improving
-Trading above Key DMAs.
-Good ROE and ROCE
Keep this on your radar.
SL is deep so please position size accordingly and do not put everything in one go. Fine-tune the SL and Target at your discretion.

IndusTower monthly Chart analysisIndus tower trading at the buying/retest area of the previous breakout zone. Good upside potential with positive business growth can be seen in the fundamental data of the stock.
Do your own analysis before creating any position in this.

Medico- a potential swing candidate. #Tradeideas #Medicoremedies.
Broke out of Cup & Handle and retesting. Potential Swing candidate. Keep on Radar.
Chart shared only for educational purposes. This is not a buy/sell recommendation.
#investing #trading

The Breakout Retest Play: 5 Stocks to Consider1. Infosys NSE:INFY
● The stock has formed a Rounding Bottom pattern, and after the breakout, it rose significantly, reaching an all-time high near 1,990.
● Currently, the stock is trading slightly above the breakout level following a minor pullback.
➖ Best buy level: 1790 - 1830
2. ITC NSE:ITC
● The stock encountered resistance between the 470 and 480 levels multiple times.
● After breaking through this range, the price surged to an all-time high of 528.
● The price then faced rejection at this peak and has since retreated to the breakout level, where it is now rising again.
➖ Best buy level: 470 - 480
3. Lupin NSE:LUPIN
● The stock achieved a breakout after nearly nine years in August 2024.
● Following an initial upward movement, the stock price pulled back for a retest and is now trending upward once more.
➖ Best buy level: 2000 - 2050
4. Birlasoft NSE:BSOFT
● After breaking out of the Rounding Bottom pattern, the stock price surged to an all-time high of 856 before declining.
●The stock is currently trading at the breakout level, which appears to be a strong support.
➖ Best buy level: 550-560
5. Emami NSE:EMAMILTD
● After a prolonged consolidation, the stock developed an Inverted Head & Shoulder pattern.
● Following the breakout, the price surged to an all-time high of 860 but faced strong rejection from that level.
● The stock is now approaching a retest of the previous breakout level.
➖ Best buy level: 595 - 600


PERFECT 'W' PATTERN STOCKThe stock has given a breakout and also the retest has been done.
The stock is ready to move towards the targets of;
1. 190
2. 200
NOTE - Analyse yourself before investing.
HAPPY TRADING!

HARIOM PIPE INDUSTRIES LTD - BREAKOUT RETEST CANDIDATEHariom pipe industries after stellar run shown some correction and consolidation.
On charts CUP & HANDLE breakout can be clearly seen.
This stock can reach in 4 digits soon.
One can add at CMP & on dips after own analysis.

NIFTYpast 2 year during the interesting bull run, price has formed a parallel channel. recent up move was the breakout from the channel and retest of the breakout is also done.
In weeks to come we may expect 25622 to be tested.
