VBL – Is their a wedge Breakout- swing trade Scenario...???Varun Beverages Limited;- CMP: 493.80; RSI: 54.95
Trading plan based on the weekly chart of Varun Beverages Limited 🔍Visible Chart Patterns are as belwo
1️⃣ Falling Wedge / Descending Channel
Lower highs + flat to slightly rising lows
This is a bullish reversal / continuation pattern
2️⃣ Base Formation
Price holding above long-term moving average (200 WMA)
Selling pressure is reducing, volatility is contracting
3️⃣ Mean Reversion Zone
Price hovering near 50–100 WMA cluster
Indicates value buying zone, not breakdown
🎯 Trading Strategy (Swing Trade)
📌 Entry:
• Above ₹500–505 (weekly close above channel resistance)
⛔ Stop Loss:
• ₹470 (below recent higher low)
🎯 Targets:
• T1: ₹540–550
• T2: ₹590–600 (major supply & trendline zone)
⚠️ Neutral / Range Trade (If No Breakout)
• Buy near ₹460–470
• Sell near ₹520–530
• Keep tight SL below ₹450
📌 Thanks a ton for checking out my idea! Hope it sparked some value for you.
🙏 Follow for more insights
👍 Boost if you found it helpful
✍️ Drop a comment with your thoughts below!
Breakouts

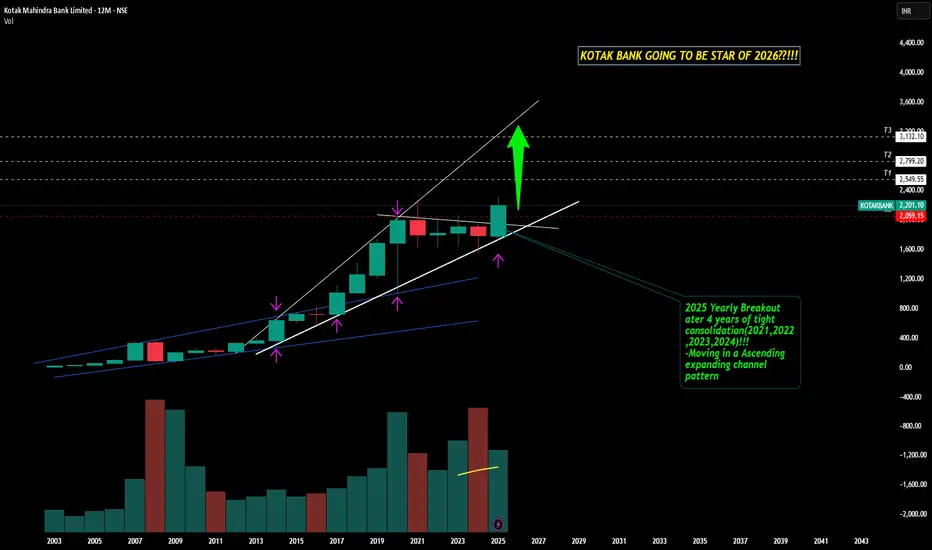
Kotak Mahindra Bank - Bulls Wish Happy 2026 Ahead!!!Kotak Mahindra Bank after 4 years of tight consolidation , has given a Beautiful 2025 Yearly Breakout!!!
It is trading inside a expanding ascending channel pattern from 2014 till now ....taking support and resistance at respective channel lines( shown below- 6month timeframe chart )
Chances are less for a down move after this clean yearly breakout... .Breaking 2059.2 will be a warning sign and possibly delay the upmove...(not for long term investors....)
Monthly time frame chart view below-
For Long term Investors , Monthly breakdown out of the channel with good volume support would make the SL.
Target levels mentioned for long term ones.
With the Stock split on Jan 14, 2026, Kotak bank will see high retail participation and higher volumes!!!
Anyway , Charts indicating a bulls eye on Kotak Mahindra Bank in 2026 and future!!!
Just Sharing my View...not a tip nor advice!!!
Wishing you all a very HAPPY & Prosperous NEWYEAR 2026!!!!
Thank you,
mmjimm!!
CONCOR – 1D | 10-Year Support & Trendline BreakoutCompany Intro:
Container Corporation of India Ltd (CONCOR) is a Navratna PSU and India’s largest integrated logistics company, operating inland container depots (ICDs), container freight stations (CFS), and rail-based logistics services. It plays a key role in India’s EXIM trade and domestic freight movement.
Technical View (Daily Chart):
CONCOR has broken out above a 10-year long-term support trendline, indicating a structural trend reversal, The stock has given a strong close near ₹525, confirming bullish intent and acceptance above the breakout zone.
Levels to Watch:
CMP: ₹523
Immediate Resistance / Target: ₹600
Breakout Confirmation Level: ₹525 (strong close above this keeps momentum positive)
Immediate Support: ₹480
Major Support: ₹446
As long as the stock holds above ₹480, the trend remains positive with a higher probability of moving towards ₹600 in the near term.
Positive Triggers
Government’s continued push for rail-led logistics, DFC (Dedicated Freight Corridor) and multimodal transport benefits CONCOR directly.
Volume recovery in EXIM and domestic logistics improves revenue visibility.
PSU logistics stocks are seeing renewed investor interest due to valuation comfort and long-term infrastructure growth.
For analysis of any stock, feel free to comment the stock name below.
This analysis is for educational and informational purposes only. It does not constitute investment advice or a recommendation to buy or sell any security. Market investments are subject to risk, and past performance does not guarantee future results. Please consult a SEBI-registered financial advisor before making any investment decisions. The author is not responsible for any losses arising from the use of this information.

Piramal Enterprises – Swing Trade Idea🟢 Trade Setup (Swing)
Buy Zone:
➡️ Near ₹1640 (support + demand area)
Targets:
🎯 T1: ₹1783
🎯 T2: ₹1840
Stop Loss:
⛔ ₹1600
🔍 Technical Reasons
Price respecting 20 & 50 EMA
Recent pullback with low selling volume
RSI holding above 50 → strength intact
Previous resistance now acting as support
Risk–Reward ≈ 1:4

This Multi time frame Trick will save you from FAKEOUTSIn this video I am showcasing a daily, weekly and monthly time frame combination - also sharing a trick which can save you a lot of money from those regular sized fakeouts .
Charts used are 3 months old in this video and video is purely educational based .

Multi‑Timeframe Flag & Fair Value Gap ObservationOn the left, the daily timeframe is highlighting a potential flag‑and‑pole structure after a strong one‑sided move.
Within this leg, a blue fair value gap has been marked, which price has interacted with multiple times, illustrating how an imbalanced area can act as a reference zone over time.
On the right, the monthly timeframe of the same instrument is added to provide broader structural context to the daily pattern.
This multi‑timeframe layout is meant purely to show how a lower‑timeframe pattern and an identified fair value gap can be viewed alongside the higher‑timeframe trend without attaching any directional bias.
Disclaimer: This post is for educational and illustrative purposes only and does not constitute investment, trading, or financial advice. Always do your own research and consult a registered financial professional before making any trading decisions.
How to approach any Trade like a PROI make educational content videos for swing / positional trading
Charts used in this video are 3 months older for experience sharing using Bar replay feature of Trading view .

How to Read Candlestick Patterns like a PRO - Price action I make educational content videos for swing / positional trading - breaking down price action movements into simpler steps to make you guys understand the concepts .
Charts used are 3 months or older .

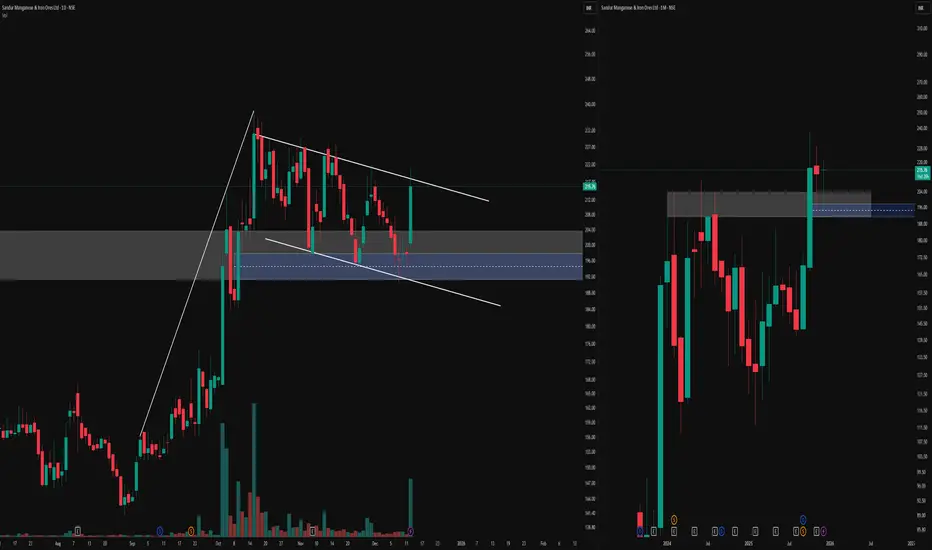
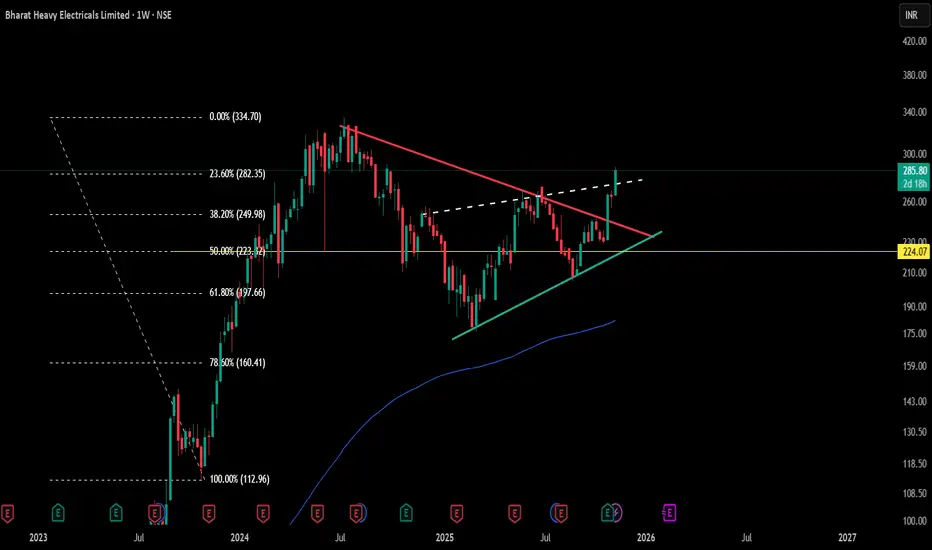
Symmetrical Triangle Structure & Key EquilibriumEditorial Insights
- Symmetrical triangles signal a balanced tug-of-war between buyers and sellers; this compression, as mapped here, often precedes significant expansions in volume and volatility.
- The triangular structure’s edges—CT (red) and trendline (green)—have been tested repeatedly over months, reflecting both supply absorption and demand resilience.
- The hidden white line adds a subtle layer of convergence, useful for traders identifying areas of potential liquidity concentration.
- The yellow 50% Fibonacci level frames the equilibrium for this market phase, offering a snapshot of price discovery dynamics within the triangle.
- Price positioning relative to all these lines is best seen as a way to monitor evolving order flow and market intent, without any explicit forecasting or directional bias.
Key Levels & Reference
- CT (Red): Major supply test points.
- Trendline (Green): Demand and higher low sequence.
- Hidden Line (White): Structural convergence not visibly obvious but influential.
- Fibonacci 50% (Yellow): Core equilibrium reflecting price agreement zone.
This post is for educational and analytical purposes, respecting the principle that all information is a visual observation—not a prediction or directional signal, but a live structure map to enrich your pattern playbook.
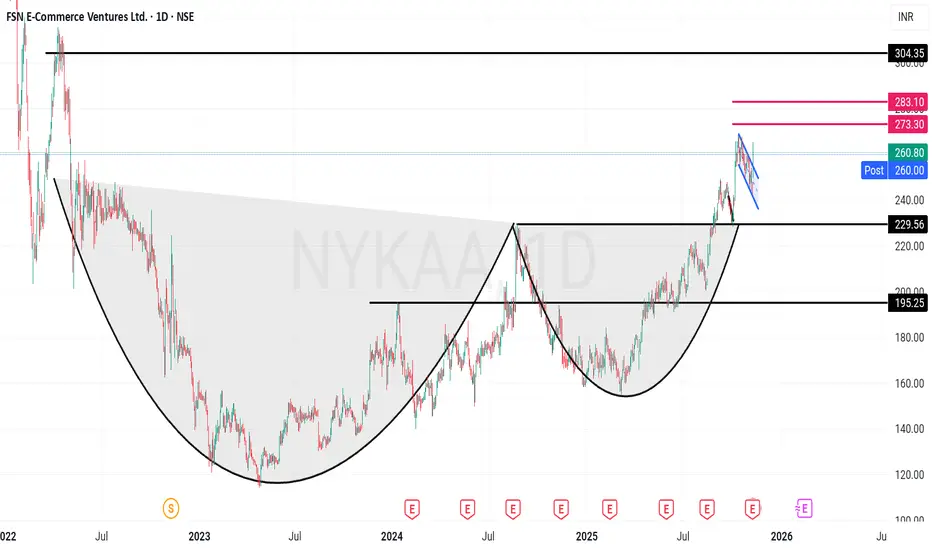
Nykaa - Strong Growth Cup & Handle with Detailed fundamentalsFSN E-Commerce Ventures Limited (Nykaa) – Technical & Fundamental Analysis
Company Overview:
FSN E-Commerce Ventures Limited (Nykaa) is a digitally native consumer technology platform, delivering a content-led, lifestyle retail experience. Since its incorporation in 2012, the company has focused on designing a differentiated brand discovery journey for its consumers. It offers a diverse portfolio of beauty, personal care, and fashion products, including owned-brand products manufactured in-house. Nykaa provides an omnichannel experience to cater to consumer preferences and convenience.
Technical Analysis
Chart Patterns: Cup and handle breakout; Today 1-hour parallel channel breakout
Current Market Price (CMP): ₹260
Targets: ₹301, ₹350
Support Levels: ₹230, ₹195
Recent News & Highlights
✅Q1 FY26 Results: Consolidated net profit surged 142% YoY to ₹23.30 Cr; revenue up 23.4% to ₹2,155 Cr
✅Arbitration Win: Nykaa Fashion received ₹10 Cr compensation from arbitration award
Q1 FY26 Guidance: Management anticipates consolidated net revenue growth at lower end of mid-twenties range YoY
✅Fashion Segment Target: Company expects EBITDA breakeven in fashion by FY26
✅Organic Portfolio Expansion: Aims to increase organic portfolio by 30% annually to reach ₹6,000 Cr GMV
✅Q4 FY25 Performance: EBITDA ₹133 Cr vs ₹93.28 Cr YoY; EBITDA margin improved to 6.47% from 5.59%
✅Corporate Action: NCLT approved merger of Iluminar Media (LBB) into Nykaa Fashion
Analytical Summary
Operational Excellence: Revenue growth of 24.5% YoY with net profit doubling to ₹66.08 Cr demonstrates strong execution and operating leverage. The company is scaling both beauty and fashion verticals while expanding margins.
Capital Structure: Debt increased 41% to ₹961 Cr, but debt-to-equity remains negligible at 0.04, showing conservative leverage. ROE at 5.9% suggests room for improvement in capital efficiency.
Valuation Risk: PE of 675.77 and PB of 40.5 reflect aggressive growth expectations. EV/EBITDA of 117.5 leaves minimal margin of safety, requiring caution for long-term investors.
SWOT Analysis
Strengths (16 Factors):
Rising net and operating cash flows for 2 consecutive years
Strong EPS growth; quarterly profit margins expanding
Improving RoCE, ROE, and ROA
Consistent revenue growth for past 2 quarters
Clean governance; zero promoter pledge
Weaknesses (3 Factors):
Promoter shareholding dilution
Expensive valuation (PE > 40) limits margin of safety
Opportunities (1 Factor):
Increasing FII/FPI shareholding validates institutional interest
Disclaimer
This analysis is for educational and informational purposes only. It does not constitute investment advice. Trading and investing in stocks involve risks, and individuals should conduct their own due diligence or consult with a qualified financial advisor before making any investment decisions. The author is not responsible for any gains or losses arising from the use of this analysis.
Cholamandalam Financial Holdings Ltd (CFHL) Triangle Breakout 1DCholamandalam Financial Holdings Ltd (CFHL) – Triangle Breakout & 1-Year Resistance Breakout 🚀
📊 Technical View:
CFHL has given a triangle breakout along with a 1-year resistance breakout, indicating strong bullish momentum. If Trend continues, The price action also shows a successful retest of the breakout zone, shows trend continuation.
Resistance Turned Support: ₹1650 – previously a resistance, now acting as strong support.
Current Action: Price broke above the ₹1650 range, retested the level today , and is now moving upward again.
Next Resistance Targets Levels: ₹1824 / ₹2004
Support Levels: ₹1536 / ₹1410
🏦 Company Overview:
Cholamandalam Financial Holdings Limited (CFHL), incorporated in 1949, is a part of the Murugappa Group, one of India’s most diversified business conglomerates.
CFHL is a Non-Deposit Taking Systemically Important Core Investment Company (CIC) registered with the Reserve Bank of India (RBI).
The company holds substantial investments in group companies and provides a diverse range of financial products and risk management services to individual and corporate clients through its subsidiaries and group companies.
📈 For educational purpose only. Not a buy/sell recommendation.

Tamilnad Mercantile Bank (TMB) – Update | 3.5% Move from Our Lvl🟢 Tamilnad Mercantile Bank (TMB) – Update | 3.5% Move from Our Level 🚀
Latest Update : Our analysis shared around ₹499 has played out well — TMB made an intraday high of ₹517, gaining nearly 3.5% from the mentioned level.
🏦 Company Overview:
Tamilnad Mercantile Bank Limited is one of the oldest and leading old private sector banks in India. The bank offers a wide range of banking products and services to retail, MSME, agricultural, and corporate customers.
Retail Products: Home loans, personal loans, auto loans, educational loans, business loans, and security-backed loans.
MSME Portfolio: Loans for manufacturing, traders, and service sector enterprises.
Agricultural Loans: Offered to individual farmers, farmer groups, agri-businesses, and agri-corporates.
📊 Technical View:
High Reached: ₹517 (▲3.5%)
Resistance: ₹510 – price tested and faced mild rejection here.
Supports: ₹466 / ₹440
💡 View: The stock showed strong momentum from the support zone and approached its major 1-year resistance area near ₹510–₹515. A sustained close above ₹515 can confirm a breakout and open the next upside targets of ₹535 / ₹600.
📈 For educational purpose only. Not a buy/sell recommendation.

HEG- Monthly breakout confirmationBuy in chunks between, 550 -530
SL-480
Target 800
Note- Only for educational purpose.

#SBFC - VCP Breakout in DTF Script: SBFC
Key highlights: 💡⚡
📈 VCP Breakout in DTF
📈 Short consolidation below Resistance
📈 Volume spike seen during Breakout.
📈 MACD Bounce
📈 Keep in WL
⚠️ Important: If you have any questions about the setup, feel free to drop them below — I’ll respond to each one.
⚠️ Important: Always Exit the trade before any Event.
⚠️ Important: Always maintain your Risk:Reward Ratio as 1:2, with this RR, you only need a 33% win rate to Breakeven.
✅Like and follow to never miss a new idea! ✅
Disclaimer: I am not SEBI Registered Advisor. My posts are purely for training and educational purposes.
Eat🍜 Sleep😴 TradingView📈 Repeat 🔁

Tamilnad Mercantile Bank – 1D Chart | Strong Resistance Zone🟢 Tamilnad Mercantile Bank (TMB) – 1D Chart | Strong Resistance Zone Ahead
📊 Chart Setup:
TMB is testing its major 1-year resistance zone around ₹510, a key level that has capped price movements for months. A strong daily close above ₹510 could trigger momentum towards higher targets.
🔹 Resistance: ₹510 (Major 1-year resistance)
🔹 Targets on Breakout: ₹535 / ₹600
🔹 Supports: ₹466 / ₹440
🔹 View: Price consolidating near breakout zone. Sustained close above ₹510 can signal trend continuation.
🏦 Fundamental Update – Q2 FY26 Results Highlights:
Tamilnad Mercantile Bank delivered steady performance with profit growth and improved asset quality.
• Net Profit: ₹318 Cr ↑ (▲4.95% YoY)
• Total Business: ↑11.40%
• Deposits: ₹55,421 Cr ↑12.32%
• Advances: ↑10.5%
• Net Interest Income: ₹597 Cr ↑0.17%
• Gross NPA: ↓ to 1.01%
• Net NPA: ↓ to 0.26%
• Capital Adequacy Ratio (CAR): Strong at 30.96%
➡️ Stable performance, improving asset quality, and strong capital base add confidence to the technical setup.
📈 For educational purpose only. Not a buy/sell recommendation.

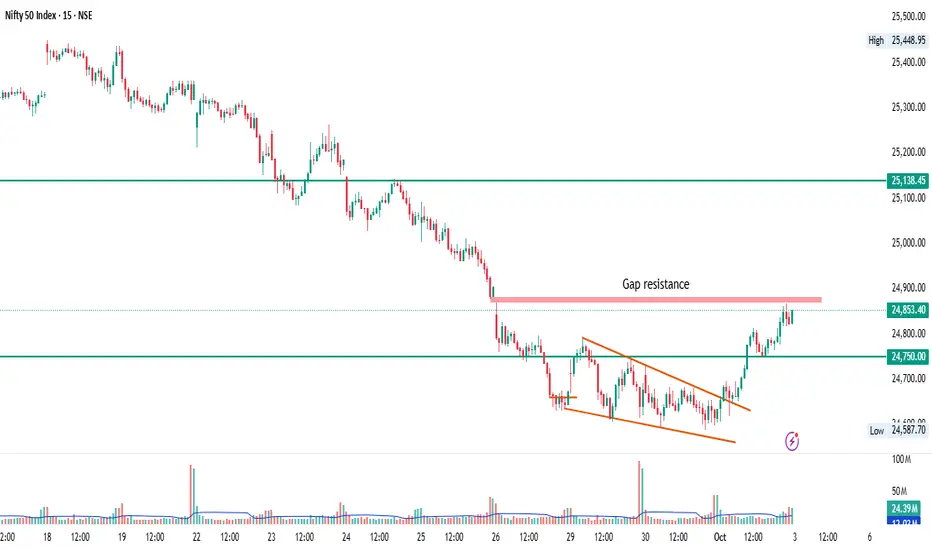
NIFTY 50 – Intraday level 15min TFNIFTY 50 – Gap Resistance Test After Falling Wedge Breakout
Timeframe: 15 min
📌 Key Observations:
Falling wedge pattern formed over the last few sessions, followed by a clean breakout with rising volume.
Price has now rallied toward the gap resistance zone near 24,880–24,900, where supply previously stepped in.
24,750 is acting as immediate support — the level from where the breakout initiated.
Next resistance to watch is 25,138, which aligns with a previous structure zone.
📈 Trading Plan:
✅ Bullish if:
Price sustains above the 24,880–24,900 gap resistance
Then potential upside towards 25,050 / 25,138
⚠️ Caution if:
Price gets rejected at the gap resistance
Watch for pullback retest around 24,750
🔍 Sentiment:
Short-term recovery is in play after a prolonged downtrend, but the current zone is a make-or-break resistance.
BUY TODAY SELL TOMORROW for 5%DON’T HAVE TIME TO MANAGE YOUR TRADES?
- Take BTST trades at 3:25 pm every day
- Try to exit by taking 4-7% profit of each trade
- SL can also be maintained as closing below the low of the breakout candle
Now, why do I prefer BTST over swing trades? The primary reason is that I have observed that 90% of the stocks give most of the movement in just 1-2 days and the rest of the time they either consolidate or fall
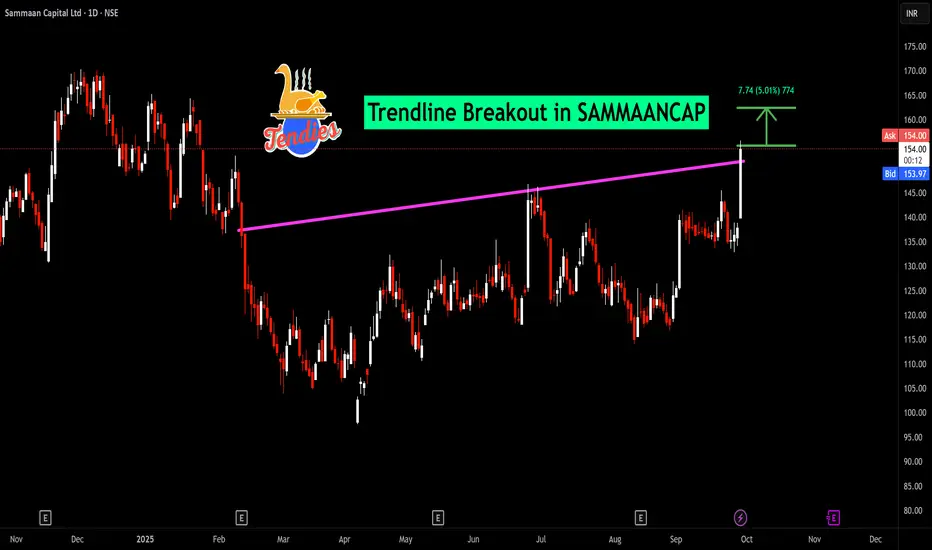
Trendline Breakout in SAMMAANCAP
BUY TODAY SELL TOMORROW for 5%
BUY TODAY SELL TOMORROW for 5%DON’T HAVE TIME TO MANAGE YOUR TRADES?
- Take BTST trades at 3:25 pm every day
- Try to exit by taking 4-7% profit of each trade
- SL can also be maintained as closing below the low of the breakout candle
Now, why do I prefer BTST over swing trades? The primary reason is that I have observed that 90% of the stocks give most of the movement in just 1-2 days and the rest of the time they either consolidate or fall
Trendline Breakout in JAYNECOIND
BUY TODAY SELL TOMORROW for 5%

SCI - Shipping Corporation of IndiaShipping corporation of India - SCI :- Price Breakout with Volume after a year.

UJJIVANSFB - VCP Breakout in DTF Script: UJJIVANSFB
Key highlights: 💡⚡
📈 VCP Breakout in DTF
📈 Short consolidation below Resistance
📈 Volume spike seen during Breakout.
📈 MACD Bounce
📈 Can go for a swing trade
⚠️ Important: Always Exit the trade before any Event.
⚠️ Important: Always maintain your Risk:Reward Ratio as 1:2, with this RR, you only need a 33% win rate to Breakeven.
✅Like and follow to never miss a new idea!✅
Disclaimer: I am not SEBI Registered Advisor. My posts are purely for training and educational purposes.
Eat🍜 Sleep😴 TradingView📈 Repeat 🔁

Akme Fintrade (D) - Confirms Bullish Reversal with Dual BreakoutAkme Fintrade has shown strong signs of a bullish trend reversal. After breaking a major angular resistance yesterday, the stock followed through today by breaching a short-term horizontal resistance with a powerful +9.08% surge . This move was backed by massive trading volume, confirming the strength of the breakout.
This decisive action reinforces the reversal pattern that began in April 2025, which has been characterized by the stock consistently forming Higher Lows . The consistent volume buildup over the past few days further suggests growing buyer conviction.
Outlook and Key Levels
The back-to-back breakouts suggest that the path of least resistance has shifted to the upside. The price action in the coming days will be crucial to confirm that this new momentum is sustainable.
- Bullish Case 📈: If the breakout is sustained, particularly on good volume, the stock could be headed towards the next resistance level near ₹11 .
- Bearish Case 📉: However, if the stock is unable to hold the breakout level and momentum fades, it could pull back to find support near ₹6.80 .

Stock-wise Investigation: Breakouts or Support? ( MTF )Using 3-month-old chart data, this video explores how stocks tend to favor breakouts or support zones, with key technical terms to sharpen your pattern recognition skills—purely educational in nature.

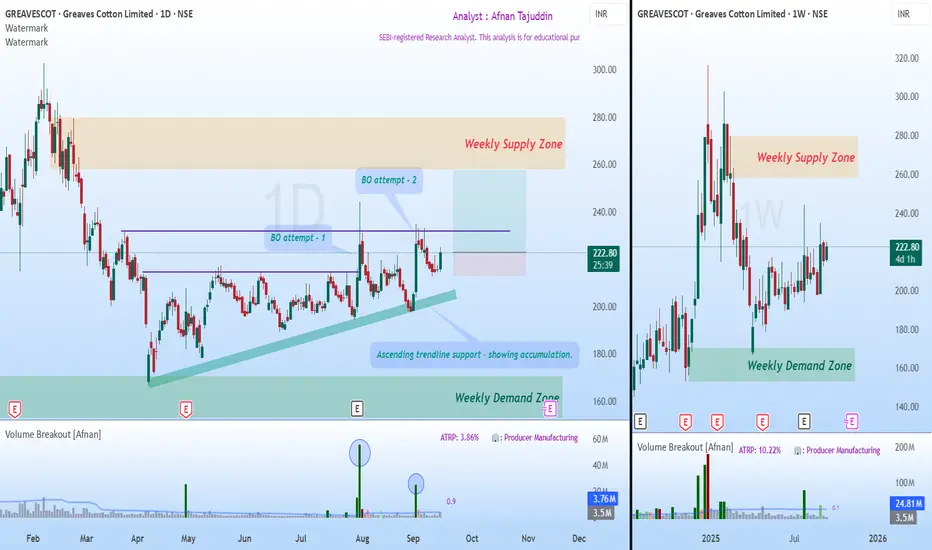
Accumulation and a Possible Breakout Towards Weekly Supply📈 Market Trend and Structure 📈
After forming an all-time high, price began its decline and developed a weekly supply zone . This supply zone now stands as the major target area for buyers.
Following the decline, price touched the weekly demand zone , which acted as a powerful reversal point . As supply-demand traders, this gave us a strong indication of the probable bottom.
From there, price recovered and moved into a phase of sideways consolidation , reflecting the tug of war between buyers and sellers.
⚡ Breakout Attempts and Trendline Support ⚡
During this consolidation, price attempted two breakouts with strong volumes . Both times, sellers stepped in aggressively at the horizontal resistance line.
Buyers, however, showed resilience by consistently defending an ascending trendline . This steady support is a sign of accumulation and growing demand.
Recently, price and volume contracted , forming an inside candle —a balance between buyers and sellers.
Today, this inside candle was broken to the upside, which could make this third breakout attempt successful.
🎯 Trading Plan 🎯
Bias: Bullish continuation.
Entry Trigger: Two previous breakout attempts + today’s breakout of the inside candle.
Target: Weekly supply zone.
Stop Loss: Below the previous swing low.
Risk-to-Reward: Approximately 1:3, a favorable setup.
✨ In Short : Sellers are still active near horizontal resistance, but buyers are showing greater strength at higher lows. The breakout of today’s inside candle tilts the balance towards buyers, making this the most promising pre-breakout setup so far.
🚀💡 “In trading, patience to wait and courage to act make all the difference.”
Lastly, Thank you for your support, your likes & comments. Feel free to ask if you have questions.
⚡ Stay disciplined, trade smart, and let the charts guide your story! 📊✨
This analysis is purely for educational purposes and is not intended as a trading or investment recommendation. I am not a SEBI registered Analyst.