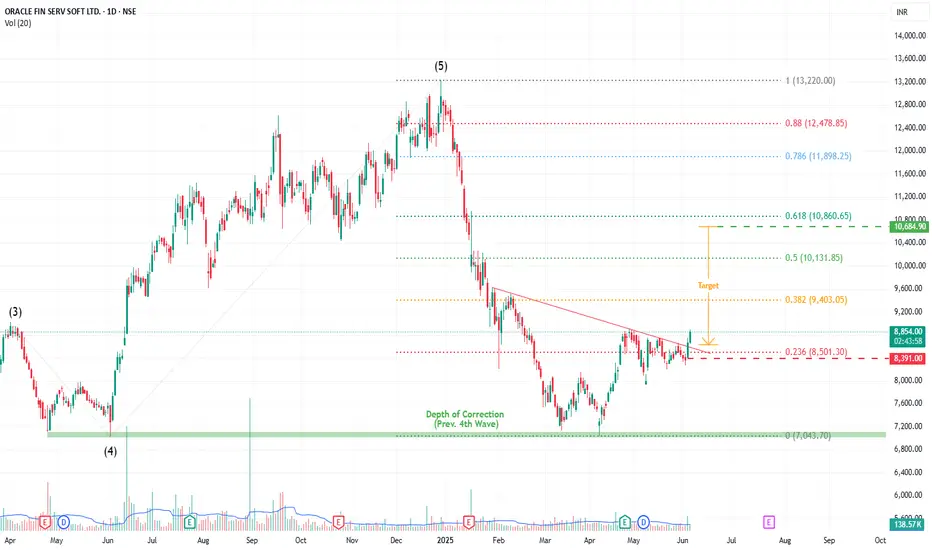
OFSS (ORACLE FIN SERVICE) By KRS Charts5th June 2025 / 12:35 PM
Why OFSS?
1. Fundamentally Good Company.
2. Technically, Bullish Stock for a long time and here again made higher low on bigger time frame.
3. Wave Theory vice it bounces back from 4th impulsive wave (Depth of Correction).
4. After that it has formed few bullish charts pattern like Invt. Head & Shoulder and Flag and Pole is also visible within.
5. Yesterday it Broke Neckline with good volume green candle.
Targets & SL (1D Closing Basis) is mentioned in Chart
Breakouts
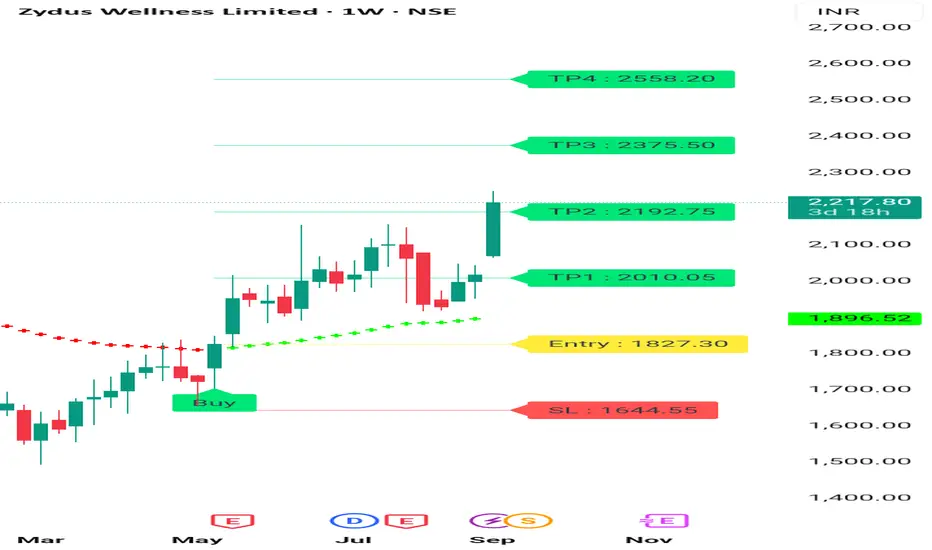
ZYDUS Wellness Weekly Chart Zydus wellness Given Good movement on Acquisition. Zydus wellness Given Weekly breakout, it's forming Rounding Pattern . Next tgt may be 2450 + 2500 in next 3 -6 months. Consult your financial advisor before making any position in this stock .
BUY TODAY SELL TOMORROW for 5%DON’T HAVE TIME TO MANAGE YOUR TRADES?
- Take BTST trades at 3:25 pm every day
- Try to exit by taking 4-7% profit of each trade
- SL can also be maintained as closing below the low of the breakout candle
Now, why do I prefer BTST over swing trades? The primary reason is that I have observed that 90% of the stocks give most of the movement in just 1-2 days and the rest of the time they either consolidate or fall
Round Bottom Breakout in WINDLAS
BUY TODAY SELL TOMORROW for 5%
BUY TODAY SELL TOMORROW for 5%DON’T HAVE TIME TO MANAGE YOUR TRADES?
- Take BTST trades at 3:25 pm every day
- Try to exit by taking 4-7% profit of each trade
- SL can also be maintained as closing below the low of the breakout candle
Now, why do I prefer BTST over swing trades? The primary reason is that I have observed that 90% of the stocks give most of the movement in just 1-2 days and the rest of the time they either consolidate or fall
Trendline Breakout in CUPID
BUY TODAY SELL TOMORROW for 5%

My Simple Theory on how to approach any ENTRY with examples I make educational content videos for swing / positional trading

BUY TODAY SELL TOMORROW for 5%DON’T HAVE TIME TO MANAGE YOUR TRADES?
- Take BTST trades at 3:25 pm every day
- Try to exit by taking 4-7% profit of each trade
- SL can also be maintained as closing below the low of the breakout candle
Now, why do I prefer BTST over swing trades? The primary reason is that I have observed that 90% of the stocks give most of the movement in just 1-2 days and the rest of the time they either consolidate or fall
Resistance Breakout in LINCOLN
BUY TODAY SELL TOMORROW for 5%

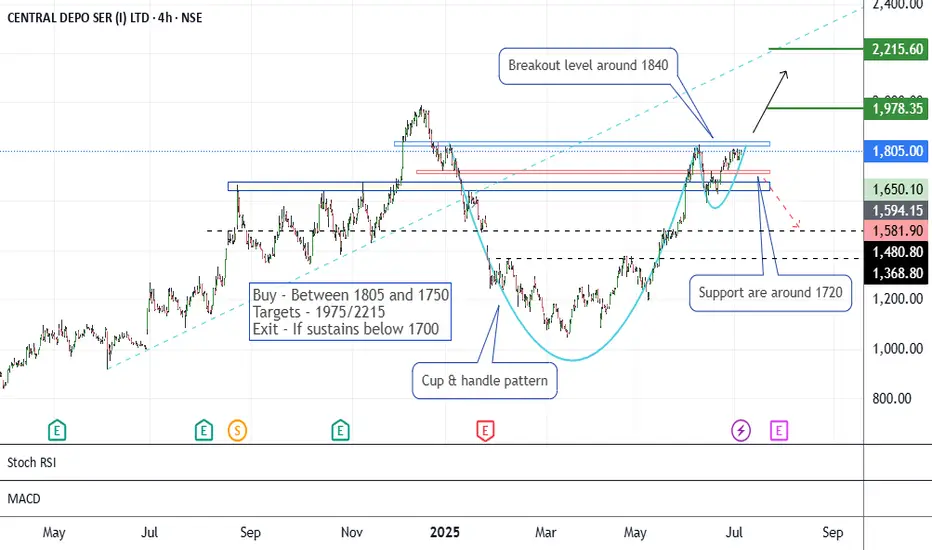
CDSL - An AnalysisThe stock price has formed a Cup & Handle-like pattern since January 2025. This moment is reaching near the breakout levels of 1820-1840.
If it sustains above 1840, it may go bullish to see the levels of 1975/2215.
Support levels are around 1710.
One has to maintain risk management according to the exit levels below 1700.
Second view -
If it does not sustain above the levels of 1840-1860, and slips down below 1700, the setup will show weakness and a bearish view. Then it may go lower to the levels of 1480 and 1365.
All these illustrations are for learning and knowledge-sharing purposes. It should not be considered as a buying or selling recommendation.
All the best.
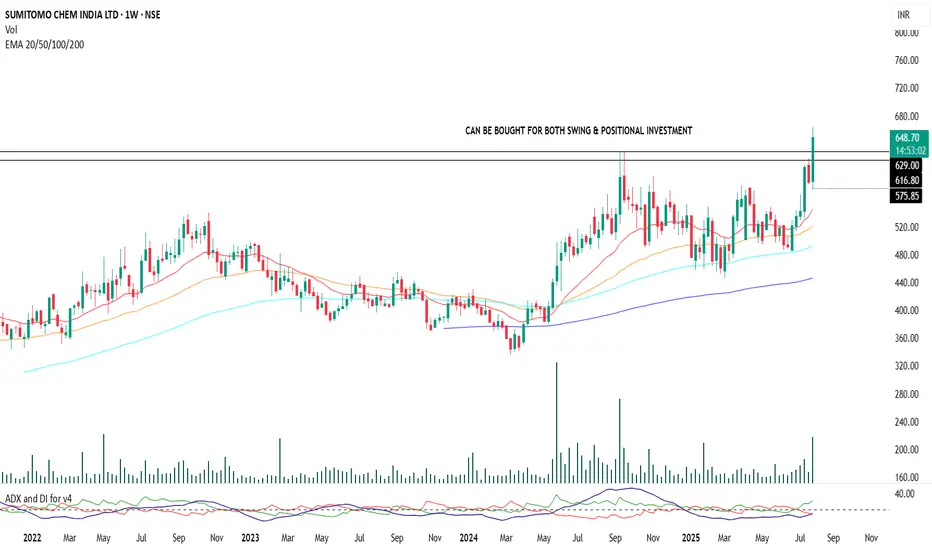
Sumitomo Chemical | Positional Swing Setup with Dynamic SLA strong setup is forming in Sumitomo Chemical with bullish c price action and trend indicators. Entry can be been initiated at current levels with small quantity with a stop-loss placed at ₹570 on a weekly closing basis.
No fixed targets. This is a trailing stop-loss-based position aimed at capturing a sustained trend move.
Add-on Zone: If the price retests the support near the ₹630 level (previous structure/support), more quantity will be added as part of a pyramiding strategy, provided broader market structure remains bullish.
Indicators Used for Trailing SL & Confirmation:
ADX & DI , RSI Levels
Exit Criteria:
Weekly close below ₹570 (hard stop)
Note: This is a disciplined, structure-based swing trade with optional pyramiding. Avoid impulsive exits; trail stop-losses logically based on trend indicators.
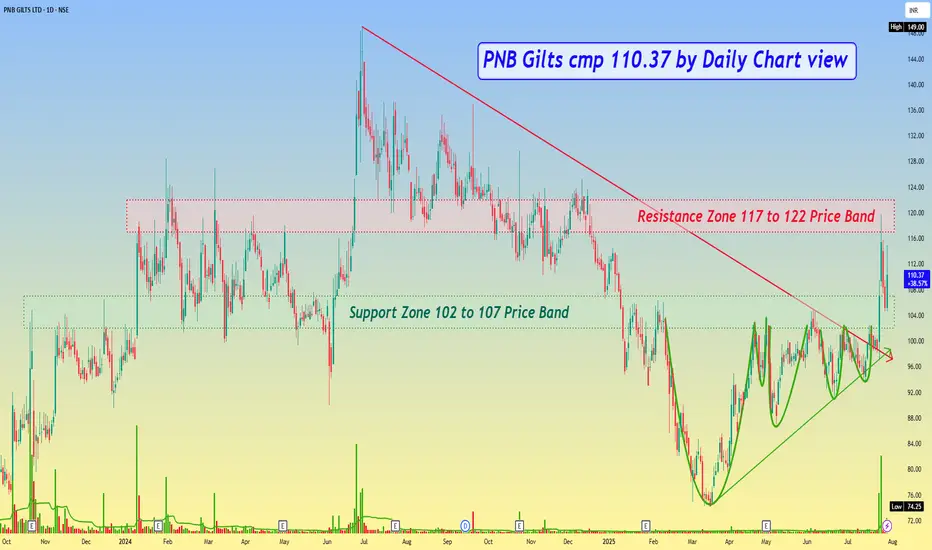
PNB Gilts cmp 110.37 by Daily Chart viewPNB Gilts cmp 110.37 by Daily Chart view
- Support Zone 102 to 107 Price Band
- Resistance Zone 117 to 122 Price Band
- Volumes are seen spiking heavily over past few days
- Support Zone is getting tested retested since last week
- Bullish Technical Chart indicates decent breakout probability
- Falling Resistance Trendline Breakout is seen to be well sustained
- Very closely considerate VCP pattern has formed below the Support Zone
- Majority Technical Indicators BB, EMA, SAR, MACD, RSI, SuperTrend trending positively
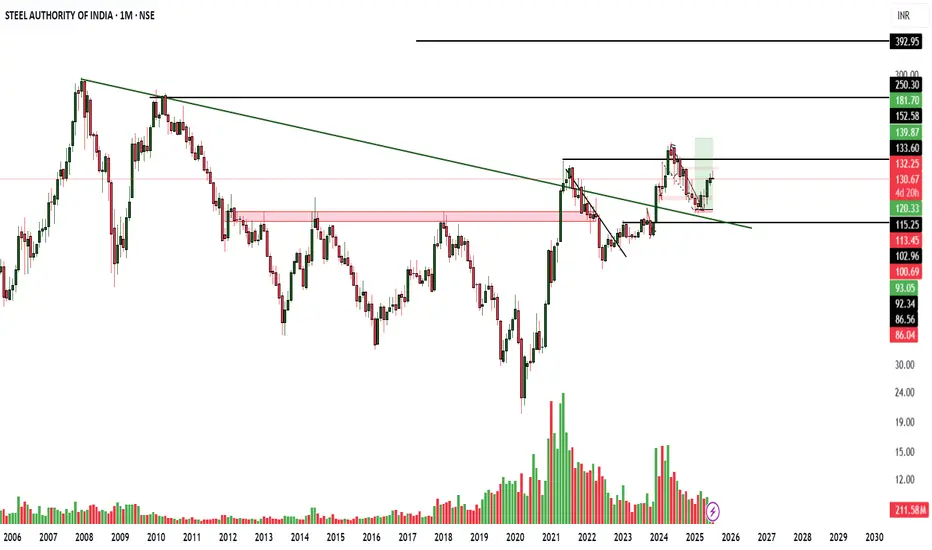
SAIL Breakout + Dividend & Earnings Alert! SAIL has climbed steadily from the ₹100–₹102 support zone and recently broke out of a falling trendline, backed by rising volume—signaling renewed bullish energy.
📈 Technical Snapshot:
Resistance: ₹132–₹133
Breakout Targets: ₹139 → ₹152 → ₹181
Potential Retrace Zone: ₹120–₹115 if it fails near resistance
💸 Dividend Alert:
SAIL typically pays regular dividends. The board recommended a final dividend in May 2025, and the ex-dividend date was around mid-September 2024. Watch the next announcement closely to avoid missing out.
📅 Upcoming Earnings / Shareholder Events:
Q1 FY2026 results are scheduled for July 25, 2025 (board meeting to approve results)
Earnings call expected on July 28, 2025, in the afternoon IST
⚙️ Trade Setup:
Entry Trigger: Break and close above ₹133.60
Stop Loss: Below ₹120
Target Zones: ₹139–₹152
Monitor: Volume trends, dividend confirmation, earnings surprises, and price reaction post-earnings
⚠️ Not financial advice—trade with your risk plan in mind.
💬 Drop your views—Buy for dividend, swing for breakout, or play safe?
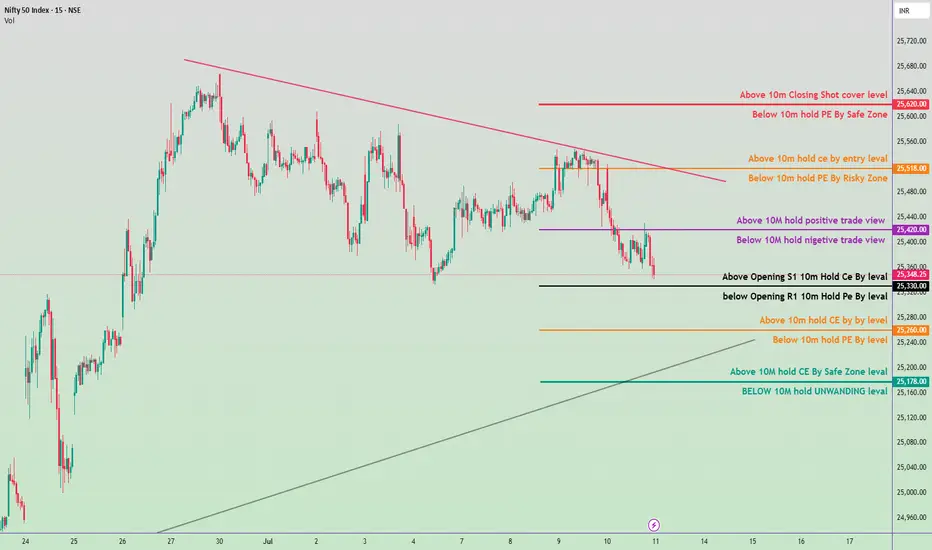
Nifty 50 Intraday Trade Plan 11 july 2025🔴 Resistance & Shorting Zones:
25,620.00
🔹 Above 10m Closing = Short Cover level
🔹 Below 10m = PE by Safe Zone
25,518.00
🔹 Above 10m = Hold CE by Entry level
🔹 Below 10m = PE by Risky Zone
25,420.00
🔹 Above 10m = Hold Positive Trade View
🔹 Below 10m = Negative Trade View
⚖️ Neutral / Opening Zone:
25,348.25 (CMP)
🔸 Above Opening S1 = Hold CE by Level
🔸 Below Opening R1 = Hold PE by Level
🟠 Intermediate Support/Resistance:
25,260.00
🔸 Above 10m = Hold CE by Level
🔸 Below 10m = Hold PE by Level
🟢 Support & Unwinding Zones:
25,178.00
🔹 Above 10m = CE by Safe Zone
🔹 Below 10m = Unwinding Level
📌 Summary:
A move above 25,420 may shift view to bullish/intraday CE hold.
Below 25,260 suggests weakness, possible PE play.
Major support at 25,178, breakdown below this might trigger heavy unwinding.
PVR Channel Break out - Upside 5% Gain (short term)PVR INOX: Setting the Stage for a 5% Upside?
PVR INOX Ltd is showing signs of a potential breakout, with technical indicators aligning for a short-term upside of around 5%. On the hourly chart, the stock is consolidating above key EMAs (968–970 zone), forming a bullish structure supported by a rising trendline.
Current Price: ₹974.50
Upside Target: ₹1,020+
Indicators: EMA confluence, breakout from descending channel, volume uptick
Morning Doji Star - Bullish (Emerging) 1 day Time frame
What’s fueling the optimism?
- 🔥 Strong box office performance in early 2025, with collections up 39% YoY in Jan–Feb
- 🎟️ Highest-grossing February since COVID, led by hits like Chhaava
- 💼 Promoter stake increase and bullish brokerage calls (ICICI Securities sees up to 100% long-term upside)
With a robust content pipeline and improving fundamentals, PVR INOX might just be ready for its next act.

NYKAA - Breakout from DTFNYKAA has resistance weakening on the Daily charts and has given a breakout with good volume.
The target of this pattern signals an upside potential of 10% from the current price level in the medium term.
The stock is trading above its 50- and 100-day simple moving averages (SMAs). The range is more than >1.2X, and the Volume is also >2X the average.
CMP- Rs. 108
Target Price- Rs228 ( 10% upside)
SL -202
Disclaimer: This is not a buy/sell recommendation. For educational purpose only. Kindly consult your financial advisor before entering a trade.

OPTIEMUS | Reclaiming Zones, Respecting Trendlines🟩 Price is navigating a critical structure:
White Line = Major CT (Control Trendline) — currently acting as resistance.
White Zone = MTF Supply ➡ Demand Flip Zone — price is holding above it.
Blue Zone = WTF Demand Pocket — also reclaimed recently.
📌 After reclaiming both the blue and white zones, price is now consolidating just under the CT, possibly coiling up.
🧠 Not a prediction. No tips. Just structure-based storytelling.

Titan - Keep On WatchCMP 3652 on 26.06.25
The chart itself is self-explanatory. The price has formed a Cup & Handle-like pattern since February 2025. This time, it is reaching the breakout levels.
MACD shows a likely reversal, too.
If it breaks out, it may go bullish to reach the levels of 3850, 4050, and potentially higher, depending on the market conditions.
In case of any correction, support levels are around 3510.
One may plan entry on different levels while considering risk management and position size.
All these illustrations are only for learning and sharing purposes; it is not buy or sell advice. Please do your research before taking any trade.
All the best.

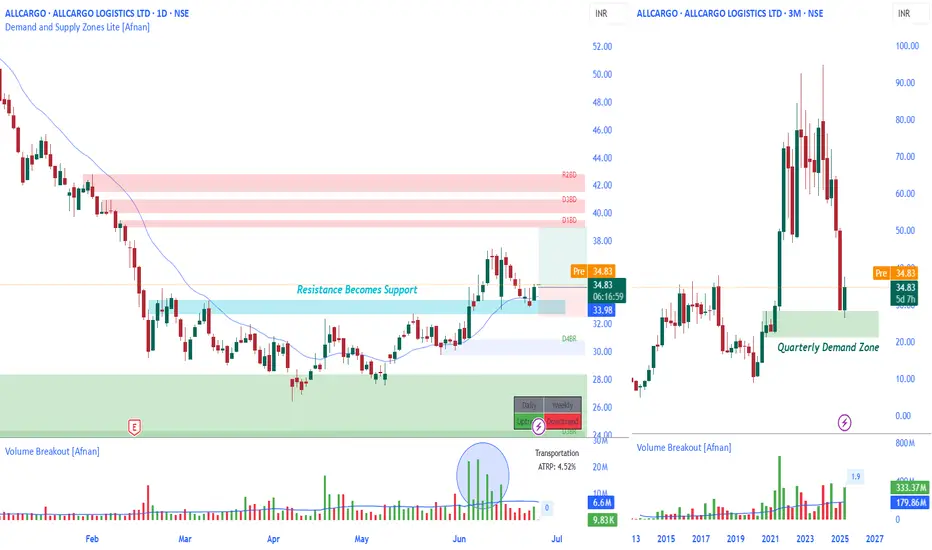
Quarterly Demand Zone + Daily Breakout = Strong ConfluenceLet’s talk about a setup that checks almost every box for a technically sound trade— NSE:ALLCARGO .
This isn’t just any breakout. It’s one of those rare moments when multiple timeframes are pointing in the same direction... and when that happens, smart traders pay attention.
🧱 Quarterly Demand Zone – The Foundation of the Setup
This isn’t just a technical level—it’s a potential stronghold for smart money activity. Price has just entered and reacted from a well-defined Quarterly Demand Zone, which historically tends to be the playground of institutions, not retail noise.
What I find especially compelling is how the reaction from this Quarterly Demand Zone isn't just visible—it’s meaningful. The current quarterly candle is green, forming on increasing volume, and there are only 3 days left until it closes. That’s not random—it’s calculated accumulation.
🧱 Daily Price Action Breakdown
On the Daily timeframe, the stock had been in a tight sideways range for a while. That consolidation wasn’t random—it was accumulation. We saw repeated tests of a clear resistance zone, gradually weakening that level... and then?
Boom. Breakout.
And not a weak or fake-out move either. This one came with conviction and volume. Now the price is pulling back slightly, retesting the breakout zone—which, by the way, is now acting as support thanks to the Polarity Principle . The most recent daily candle? Showing signs of price respecting this level.
💡 When price responds to a higher timeframe demand zone and then breaks out on the lower timeframe with strength, that’s a serious signal of institutional activity and trend continuation. you’re not just chasing momentum—you’re trading with alignment .
📊 Technical Highlights
Quarterly Demand Zone Reacted : Price reversed from a higher timeframe zone—classic smart money footprint.
Quarterly Candle Turned Bullish : Green candle forming with rising volume, hinting at a potential long-term reversal.
Daily Breakout From Consolidation : Resistance was tested multiple times, finally gave way.
Volume Confirmation : Breakout candle printed on above-average volume—always a good sign.
Polarity Flip : Resistance has turned into support, and price seems to be holding it for now.
📍 My Take on This Trade
For a swing trader who values structure and confirmation, this setup is about as clean as it gets. The Quarterly Demand Zone is doing the heavy lifting here , giving you that deep, institutional-level context. And the daily breakout? The story is unfolding right in front of us.
I’m bullish on this setup. Entry at CMP 34.83, Place stop-loss just below yesterday's ’s candle low (with a bit of a buffer). First target? The daily supply zone—which could offer a solid 1:2 risk-to-reward. If the rally continues, consider trailing your stop loss to lock in gains. But let’s be real: any setup can fail. Price could easily dip back into the range or break lower. That’s why risk management isn’t optional—it’s essential. This isn’t financial advice—just an analytical perspective for educational purposes.
🧠 Final Thoughts
If the Quarterly chart is your tide, the Daily is just the wave. And right now, both are flowing in the same direction. That’s not the time to hesitate—that’s the time to execute (with proper risk, of course).
✨ “Price reacts where smart money acts. Your job is to listen, not predict.” 🔍
🎯 Remember, it’s not about predicting—it’s about aligning your trades with high-probability setups.
📈 Stay sharp, trade clean, and respect the zones.
Thanks for the read. Got thoughts or questions? Drop them below—I’m always happy to chat charts.
Thanks for the support—keep studying the charts, and keep sharpening your edge. 📈💬
This analysis is for educational purposes only. I’m not a SEBI-registered advisor and this is not a trading or investment recommendation.
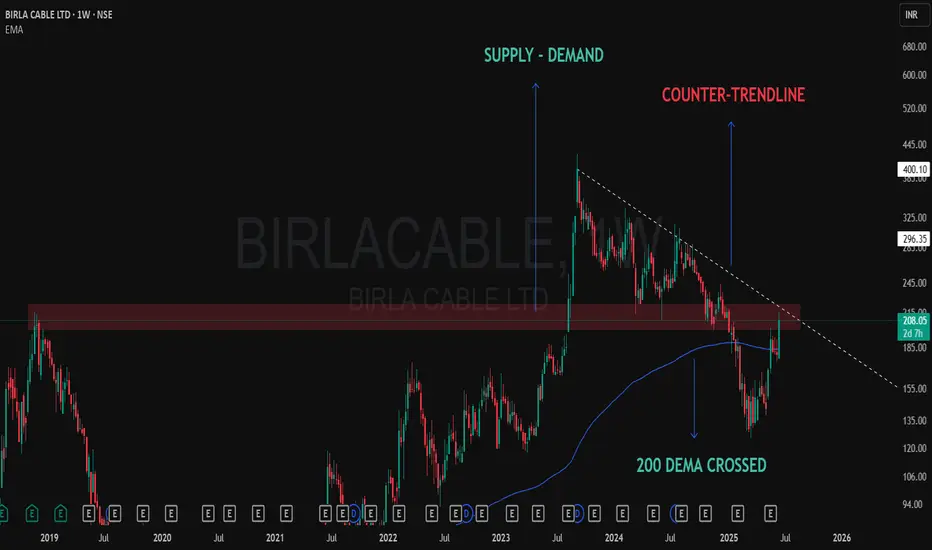
Technical Development on Weekly Chart – Birla Cable📈 BIRLA CABLE – Chart Talking Loud Now!
✅ 200 DEMA crossed
200 Dema was providing solid resistance and now taken out marked with blue line.
❌ At Counter-Trendline
Solid CT thrown from the top of the pattern, dotted white line shows that.
✅ Demand Zone Holding Strong
Clearly shown a solid supply zone which got converted into a Demand only after the Breakout some months back.
After months of consolidation and rejection from the same supply zone… price is now attacking with volume 🔥
🧠 “When structure aligns with emotionless patience, conviction follows.”
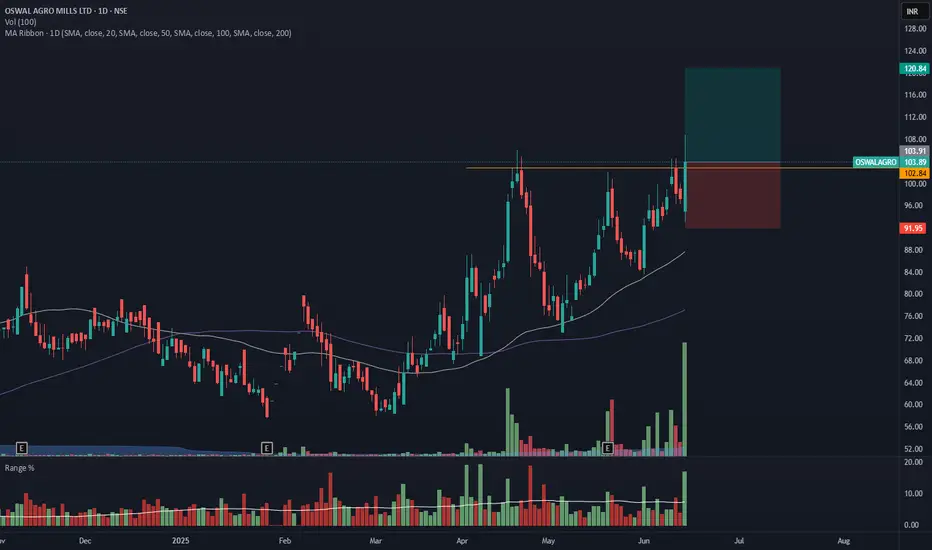
OSWALAGRO - Breakout from DTFOSWALAGRO has resistance weakening on the Daily charts and has given a breakout with good volume.
The target of this pattern signals an upside potential of 15% from the current price level in the medium term.
The stock is trading above its 50- and 100-day exponential moving averages (EMAs). The range is more than >2X, and the Volume is also >10X the average.
CMP- Rs. 104
Est. Entry price ~ 108
Target Price- Rs120 ( 15% upside)
SL -92
Note- The candle closed isn't very promising, so we have to wait for a stronger move.
Disclaimer: This is not a buy/sell recommendation. For educational purpose only. Kindly consult your financial advisor before entering a trade.
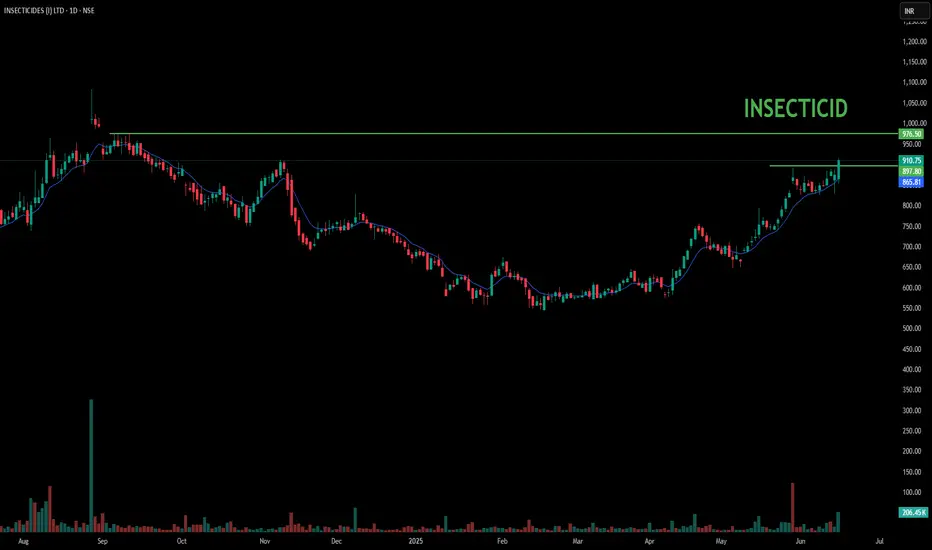
INSECTICIDES - BREAKOUT STOCK📈 Insecticides (India) Ltd – Breakout Stock on the Radar
Insecticides India is currently exhibiting strong technical momentum, supported by high volumes and a confirmed breakout on the charts. The stock has surpassed key resistance levels, indicating potential for short- to medium-term upside. Traders and investors should keep this stock on their watchlist for further price action confirmation.
🔍 Key Observations
Breakout from a consolidation zone
Rising volumes supporting the move
Technical indicators signaling bullish momentum
📌 This update is purely for informational and educational purposes only and not a recommendation to buy or sell any securities. Please do your own research or consult a SEBI-registered advisor before making any investment decisions.
MAXHEALTH | Inverted Head and Shoulder | Breakout | ATH
## 🩺 **MAXHEALTH – Inverted Head and Shoulder Breakout Analysis**
### 📊 **Pattern**:
✅ **Inverted Head and Shoulder** formation confirmed
* Base support near: ₹936
* Breakout zone: ₹1,200
* Current price: ₹1,232.80
* **Volume spike** on breakout = bullish confirmation
---
### 📐 **Breakout Target Calculation**
* Depth of Cup: **₹255.20**
* Target = ₹1,200 + ₹255.20 = **₹1,455.20**
📌 **Target Area marked** on chart near ₹1,455
---
### 🔍 **Key Technical Insights**
* **Resistance turned support**: ₹1,200 zone
* Strong **volume breakout** above resistance
* Handle was short & tight, indicating bullish strength
* RSI likely above 60 (momentum favoring bulls – though not shown here)
---
### 🎯 **Levels to Watch**
* **Support**: ₹1,200 (neckline), then ₹1,120
* **Resistance**: ₹1,300 minor, **₹1,455** is the measured move target
---
### 📈 **Bias**: **Bullish**
* Price + Volume + Pattern = Valid **Breakout**
* Position traders can aim for **₹1,455** with SL ₹1,200
---

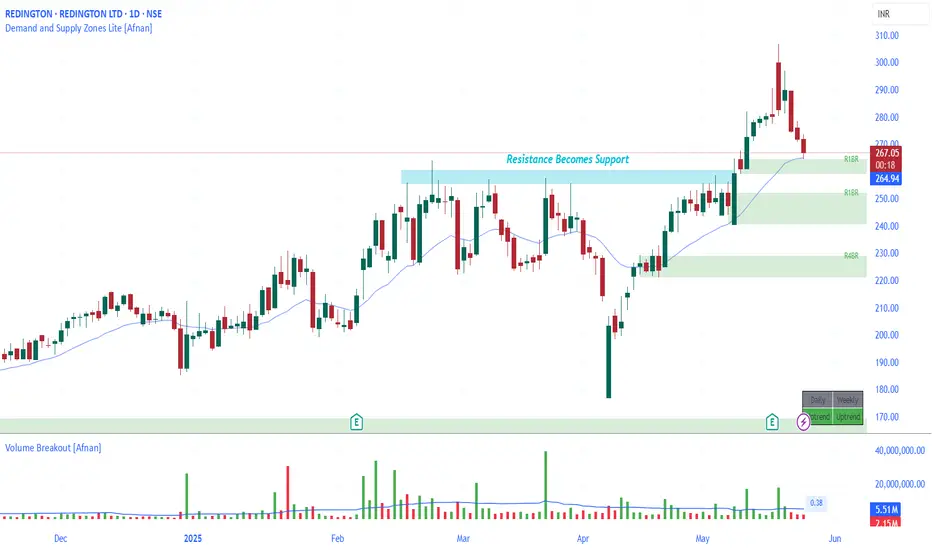
Strong Confluence Setup : REDINGTON at Crucial Demand Zone
REDINGTON is showing signs of a promising technical setup — something that can catch the attention of demand and supply zone traders. Let’s break down the analysis in simple words so that even a beginner can understand why this stock might be at an interesting level.
🔥 The Demand Zone Setup 🔥
The stock is currently hovering around a Rally-Base-Rally demand zone. This is a price area where big institutions may have left pending buy orders before pushing the price higher.
📉 Confluence of EMA and Support Flip
Here’s where the setup gets even more interesting. Apart from the demand zone:
REDINGTON is trading near its 20 EMA — a dynamic support level that often helps price bounce in uptrends.
There was a recent resistance breakout — price struggled to go above a certain level, broke through it with heavy volume, and is now returning to retest that same level.
Resistance turns into support : This classic law of polarity increases the odds of a bounce from here.
💡 Volume Analysis Matters
The breakout candle had heavy volume. Now, as the price pulls back to the demand zone, volume is dropping — this is a healthy sign. It suggests the sellers are weakening and the buyers might soon step in again.
👣 Smart Money Footprints & Pending Orders
Demand zones reflect unfilled institutional orders. If smart money had previously bought here, they may defend this zone to protect their positions. That could mean more buying at this level, pushing the price higher once again.
⚠️ But Wait — Risk Management is Key!
Even high-probability setups can fail — and that’s just the nature of trading. Always use a stop-loss. The goal isn’t to be right all the time — it’s to manage risk smartly and survive long enough to be consistently profitable.
📊 Setup Summary
Price near RBR demand zone Strong case for smart money entry
Confluence of 20 EMA support
Polarity principle : Resistance turned into support
Volume drop on pullback — bullish signal
Always place stop-loss — risk management matters
📌 "In trading, confidence comes from preparation — not prediction."
Lastly, Thank you for your support, your likes & comments. Feel free to ask if you have questions.
⚡ Stay focused, trade smart, and let the charts do the talking! ⚡
This analysis is for educational purposes only and is not intended as a trading or investment recommendation. I am not a SEBI registered analyst.
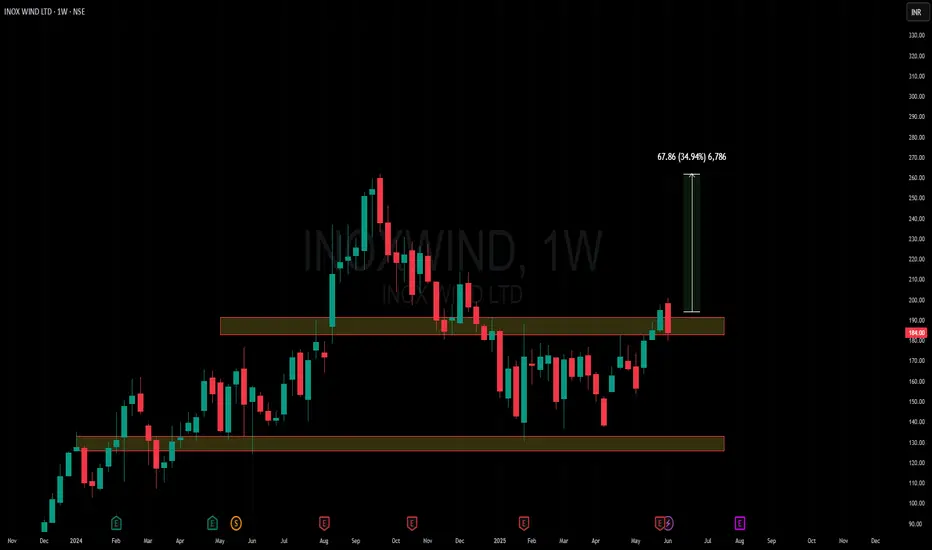
Amazing breakout on WEEKLY Timeframe - INOXWINDCheckout an amazing breakout happened in the stock in Weekly timeframe, macroscopically seen in Daily timeframe. Having a great favor that the stock might be bullish expecting a staggering returns of minimum 25% TGT. IMPORTANT BREAKOUT LEVELS ARE ALWAYS RESPECTED!
NOTE for learners: Place the breakout levels as per the chart shared and track it yourself to get amazed!!
#No complicated chart patterns
#No big big indicators
#No Excel sheet or number magics
TRADE IDEA: WAIT FOR THE STOCK TO BREAKOUT IN WEEKLY TIMEFRAME ABOVE THIS LEVEL.
Checkout an amazing breakout happened in the stock in Weekly timeframe.
Breakouts happening in longer timeframe is way more powerful than the breakouts seen in Daily timeframe. You can blindly invest once the weekly candle closes above the breakout line and stay invested forever. Also these stocks breakouts are lifelong predictions, it means technically these breakouts happen giving more returns in the longer runs. Hence, even when the scrip makes a loss of 10% / 20% / 30% / 50%, the stock will regain and turn around. Once they again enter the same breakout level, they will flyyyyyyyyyyyy like a ROCKET if held in the portfolio in the longer run.
Time makes money, GREEDY & EGO will not make money.
Also, magically these breakouts tend to prove that the companies turn around and fundamentally becoming strong. Also the magic happens when more diversification is done in various sectors under various scripts with equal money invested in each N500 scripts.
The real deal is when to purchase and where to purchase the stock. That is where Breakout study comes into play.
Check this stock which has made an all time low and high chances that it makes a "V" shaped recovery.
> Taking support at last years support or breakout level
> High chances that it reverses from this point.
> Volume dried up badly in last few months / days.
> Very high suspicion based analysis and not based on chart patterns / candle patterns deeply.
> VALUABLE STOCK AVAILABLE AT A DISCOUNTED PRICE
> OPPURTUNITY TO ACCUMULATE ADEQUATE QUANTITY
> MARKET AFTER A CORRECTION / PANIC FALL TO MAKE GOOD INVESTMENT
DISCLAIMER : This is just for educational purpose. This type of analysis is equivalent to catching a falling knife. If you are a warrior, you throw all the knives back else you will be sorrow if it hits SL. Make sure to do your analysis well. This type of analysis only suits high risks investor and whose is willing to throw all the knives above irrespective of any sectoral rotation. BE VERY CAUTIOUS AS IT IS EXTREME BOTTOM FISHING.
HOWEVER, THIS IS HOW MULTIBAGGERS ARE CAUGHT !
STOCK IS AT RIGHT PE / RIGHT EVALUATION / MORE ROAD TO GROW / CORRECTED IV / EXCELLENT BOOKS / USING MARKET CRASH AS AN OPPURTUNITY / EPS AT SKY.
LET'S PUMP IN SOME MONEY AND REVOLUTIONIZE THE NATION'S ECONOMY!
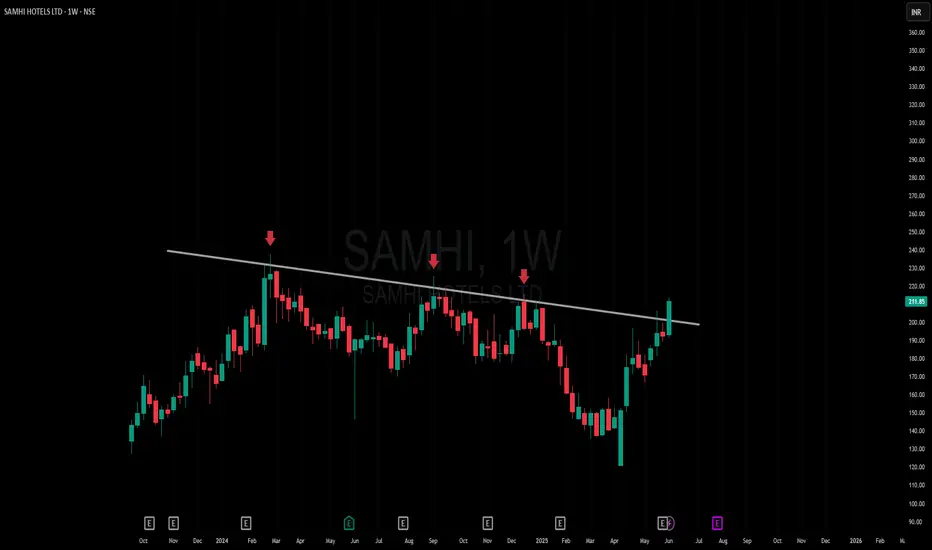
Amazing breakout on WEEKLY Timeframe - SAMHICheckout an amazing breakout happened in the stock in Weekly timeframe, macroscopically seen in Daily timeframe. Having a great favor that the stock might be bullish expecting a staggering returns of minimum 25% TGT. IMPORTANT BREAKOUT LEVELS ARE ALWAYS RESPECTED!
NOTE for learners: Place the breakout levels as per the chart shared and track it yourself to get amazed!!
#No complicated chart patterns
#No big big indicators
#No Excel sheet or number magics
TRADE IDEA: WAIT FOR THE STOCK TO BREAKOUT IN WEEKLY TIMEFRAME ABOVE THIS LEVEL.
Checkout an amazing breakout happened in the stock in Weekly timeframe.
Breakouts happening in longer timeframe is way more powerful than the breakouts seen in Daily timeframe. You can blindly invest once the weekly candle closes above the breakout line and stay invested forever. Also these stocks breakouts are lifelong predictions, it means technically these breakouts happen giving more returns in the longer runs. Hence, even when the scrip makes a loss of 10% / 20% / 30% / 50%, the stock will regain and turn around. Once they again enter the same breakout level, they will flyyyyyyyyyyyy like a ROCKET if held in the portfolio in the longer run.
Time makes money, GREEDY & EGO will not make money.
Also, magically these breakouts tend to prove that the companies turn around and fundamentally becoming strong. Also the magic happens when more diversification is done in various sectors under various scripts with equal money invested in each N500 scripts.
The real deal is when to purchase and where to purchase the stock. That is where Breakout study comes into play.
Check this stock which has made an all time low and high chances that it makes a "V" shaped recovery.
> Taking support at last years support or breakout level
> High chances that it reverses from this point.
> Volume dried up badly in last few months / days.
> Very high suspicion based analysis and not based on chart patterns / candle patterns deeply.
> VALUABLE STOCK AVAILABLE AT A DISCOUNTED PRICE
> OPPURTUNITY TO ACCUMULATE ADEQUATE QUANTITY
> MARKET AFTER A CORRECTION / PANIC FALL TO MAKE GOOD INVESTMENT
DISCLAIMER : This is just for educational purpose. This type of analysis is equivalent to catching a falling knife. If you are a warrior, you throw all the knives back else you will be sorrow if it hits SL. Make sure to do your analysis well. This type of analysis only suits high risks investor and whose is willing to throw all the knives above irrespective of any sectoral rotation. BE VERY CAUTIOUS AS IT IS EXTREME BOTTOM FISHING.
HOWEVER, THIS IS HOW MULTIBAGGERS ARE CAUGHT !
STOCK IS AT RIGHT PE / RIGHT EVALUATION / MORE ROAD TO GROW / CORRECTED IV / EXCELLENT BOOKS / USING MARKET CRASH AS AN OPPURTUNITY / EPS AT SKY.
LET'S PUMP IN SOME MONEY AND REVOLUTIONIZE THE NATION'S ECONOMY!