BUY TODAY SELL TOMORROW for 5%DON’T HAVE TIME TO MANAGE YOUR TRADES?
- Take BTST trades at 3:25 pm every day
- Try to exit by taking 4-7% profit of each trade
- SL can also be maintained as closing below the low of the breakout candle
Now, why do I prefer BTST over swing trades? The primary reason is that I have observed that 90% of the stocks give most of the movement in just 1-2 days and the rest of the time they either consolidate or fall
Cup and Handle Breakout in RICOAUTO
BUY TODAY SELL TOMORROW for 5%
Breakoutsignal

BUY TODAY SELL TOMORROW for 5%DON’T HAVE TIME TO MANAGE YOUR TRADES?
- Take BTST trades at 3:25 pm every day
- Try to exit by taking 4-7% profit of each trade
- SL can also be maintained as closing below the low of the breakout candle
Now, why do I prefer BTST over swing trades? The primary reason is that I have observed that 90% of the stocks give most of the movement in just 1-2 days and the rest of the time they either consolidate or fall
Resistance Breakout in SJS
BUY TODAY SELL TOMORROW for 5%

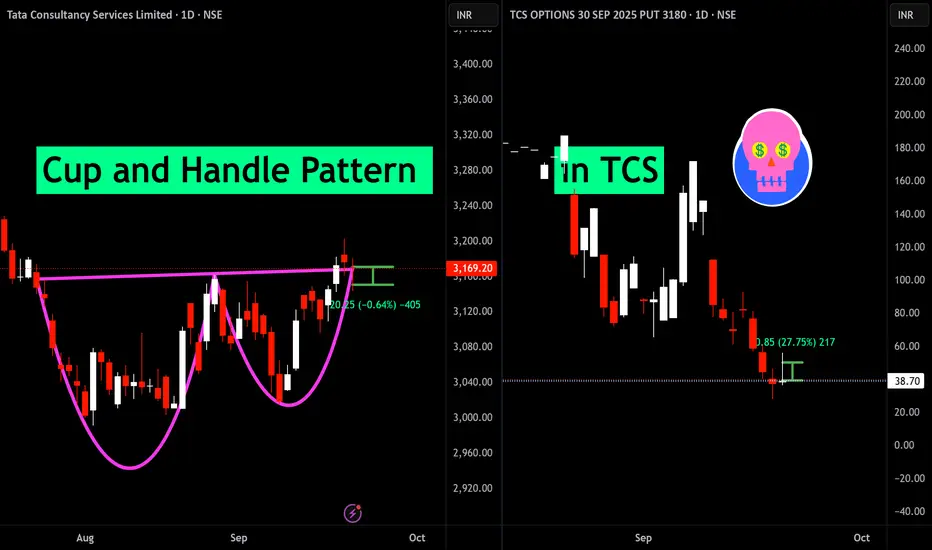
Cup and Handle Pattern failed in TCSThe cup and handle pattern has formed, but the anticipated breakout has not materialized. This failed breakout may indicate the potential for further downside movement in the stock
BUY TODAY SELL TOMORROW for 5%DON’T HAVE TIME TO MANAGE YOUR TRADES?
- Take BTST trades at 3:25 pm every day
- Try to exit by taking 4-7% profit of each trade
- SL can also be maintained as closing below the low of the breakout candle
Now, why do I prefer BTST over swing trades? The primary reason is that I have observed that 90% of the stocks give most of the movement in just 1-2 days and the rest of the time they either consolidate or fall
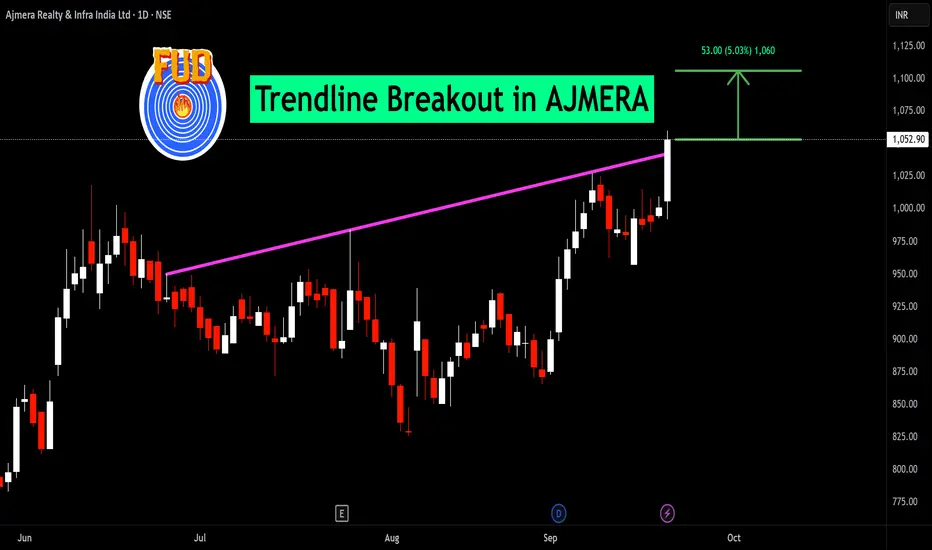
Trendline Breakout in AJMERA
BUY TODAY SELL TOMORROW for 5%
BUY TODAY SELL TOMORROW for 5%DON’T HAVE TIME TO MANAGE YOUR TRADES?
- Take BTST trades at 3:25 pm every day
- Try to exit by taking 4-7% profit of each trade
- SL can also be maintained as closing below the low of the breakout candle
Now, why do I prefer BTST over swing trades? The primary reason is that I have observed that 90% of the stocks give most of the movement in just 1-2 days and the rest of the time they either consolidate or fall
Trendline Breakout in STARCEMENT
BUY TODAY SELL TOMORROW for 5%

BUY TODAY SELL TOMORROW for 5%DON’T HAVE TIME TO MANAGE YOUR TRADES?
- Take BTST trades at 3:25 pm every day
- Try to exit by taking 4-7% profit of each trade
- SL can also be maintained as closing below the low of the breakout candle
Now, why do I prefer BTST over swing trades? The primary reason is that I have observed that 90% of the stocks give most of the movement in just 1-2 days and the rest of the time they either consolidate or fall
Resistance Breakout in STOVEKRAFT
BUY TODAY SELL TOMORROW for 5%

BUY TODAY SELL TOMORROW for 5%DON’T HAVE TIME TO MANAGE YOUR TRADES?
- Take BTST trades at 3:25 pm every day
- Try to exit by taking 4-7% profit of each trade
- SL can also be maintained as closing below the low of the breakout candle
Now, why do I prefer BTST over swing trades? The primary reason is that I have observed that 90% of the stocks give most of the movement in just 1-2 days and the rest of the time they either consolidate or fall
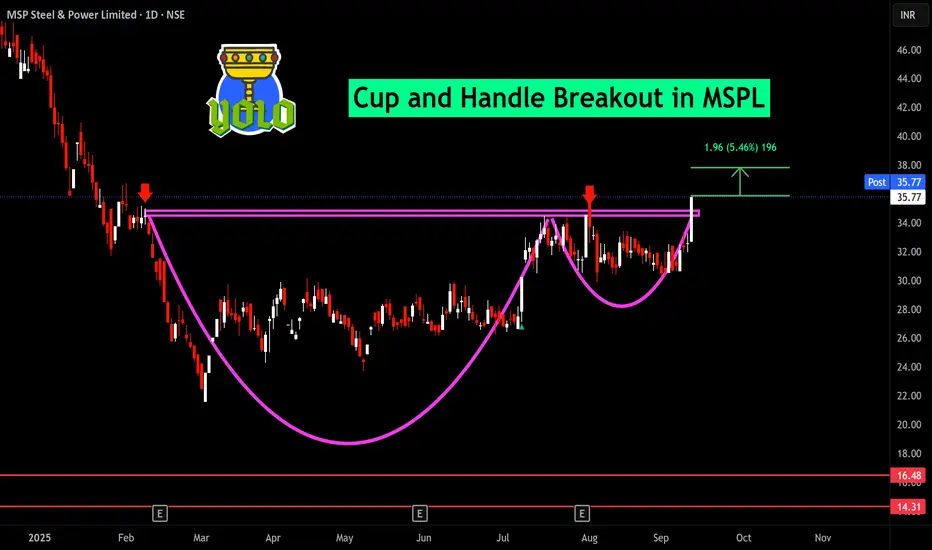
Cup and Handle Breakout in MSPL
BUY TODAY SELL TOMORROW for 5%
BUY TODAY SELL TOMORROW for 5%DON’T HAVE TIME TO MANAGE YOUR TRADES?
- Take BTST trades at 3:25 pm every day
- Try to exit by taking 4-7% profit of each trade
- SL can also be maintained as closing below the low of the breakout candle
Now, why do I prefer BTST over swing trades? The primary reason is that I have observed that 90% of the stocks give most of the movement in just 1-2 days and the rest of the time they either consolidate or fall
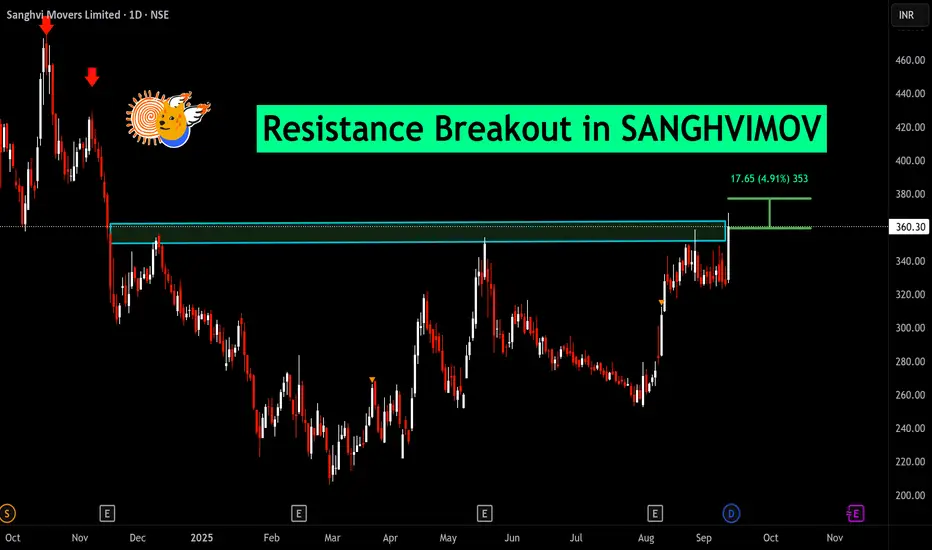
Resistance Breakout in SANGHVIMOV
BUY TODAY SELL TOMORROW for 5%
BUY TODAY SELL TOMORROW for 5%DON’T HAVE TIME TO MANAGE YOUR TRADES?
- Take BTST trades at 3:25 pm every day
- Try to exit by taking 4-7% profit of each trade
- SL can also be maintained as closing below the low of the breakout candle
Now, why do I prefer BTST over swing trades? The primary reason is that I have observed that 90% of the stocks give most of the movement in just 1-2 days and the rest of the time they either consolidate or fall
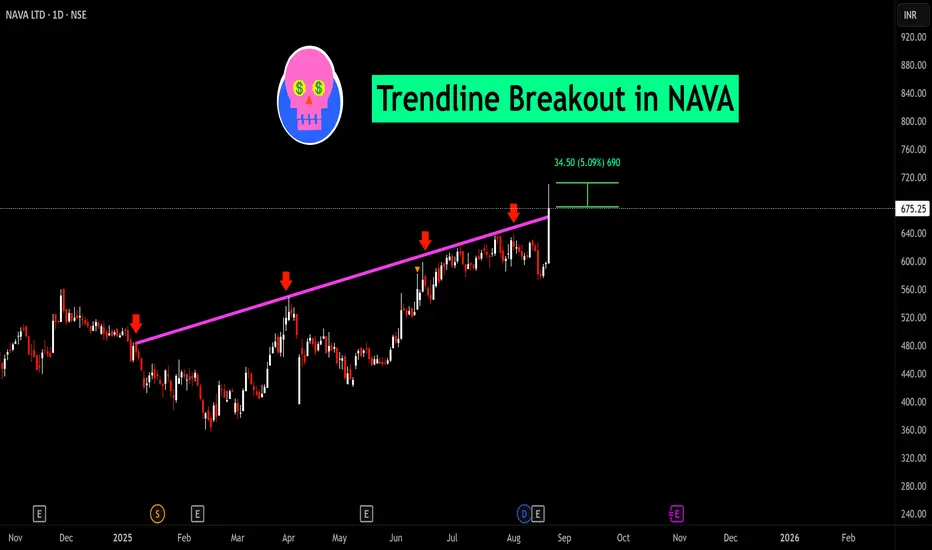
Trendline Breakout in NAVA
BUY TODAY SELL TOMORROW for 5%
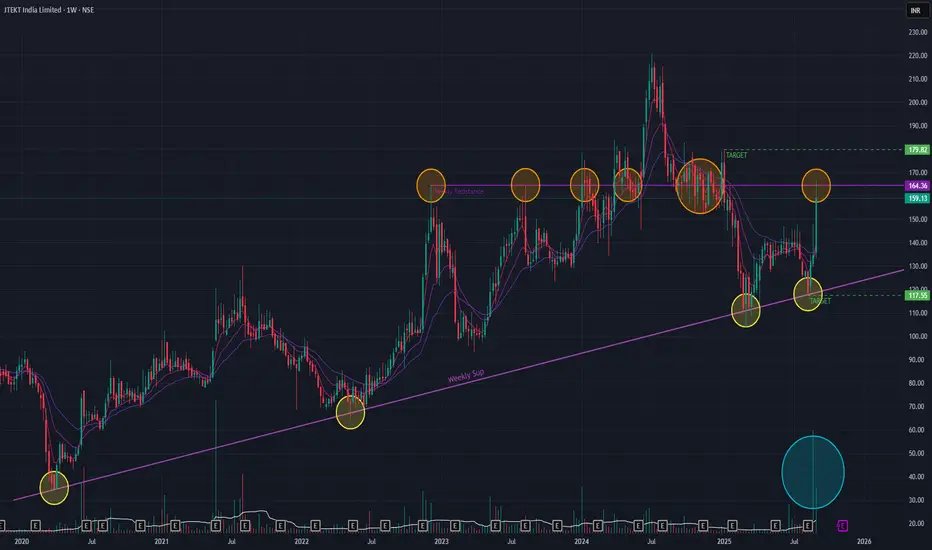
JTEKT India Ltd (Weekly Timeframe) - Potential ATH ??JTEKT is on an uptrend and have been respecting the support trendline as indicated. Since Dec 2022, the stock made several attempts to BreakOut of a major resistance zone and was successful once in Breaking Out and making an All Time High (ATH) in Jun 2024. As of last week the stock surged by 18+ % with huge volume. During this process the short-term EMAs did a positive cross-over. All of these are bullish signals.
During the coming week, if the stock is able to showcase bullish price-action then the stock may reach 179 levels. In a profit booking scenario, we may see the stock go down to 117 levels.
Keep watching for next week's price-action.
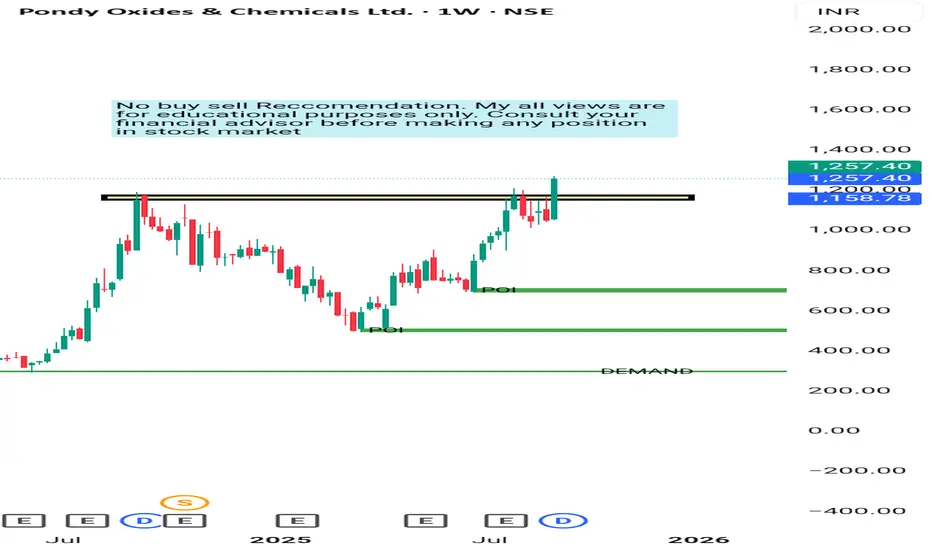
POCL Weekly BREAKOUT For More information Visit my Tradingview Profile .
POCL Given a Rounding Bottom Pattern Breakout on weekly as well as on 1 day chart with good volumes . Company belongs to metal sector and metal sector in uptrend. So we can see 5 -10% good movement from here also in swing trading/holding for some days . 10 - 30 days . Keep Stoploss 5 -6% .
Incorporated in 1995, Pondy Oxides and Chemicals Ltd manufactures Lead Metal and Alloys and other Non-ferrous metals
Key Points
Business Overview:
POCL is in the metallic and non-metallic recycling industry as India’s largest secondary Lead manufacturer in Lead Alloys. Its core product, lead and lead alloys, is mainly used in making lead-acid batteries. Company converts scraps of various forms of Lead, Aluminium, and Copper into Lead Metal, Aluminium Metal, Copper, and its Alloys. It carries out smelting of Lead Battery scrap to produce secondary lead metal, which is further transformed into Pure lead and Specific Lead Alloys. Further, company also manufactures Zinc metal and Zinc Oxide.
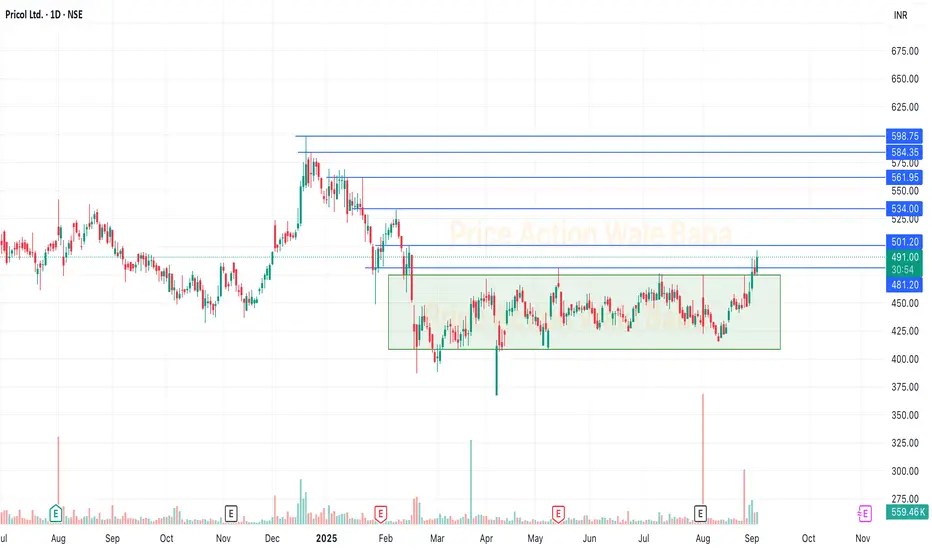
Pricol - Breakout from the Box.Pricol is looks good to buy and hold for the long term.
It has breakout from the box and ready to move up. Once it sustain above 500 than we can see the all target will hit one by one soon.
Target levels are market on the chart.
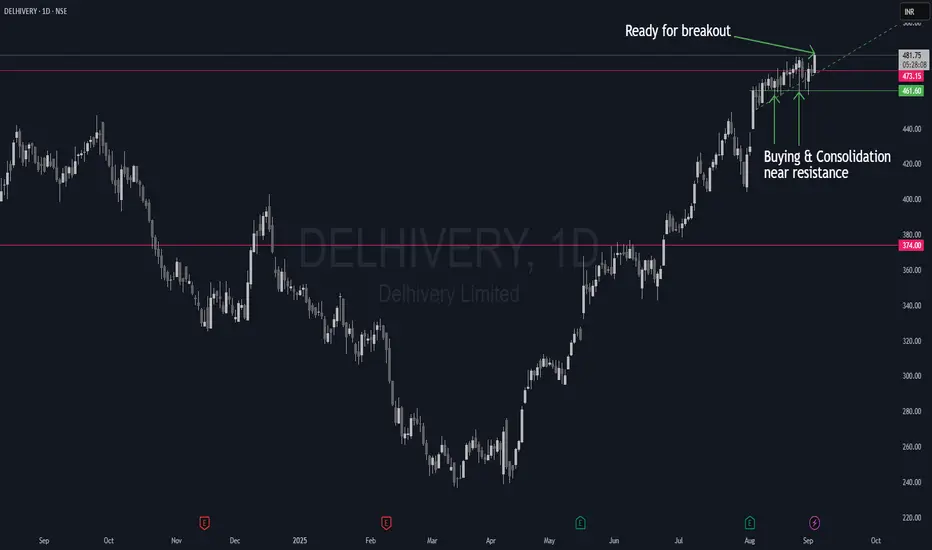
NSE:DELHIVERY - Breakout in progressAfter consolidating at the resistance for over three weeks, the stock is finally ready to launch and break above the resistance.
Entry: Break & Retest of resistance OR pullback to 9EMA/21EMA
SL: 448 (below the consolidation)
Target-1: 510
Target-2: 550
Disclaimer: The idea is for educational purposes only and must not be construed as advice to buy or sell. Consult your investment advisor before making the decision. Investments are subject to market risks.
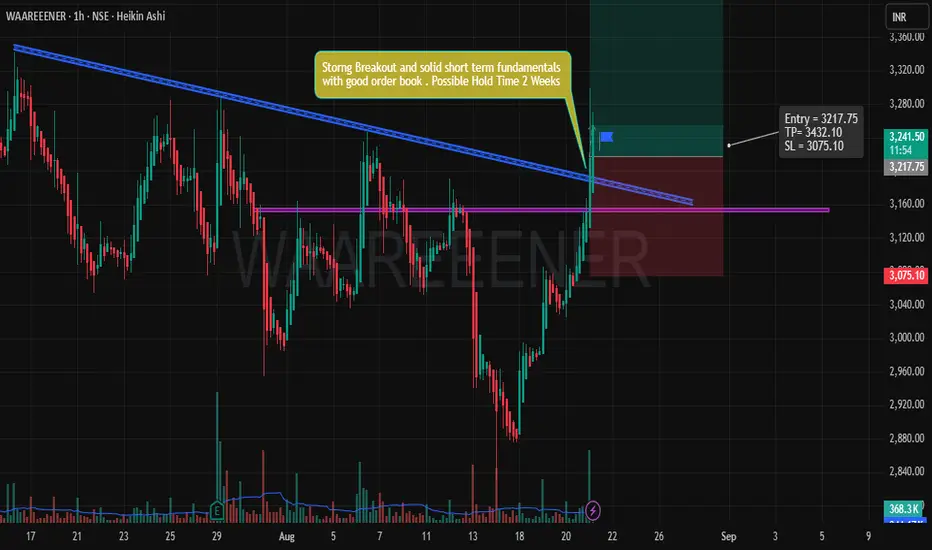
Trade Idea: Bullish Breakout for WAAREEENER (NSE)** IF you like my observation, please boost and follow for more content."
Trade Overview:
Instrument: WAAREEENER
Timeframe: 1-hour chart
Trade Type: Bullish Breakout
Entry Price: ₹3217.75
Stop Loss: ₹3075.10
Take Profit (TP): ₹3432.10
Target Duration: Possible hold time of 2 weeks.
1. Technical Analysis:
Breakout from Resistance:
The price action has shown a clear breakout from the resistance zone, depicted by the purple horizontal line at ₹3120. The breakout was supported by increasing volume, which is an important confirmation of strength in the upward movement. A breakout above this level suggests strong bullish momentum.
Strong Fundamentals:
This breakout is not just a technical move; there are solid short-term fundamentals backing this position. The order book is healthy, indicating strong buying interest at higher levels. Additionally, the current market sentiment seems to favor growth, which aligns well with the price action.
Trend Confirmation:
We’re witnessing a bullish trend confirmation. The current price movement is above the previous highs, which suggests further upward potential. The chart indicates the start of a trend that could continue for the next few weeks, aligning with the projected hold time of 2 weeks.
2. Risk-Reward Setup:
Risk:
The trade is managed with a reasonable stop loss of ₹3075.10. This is placed below the recent low, where the price seems to find support. A stop loss at this level helps protect from large losses in case the breakout fails.
Reward:
The potential reward is set at ₹3432.10, which is well above the breakout level. This level corresponds to a key resistance, and reaching it would offer a solid profit potential. The risk-to-reward ratio of this trade is favorable, providing a good opportunity for risk management.
3. Volume Confirmation:
Volume has been increasing as the price moves higher. This is a strong signal of institutional buying or significant market interest, which further strengthens the case for this breakout to hold and reach the take profit levels.
4. Conclusion:
This is a solid bullish setup based on the breakout above the resistance, accompanied by increasing volume, healthy market sentiment, and strong short-term fundamentals. The risk-reward ratio supports this trade idea, and the target of ₹3432.10 offers a clear upside.
Important Notes:
The trade might be subject to market fluctuations; therefore, ensure to monitor the price action closely.
If the price re-enters the resistance zone or shows signs of weakening, consider adjusting the stop loss or exit strategy accordingly.
BUY TODAY SELL TOMORROW for 5%DON’T HAVE TIME TO MANAGE YOUR TRADES?
- Take BTST trades at 3:25 pm every day
- Try to exit by taking 4-7% profit of each trade
- SL can also be maintained as closing below the low of the breakout candle
Now, why do I prefer BTST over swing trades? The primary reason is that I have observed that 90% of the stocks give most of the movement in just 1-2 days and the rest of the time they either consolidate or fall
Trendline Breakout in ROHLTD
BUY TODAY SELL TOMORROW for 5%

BUY TODAY SELL TOMORROW for 5%DON’T HAVE TIME TO MANAGE YOUR TRADES?
- Take BTST trades at 3:25 pm every day
- Try to exit by taking 4-7% profit of each trade
- SL can also be maintained as closing below the low of the breakout candle
Now, why do I prefer BTST over swing trades? The primary reason is that I have observed that 90% of the stocks give most of the movement in just 1-2 days and the rest of the time they either consolidate or fall
Round Bottom Breakout in APOLLO
BUY TODAY SELL TOMORROW for 5%

Waaree Energies Limited - Near BreakoutIncorporated in December 1990, Waaree Energies Limited is an Indian manufacturer of solar PV modules with an aggregate installed capacity of 12 GW. WEL has five solar module manufacturing facilities in India, with international presence.
Fundamentals:
Market Cap: ₹ 97,343 Cr.
Promoter holding: 64.3 %
FII holding: 2.68 %
DII holding: 2.86 %
Public holding: 30.2 %
Debt: ₹ 1,199 Cr.
Debt 3Years back: ₹ 363 Cr.
Stock looks good on long term holding. Above 3740, All time high breakout and can give more upside movement. Targets are in the chart.

BUY TODAY SELL TOMORROW for 5%DON’T HAVE TIME TO MANAGE YOUR TRADES?
- Take BTST trades at 3:25 pm every day
- Try to exit by taking 4-7% profit of each trade
- SL can also be maintained as closing below the low of the breakout candle
Now, why do I prefer BTST over swing trades? The primary reason is that I have observed that 90% of the stocks give most of the movement in just 1-2 days and the rest of the time they either consolidate or fall
Resistance Breakout in SUMMITS
BUY TODAY SELL TOMORROW for 5%

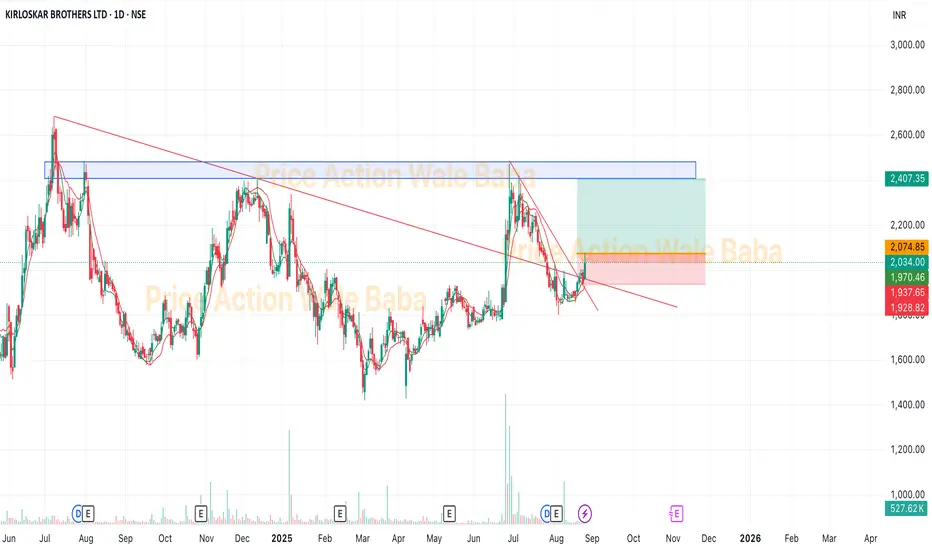
KIRLOSBROS - BreakoutKIRLOSBROS has a breakout and ready to move up.
Market Cap: ₹ 16,140 Cr.
Promoter holding: 66.0 %
FII holding: 6.27 %
DII holding" 9.79 %
Public holding: 18.0 %
Debt: ₹ 182 Cr.
Debt 3Years back: ₹ 396 Cr.
Company is fundamentally very strong. Also DII and FII buying this stock.
Good to buy and hold for the long term.
Soon we can see 2400.
BUY TODAY SELL TOMORROW for 5%DON’T HAVE TIME TO MANAGE YOUR TRADES?
- Take BTST trades at 3:25 pm every day
- Try to exit by taking 4-7% profit of each trade
- SL can also be maintained as closing below the low of the breakout candle
Now, why do I prefer BTST over swing trades? The primary reason is that I have observed that 90% of the stocks give most of the movement in just 1-2 days and the rest of the time they either consolidate or fall
Cup and Handle Breakout in GEPIL
BUY TODAY SELL TOMORROW for 5%

BUY TODAY SELL TOMORROW for 5%DON’T HAVE TIME TO MANAGE YOUR TRADES?
- Take BTST trades at 3:25 pm every day
- Try to exit by taking 4-7% profit of each trade
- SL can also be maintained as closing below the low of the breakout candle
Now, why do I prefer BTST over swing trades? The primary reason is that I have observed that 90% of the stocks give most of the movement in just 1-2 days and the rest of the time they either consolidate or fall
Resistance Breakout in TGVSL
BUY TODAY SELL TOMORROW for 5%

BUY TODAY SELL TOMORROW for 5%DON’T HAVE TIME TO MANAGE YOUR TRADES?
- Take BTST trades at 3:25 pm every day
- Try to exit by taking 4-7% profit of each trade
- SL can also be maintained as closing below the low of the breakout candle
Now, why do I prefer BTST over swing trades? The primary reason is that I have observed that 90% of the stocks give most of the movement in just 1-2 days and the rest of the time they either consolidate or fall
Trendline Breakout in GPIL
BUY TODAY SELL TOMORROW for 5%

BUY TODAY SELL TOMORROW for 5%DON’T HAVE TIME TO MANAGE YOUR TRADES?
- Take BTST trades at 3:25 pm every day
- Try to exit by taking 4-7% profit of each trade
- SL can also be maintained as closing below the low of the breakout candle
Now, why do I prefer BTST over swing trades? The primary reason is that I have observed that 90% of the stocks give most of the movement in just 1-2 days and the rest of the time they either consolidate or fall
Trendline Breakout in GODFRYPHLP
BUY TODAY SELL TOMORROW for 5%
