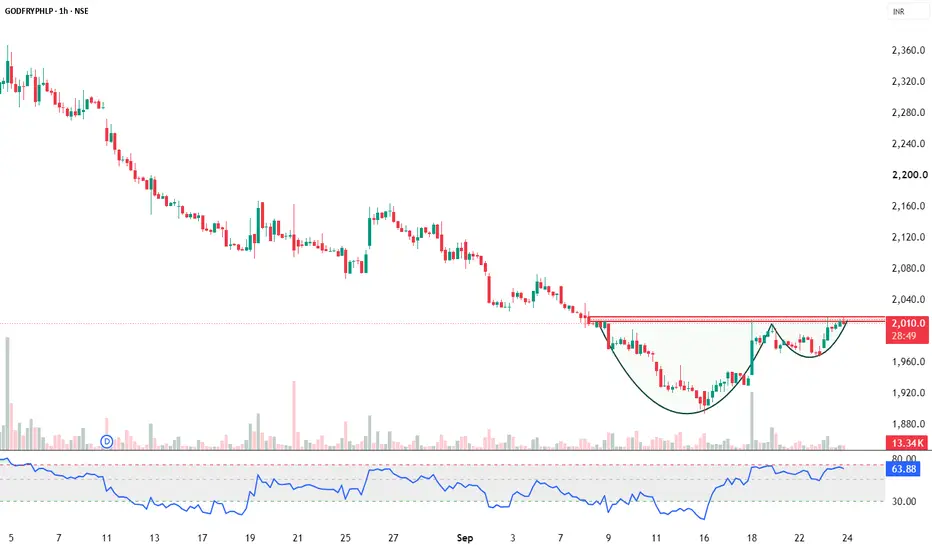
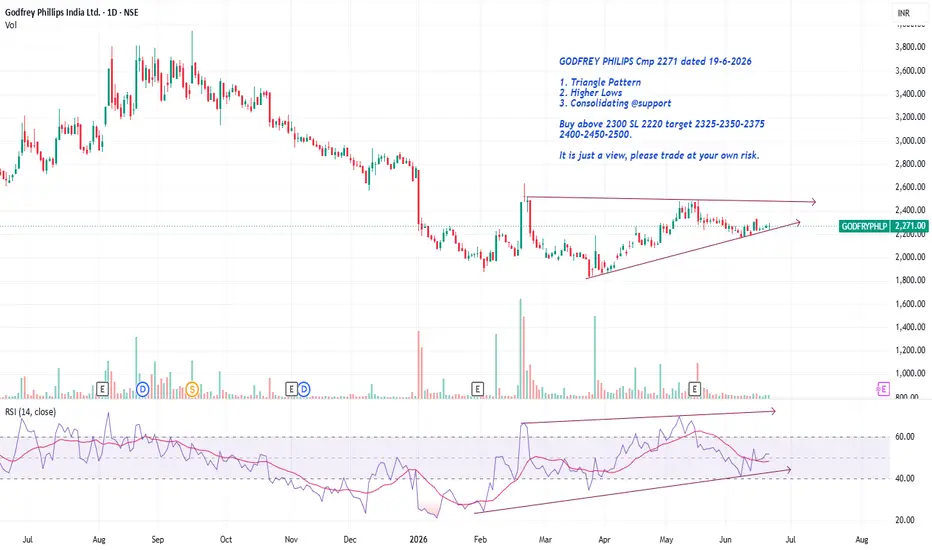
Godfrey Phillips India - Cup with handleGodfrey Phillips India is forming a Cup & Handle pattern near the bottom, indicating a potential bullish reversal setup. Price is testing the neckline around 2,015–2,020. A sustained close above the neckline, supported by higher volume and a small/no upper shadow, may confirm the breakout. RSI near
Godfrey Phillips India Ltd.
No trades
No trades
Compare with Godfrey Phillips India Ltd.
87.7 INR
15.26 B INR
63.87 B INR
41.29 M
Next report date
—
Report period
—
EPS estimate
—
Revenue estimate
—
Company info
Sector
Industry
Website
Headquarters
New Delhi
Founded
1936
IPO date
Dec 5, 1994
ISIN
INE260B01028
FIGI
BBG000CRPMG3
Identifiers
ISIN INE260B01028
Godfrey Phillips India Ltd. operates as a holding company. It engages in the manufacture and marketing of tobacco related products. The firm operates through the following segments: Cigarette, Tobacco and Related Products, and Retail and Related Products. Its cigarette brands include Marlboro, Red & White, Cavanders, Four Square, Stellar, and North Pole and Tipper. The company was founded on December 3, 1936 and is headquartered in New Delhi, India.
GODFREY PHILLIPS INDIA (GODFRYPHLP) — Ascending Channel Support 1. Technical Perspective
Time Frame Analysis (Daily): On the daily chart, Godfrey Phillips India continues to operate within a well-defined, multi-year ascending channel characterized by a persistent sequence of Higher Highs (HH) and Higher Lows (HL).
Channel Support Test: Following a extended retr
GODFRYPHLP: Bullish Momentum BuildsGodfrey Phillips has staged a strong recovery after finding support near the lower boundary of its long-term ascending channel, signalling that buyers have regained control. The recent impulsive rally suggests the corrective phase has likely ended, with the stock now approaching a key resistance aro
Weekly TF AnalysisTeam,
On the weekly timeframe, I’m watching two weak order blocks whose liquidity has yet to be swept:
First Pullback OB: 1850
Second Pullback OB: 1654
The liquidity sitting below both levels remains a key area of interest.
OB Swing Low at 1363 level is also crucial being weak OB. However, d
Godfrey Phillips India Stock Analysis📈 Godfrey Phillips India Ltd. | Falling Trendline Breakout | Bullish Reversal?
A falling trendline bullish reversal appears to be developing as price breaks above a well-defined descending trendline after forming a series of lower highs. This breakout suggests that selling pressure may be weakening
Smart Money Action: Godfrey₹2,035 sits precisely at the MIDPOINT of the Jan–Feb 2026 liquidity cluster (₹2,059–₹2,010). These two swing lows were tested and cleared — they are old sell-side liquidity that has NOT been revisited since being swept. Price has memory for these levels.
₹2,035 is the LAST daily-structure level bef
Godfrey Phillips India Ltd. — Multi-Year Bullish Structure## Godfrey Phillips India Ltd. — Multi-Year Bullish Structure Intact
Godfrey Phillips appears to be setting up for a strong bullish continuation move after completing a deep corrective phase within a long-term rising channel structure.
On the weekly chart, price has respected the broader ascending
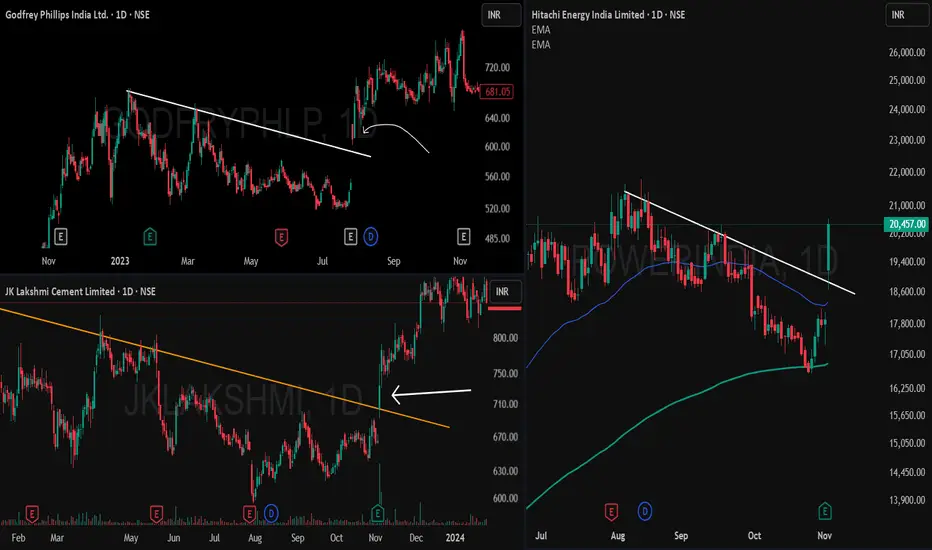
Breakaway Gap Up Breakout — A Powerful StudyThis post analyzes breakaway gap up breakouts with multiple chart examples, illustrating how price leaps above well-tested trendline resistance without a retest, triggering strong upward momentum.
Main Report
What is a Breakaway Gap Up Breakout?
A breakaway gap up breakout occurs when the price gap
See all ideas
Summarizing what the indicators are suggesting.
Oscillators
Neutral
Oscillators
Neutral
Summary
Neutral
Summary
Neutral
Summary
Neutral
Moving Averages
Neutral
Moving Averages
Neutral
Displays a symbol's price movements over previous years to identify recurring trends.
Weight0.19%
Market value360.58 K
Weight0.05%
Market value295.66 K
Weight0.24%
Market value202.60 K
Explore more ETFs
Frequently asked questions
The current price of GODFRYPHLP is 1,791.8 INR — it has increased by 2.38% in the past 24 hours. Watch Godfrey Phillips India Ltd. stock price performance more closely on the chart.
Depending on the exchange, the stock ticker may vary. For instance, on NSE exchange Godfrey Phillips India Ltd. stocks are traded under the ticker GODFRYPHLP.
GODFRYPHLP stock has fallen by −4.15% compared to the previous week, the month change is a −9.79% fall, over the last year Godfrey Phillips India Ltd. has showed a −46.01% decrease.
GODFRYPHLP reached its all-time high on Sep 16, 2025 with the price of 3,947.0 INR, and its all-time low was 15.6 INR and was reached on Sep 17, 2001. View more price dynamics on GODFRYPHLP chart.
See other stocks reaching their highest and lowest prices.
GODFRYPHLP stock is 3.05% volatile and has beta coefficient of 1.31. Track Godfrey Phillips India Ltd. stock price on the chart and check out the list of the most volatile stocks — is Godfrey Phillips India Ltd. there?
Today Godfrey Phillips India Ltd. has the market capitalization of 282.67 B, it has decreased by −0.05% over the last week.
Yes, you can track Godfrey Phillips India Ltd. financials in yearly and quarterly reports right on TradingView.
Godfrey Phillips India Ltd. is going to release the next earnings report on Nov 17, 2026. Keep track of upcoming events with our Earnings Calendar.
GODFRYPHLP net income for the last quarter is 1.98 B INR, while the quarter before that showed 5.21 B INR of net income which accounts for 0.00% change. Track more Godfrey Phillips India Ltd. financial stats to get the full picture.
Yes, GODFRYPHLP dividends are paid semi-annually. The last dividend per share was 33.00 INR. As of today, Dividend Yield (TTM)% is 2.76%. Tracking Godfrey Phillips India Ltd. dividends might help you take more informed decisions.
Godfrey Phillips India Ltd. dividend yield was 2.67% in 2025, and payout ratio reached 51.11%. The year before the numbers were 1.40% and 45.94% correspondingly. See high-dividend stocks and find more opportunities for your portfolio.
As of Oct 12, 2026, the company has 1.12 K employees. See our rating of the largest employees — is Godfrey Phillips India Ltd. on this list?
EBITDA measures a company's operating performance, its growth signifies an improvement in the efficiency of a company. Godfrey Phillips India Ltd. EBITDA is 14.29 B INR, and current EBITDA margin is 25.18%. See more stats in Godfrey Phillips India Ltd. financial statements.
Like other stocks, GODFRYPHLP shares are traded on stock exchanges, e.g. Nasdaq, Nyse, Euronext, and the easiest way to buy them is through an online stock broker. To do this, you need to open an account and follow a broker's procedures, then start trading. You can trade Godfrey Phillips India Ltd. stock right from TradingView charts — choose your broker and connect to your account.
Investing in stocks requires a comprehensive research: you should carefully study all the available data, e.g. company's financials, related news, and its technical analysis. So Godfrey Phillips India Ltd. technincal analysis shows the sell today, and its 1 week rating is sell. Since market conditions are prone to changes, it's worth looking a bit further into the future — according to the 1 month rating Godfrey Phillips India Ltd. stock shows the sell signal. See more of Godfrey Phillips India Ltd. technicals for a more comprehensive analysis.