Granules India: Breakout Confirmed, Long Opportunity EmergesAnalysis:
The chart of Granules India on TradingView suggests a promising breakout opportunity, potentially signaling a long entry chance for traders. Let's analyze the details based on the information provided on chart.
Current Price: ₹455.75, above the old year resistance level of ₹436.20 marked by the orange line.
Breakout Confirmation: The recent surge past the resistance zone, accompanied by strong volume, confirms a potential trend reversal from resistance to support.
Uptrend Momentum: The sustained price increase after the breakout indicates continuing buying pressure, hinting at further upside potential.
Trading Strategies:
Aggressive:
Enter long if the price closes and sustains above the current level (₹455.75) with continued buying volume.
Implement a stop-loss order below the breakout level (₹436.20) to manage risk.
Potential target prices could be ₹480 and ₹505 based on chart patterns and Fibonacci extensions
Conservative:
Wait for a potential pullback towards the breakout level (₹436.20) or within the previous consolidation zone (₹410-₹430) (highlighted in the image).
Enter long if the price finds support at the pullback zone and exhibits bullish reversal signs (e.g., hammer candlestick pattern).
Utilize a stop-loss order below the pullback low for effective risk management.
Additional Considerations:
The stock market is volatile, and breakouts can sometimes fail.
Conduct your own fundamental research to assess Granules India's financial health, industry outlook, and future prospects before making investment decisions.
Manage your risk effectively using stop-loss orders and appropriate position sizing.
Disclaimer: This analysis is for educational purposes only and should not be considered financial advice. Please do your own research before making any investment decisions.
Breakoutsignal

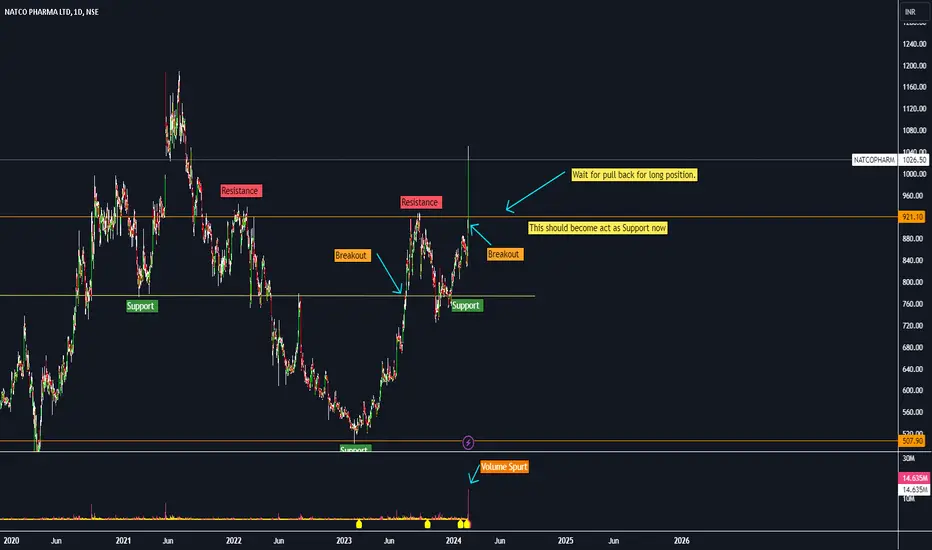
Natco Pharma: Sustained Breakout or Pullback Retest?Analysis:
The chart of Natco Pharma Ltd. on TradingView depicts an intriguing post-breakout scenario, presenting both potential long entry and cautious approaches for traders. Let's dissect the situation:
Current Price : ₹1026.50, well above the multi-year resistance level of ₹921.10 marked by the orange line.
Breakout Confirmation: The recent surge past the resistance zone, accompanied by strong volume, confirms a potential trend reversal from resistance to support.
Uptrend Momentum: The sustained price increase after the breakout indicates continued buying pressure, suggesting further upside potential.
However, a crucial question arises:
Has the breakout momentum exhausted, or is a pullback retest imminent?
Aggressive:
Option 1 (Immediate Long): Enter long if the price closes and sustains above the current level (₹1026.50) with persistent buying volume. This aggressive approach assumes the uptrend will continue.
Option 2 (Breakout Confirmation): Enter long only if the price retests and decisively breaks above the breakout level (₹921.10) with renewed buying volume. This option waits for confirmation before committing.
Conservative:
Wait for Pullback: Wait for a potential pullback towards the breakout level (₹921.10) or within the previous consolidation zone (₹850-₹920).
Enter long only if the price finds support at the pullback zone and exhibits bullish reversal signs (e.g., hammer candlestick pattern). This approach prioritizes minimizing risk by waiting for confirmation.
Additional Considerations:
The stock market is inherently volatile, and even confirmed breakouts can experience pullbacks.
Conduct thorough fundamental research to assess Natco Pharma's financial health, industry outlook, and future prospects before making investment decisions.
Implement prudent risk management through stop-loss orders and appropriate position sizing.
Disclaimer: This analysis is for educational purposes only and should not be considered financial advice. Please conduct your own research before making any investment decisions.
Apollo Pipes: Breakout on the Horizon, Potential Long Entry Analysis:
The chart of Apollo Pipes Ltd. on TradingView suggests a potential upward breakout, offering a possible long entry opportunity. Here's a breakdown:
Current Price : ₹743.35, above the multi-day resistance level of ₹727.20 marked by the blue line.
Breakout Potential: The price is attempting to break above the resistance level, with increased volume supporting the uptrend. If this breakout is confirmed, it could signal a trend reversal and further price appreciation.
Trading Strategies:
Aggressive:
Enter long if the price closes and sustains above the breakout level (₹727.20) with continued buying volume.
Set a stop-loss order below the breakout level to manage risk.
Potential target prices could be ₹780 and ₹820 based on chart patterns and Fibonacci extensions.
Conservative:
Wait for a potential pullback towards the breakout level (₹727.20) or within the previous consolidation zone (₹680-₹720).
Enter long if the price finds support at the pullback zone and shows signs of bullish reversal (e.g., hammer candlestick pattern).
Utilize a stop-loss order below the pullback low for effective risk management.
Additional Considerations:
The stock market is volatile, and breakouts can sometimes fail.
Conduct your own fundamental analysis to assess Apollo Pipes' financial health, industry outlook, and future prospects before making investment decisions.
Manage your risk effectively using stop-loss orders and appropriate position sizing.
Disclaimer: This analysis is for educational purposes only and should not be considered financial advice. Please do your own research before making any investment decisions

LUMAXTECH Pyramiding on profitable position set up1. Trend: Bullish
2. Set up: Fresh breakout
3. Breakout: after 5 months consolidation
4. RR is lucrative

Amazing breakout on Weekly / Daily Timeframe - BOSCHLTD Checkout an amazing breakout happened in the stock in Weekly timeframe, macroscopically seen in Daily timeframe. Having a great favour that the stock might be bullish expecting a staggering returns of minimum 25% TGT. IMPORTANT BREAKOUT LEVELS ARE ALWAYS RESPEECTED!
NOTE for learners: Place the breakout levels as per the chart shared and track it yourself to get amazed!!
#No complicated chart patterns
#No big big indicators
#No Excel sheet or number magics
TRADE IDEA: WAIT FOR THE STOCK TO BREAKOUT IN LOWER TIMEFRAME AND RETRACE IF NEEDED. SL IS NEARER SUPPORT ZONE IN Daily TIMEFRAME.
PS: No new Nifty500 script can escape from me when making a breakout. :-)

Amazing breakout on Weekly / Daily Timeframe - AARTIINDCheckout an amazing breakout happened in the stock in Weekly timeframe, macroscopically seen in Daily timeframe. Having a great favour that the stock might be bullish expecting a staggering returns of minimum 25% TGT. IMPORTANT BREAKOUT LEVELS ARE ALWAYS RESPEECTED!
NOTE for learners: Place the breakout levels as per the chart shared and track it yourself to get amazed!!
#No complicated chart patterns
#No big big indicators
#No Excel sheet or number magics
TRADE IDEA: WAIT FOR THE STOCK TO BREAKOUT IN LOWER TIMEFRAME AND RETRACE IF NEEDED. SL IS NEARER SUPPORT ZONE IN Daily TIMEFRAME.
PS: No new Nifty500 script can escape from me when making a breakout. :-)

IRCTC trading opportunity coming up1. Good base buildup since Oct 2021
2. Market trend isbullish
3. Railway stocks are bullish
4. Breakout of Trend line
5. Risk to reward is lucrative.

Wipro Emerges from AccumulationWipro successfully breaks out of its accumulation phase, which lasted from June 2022 to December 2023, and shows a strong retracement to the Fibonacci level of 61.80%. A clear target is now in sight, and the momentum continues.

Parag Milk Foods: Multi-Year Breakout on the HorizonAnalysis:
The chart of Parag Milk Foods on Trading View suggests a potential multi-year breakout opportunity, offering a long entry chance for traders. Here's a breakdown
Current Price : ₹280.55, above the key resistance level of ₹260.50 marked by the orange dotted line on the chart.
Breakout Potential : The price is attempting to break above this critical resistance level, which has held strong for several years. If this breakout is confirmed, it could signal a significant trend reversal and pave the way for further upside potential.
Trading Strategies:
Aggressive:
Enter long if the price closes and sustains above the breakout level (₹260.50) with continued buying volume.
Set a stop-loss order below the breakout level to manage risk.
Potential target prices could be ₹300 and ₹320 based on chart patterns and Fibonacci extensions.
Conservative:
Wait for a potential pullback towards the breakout level (₹260.50) or within the previous consolidation zone (₹240-₹260).
Enter long if the price finds support at the pullback zone and shows signs of bullish reversal (e.g., hammer candlestick pattern).
Utilize a stop-loss order below the pullback low for effective risk management.
Additional Considerations:
The stock market is inherently volatile, and breakouts can sometimes fail.
Conduct your own fundamental analysis to assess Parag Milk Foods' financial health, industry outlook, and future prospects before making investment decisions.
Manage your risk effectively using stop-loss orders and appropriate position sizing.
Disclaimer: This analysis is for educational purposes only and should not be considered financial advice. Please do your own research before making any investment decisions

SMS Pharmaceuticals: Long Opportunity After Multi-Year BreakoutAnalysis:
The provided chart of SMS Pharmaceuticals (SMS Pharma) on TradingView reveals a potentially lucrative breakout opportunity. Let's break it down:
Current Price: ₹145.45, comfortably above the multi-year resistance level of ₹136 marked by the blue line.
Breakout Confirmation: The recent surge past the resistance zone, accompanied by strong volume, suggests a potential trend reversal from resistance to support.
Uptrend Momentum: The sustained price increase after the breakout indicates continued buying pressure, hinting at further upside potential.
Trading Strategies:
Aggressive:
Enter long if the price closes and sustains above the current level (₹145.45) with persistent buying volume.
Implement a stop-loss order below the breakout level (₹130 ) to manage risk.
Potential target prices could be ₹160 and ₹175 based on chart patterns and Fibonacci extensions.
Conservative:
Wait for a potential pullback towards the breakout level (₹136) or within the previous consolidation zone (₹120-₹136).
Enter long if the price finds support at the pullback zone and exhibits bullish reversal signs (e.g., hammer candlestick pattern).
Utilize a stop-loss order below the pullback low for effective risk management
Additional Considerations:
While technical analysis is insightful, remember that the stock market remains inherently volatile.
Conduct thorough fundamental research to assess SMS Pharma's financial health, industry outlook, and future prospects before making investment decisions.
Implement prudent risk management through stop-loss orders and appropriate position sizing.
Disclaimer: This analysis is for educational purposes only and should not be considered financial advice. Please conduct your own research before making any investment decisions.

BOROSIL RENEWABLESBOROSILRENEW is Breaking out from a range after a long period and the stock is getting ready for absolute stunning rally in the coming months. Targets are punched in the chart.
NOTE: I'm not a SEBI REG. Study before investing.

Ipo1) stock at life time high level
2) stock at above it's sentimental resistance
3) stock having beutiful rounding bottom pattern breakout
4) look at volume
5) volume building from last 4-5 months


ADANIPOWER BREAKOUT | SWING TRADEBreakout in Adani Power
Target - 680
Note - only for education purpose

CDSL Breakout | Swing TradeCDSL Breakout
Above 2004 We will see rally in this stock
SL Should be Below -1897
Note - Only for education purpose

HCLTECH Trade plan for coming weeks1. ATH Breakout - Confirmed
2. Potential Target 1921+
3. Trend Bullish
4. Market Trend - Bullish

This stock can fly after breakout!Redington has been forming an inverted head and shoulder pattern from the past 2 years.
A weekly closing above 200 will confirm the breakout which will unlock huge targets for the stock.
This stock has nice fundamentals with a good dividend yield so one can consider this stock for long term investment as well.
Keep this stock in watchlist as the rejection in previous week is due to dividend correction.
Idea shared for educational purposes.

KAS/USDT Bull flag chart analysis$KASPA Bull Flag Setting Up Next Major Move?
1. #KASPA forming bull flag on the daily!
2. If it breaks resistance at $0.11, the Technical target is 200% upside!
3. This would extend its epic 1200% 16-month bull run.
4. Bull flag support held at $0.08 so risk/reward looks juicy for a long position on a break above $0.11 Resistance.
5. Parabolic upside ahead if Kaspa breaks out here.
#Altcoins

India Tourism Dev: Uptrend Beckons After Multi-Year BreakoutAnalysis:
The provided chart of India Tourism Dev (ITDC) on TradingView depicts a promising breakout opportunity. Let's delve into the details:
Current Price: ₹838.90, significantly above the multi-year resistance level of ₹715.00 marked by the blue line.
Breakout Confirmation: The recent surge past the resistance zone, accompanied by strong volume, signifies a potential trend reversal from resistance to support.
Uptrend Momentum: The sustained price increase after the breakout indicates continued buying pressure, suggesting further upside potential.
Trading Strategies:
Aggressive:
Enter long if the price closes and sustains above the current level (₹838.90) with persistent buying volume.
Implement a stop-loss order below the breakout level (₹715.00) to manage risk.
Potential target prices could be ₹880 and ₹920 based on chart patterns and Fibonacci extensions.
Conservative:
Wait for a potential pullback towards the breakout level (₹715.00) or within the previous consolidation zone (₹600-₹715.00).
Enter long if the price finds support at the pullback zone and exhibits bullish reversal signs (e.g., hammer candlestick pattern).
Utilize a stop-loss order below the pullback low for effective risk management.
Additional Considerations:
While technical analysis is insightful, remember that the stock market remains inherently volatile.
Conduct thorough fundamental research to assess ITDC's financial health, industry outlook, and future prospects before making investment decisions.
Implement prudent risk management through stop-loss orders and appropriate position sizing.
Disclaimer: This analysis is for educational purposes only and should not be considered financial advice. Please conduct your own research before making any investment decisions.

Amazing breakout on Weekly / Daily Timeframe - UCOBANKCheckout an amazing breakout happened in the stock in Weekly timeframe, macroscopically seen in Daily timeframe. Having a great favour that the stock might be bullish expecting a staggering returns of minimum 25% TGT. IMPORTANT BREAKOUT LEVELS ARE ALWAYS RESPEECTED!
NOTE for learners: Place the breakout levels as per the chart shared and track it yourself to get amazed!!
#No complicated chart patterns
#No big big indicators
#No Excel sheet or number magics
TRADE IDEA: WAIT FOR THE STOCK TO BREAKOUT IN LOWER TIMEFRAME AND RETRACE IF NEEDED. SL IS NEARER SUPPORT ZONE IN Daily TIMEFRAME.
PS: No new Nifty500 script can escape from me when making a breakout. :-)

Amazing breakout on Weekly / Daily Timeframe - CENTRALBKCheckout an amazing breakout happened in the stock in Weekly timeframe, macroscopically seen in Daily timeframe. Having a great favour that the stock might be bullish expecting a staggering returns of minimum 25% TGT. IMPORTANT BREAKOUT LEVELS ARE ALWAYS RESPEECTED!
NOTE for learners: Place the breakout levels as per the chart shared and track it yourself to get amazed!!
#No complicated chart patterns
#No big big indicators
#No Excel sheet or number magics
TRADE IDEA: WAIT FOR THE STOCK TO BREAKOUT IN LOWER TIMEFRAME AND RETRACE IF NEEDED. SL IS NEARER SUPPORT ZONE IN Daily TIMEFRAME.
PS: No new Nifty500 script can escape from me when making a breakout. :-)

Amazing breakout on Weekly / Daily Timeframe - SAILCheckout an amazing breakout happened in the stock in Weekly timeframe, macroscopically seen in Daily timeframe. Having a great favour that the stock might be bullish expecting a staggering returns of minimum 25% TGT. IMPORTANT BREAKOUT LEVELS ARE ALWAYS RESPEECTED!
NOTE for learners: Place the breakout levels as per the chart shared and track it yourself to get amazed!!
#No complicated chart patterns
#No big big indicators
#No Excel sheet or number magics
TRADE IDEA: WAIT FOR THE STOCK TO BREAKOUT IN LOWER TIMEFRAME AND RETRACE IF NEEDED. SL IS NEARER SUPPORT ZONE IN Daily TIMEFRAME.
PS: No new Nifty500 script can escape from me when making a breakout. :-)

Ready For Breakout After 14 years...Jindal Steel & Power Ltd is one of the India's leading steel producers with significant presence in sectors like mining and power generation. The group has global presence through subsidiaries, mainly in Australia, Botswana, Indonesia, Mauritius, Mozambique, Madagascar, Namibia, South Africa, Tanzania and Zambia.
