BUY TODAY SELL TOMORROW for 5%DON’T HAVE TIME TO MANAGE YOUR TRADES?
- Take BTST trades at 3:25 pm every day
- Try to exit by taking 4-7% profit of each trade
- SL can also be maintained as closing below the low of the breakout candle
Now, why do I prefer BTST over swing trades? The primary reason is that I have observed that 90% of the stocks give most of the movement in just 1-2 days and the rest of the time they either consolidate or fall
RESISTANCE Breakout in PRAKASH
BUY TODAY SELL TOMORROW for 5%
Breakoutstocks

BUY TODAY SELL TOMORROW for 5%DON’T HAVE TIME TO MANAGE YOUR TRADES?
- Take BTST trades at 3:25 pm every day
- Try to exit by taking 4-7% profit of each trade
- SL can also be maintained as closing below the low of the breakout candle
Now, why do I prefer BTST over swing trades? The primary reason is that I have observed that 90% of the stocks give most of the movement in just 1-2 days and the rest of the time they either consolidate or fall
Trendline Support in SUZLON
BUY TODAY SELL TOMORROW for 5%

U.S. Inhaler Play and Strong Earnings Fuel Long-Term UpsideTicker: NSE: CIPLA
Sector: Pharmaceuticals
Market Cap: ₹1.26 lakh crore+
Current Price: ₹1,572 (as of July 28, 2025)
Technical Rating: ⭐⭐⭐⭐⭐ (Strong Buy across platforms)
________________________________________________________________________________
🔍 Strong Fundamentals Back the Bullish Momentum
CIPLA has delivered an encouraging performance in Q1 FY26, reinforcing its long-term bullish narrative. The company posted a 10% year-on-year growth in profit after tax (PAT), reaching ₹1,298 crore, while revenues climbed 4% to ₹6,957 crore. These gains were driven largely by robust performance across its domestic Indian market and continued traction in Africa. The earnings beat estimates and demonstrate management's ability to maintain profitability despite sector-wide margin pressures.
Brokerages have taken note. Antique Broking has issued a bullish price target of ₹1,875, citing confidence in CIPLA’s U.S. respiratory pipeline. Meanwhile, Nuvama has pegged a more conservative target of ₹1,651, emphasizing margin resilience. Both reflect a broader positive sentiment from the street, bolstered by the company’s continued strategic execution.
Perhaps most importantly, CIPLA's U.S. growth roadmap is gaining clarity. With a stated goal of achieving $1 billion in U.S. revenue by FY27, the company is betting big on its inhalation portfolio. The upcoming launches of generic Advair and Symbicort are expected to cushion the impact from the anticipated decline in Revlimid revenues. This pipeline visibility is a key factor that differentiates CIPLA from its peers in the pharma space.
________________________________________________________________________________
📊 Technical Structure Signals Bullish Breakout
From a technical standpoint, CIPLA has just confirmed a breakout from an ascending triangle pattern, typically viewed as a continuation setup in an uptrend. On July 28th, the stock surged above the key breakout zone of ₹1,575–₹1,580, backed by a substantial increase in volume (3.84M vs 1.68M avg), signaling institutional participation. The daily close at ₹1,572 marks a technical inflection point, with the price now firmly above its 20, 50, 100, and 200 EMAs, indicating strong trend alignment.
The momentum indicators are also supportive, though cautionary. The Relative Strength Index (RSI) hovers around 71, suggesting overbought conditions, while the MACD has given a fresh bullish crossover. Additionally, the ADX (above 25) confirms trend strength. However, traders should be prepared for short-term volatility or pullbacks, as these indicators often cool off before further upside continues.
Key support levels to watch include ₹1,536, followed by ₹1,500 and ₹1,479.5. On the upside, immediate resistances lie at ₹1,592.5, then ₹1,613 and ₹1,649. A sustained close above ₹1,580–1,592 may unlock the next bullish leg toward ₹1,650+ levels.
________________________________________________________________________________
⚠️ Risks Remain – Pricing Pressure and Valuation a Concern
Despite the bullish setup, there are risks that could temper upside momentum. CIPLA’s U.S. Revlimid portfolio is facing pricing pressure, a trend impacting the broader generics market. Any further compression could drag margins in upcoming quarters. Additionally, while the company has posted solid profits, its EBITDA margin has seen a slight dip to 25.6%, suggesting limited operating leverage.
On the valuation front, CIPLA now trades at nearly 27× P/E, pricing in much of the future growth optimism. This elevates the bar for quarterly execution. From a technical lens, the RSI and stochastic indicators remain in overbought territory, raising the possibility of near-term consolidation or minor pullbacks before the next move higher.
________________________________________________________________________________
⏳ Tactical & Strategic View – Trade the Momentum, Invest in the Vision
In the short term, momentum traders should monitor how the stock behaves around the ₹1,575–₹1,580 breakout level. If the price sustains above this zone with continued volume, it signals strength and potential for a rapid move toward ₹1,600–₹1,650. However, any retracement to the ₹1,540–₹1,550 support range could present an ideal buying opportunity, especially for swing traders looking for a defined risk-reward setup.
For long-term investors, the bullish thesis rests on execution of the U.S. strategy and maintaining growth in high-margin geographies. With brokerages projecting upside toward ₹1,650–₹1,875, and a strategic focus on inhalation therapies, CIPLA is well-positioned for structural growth. That said, investors must remain patient and allow the multi-year thesis to unfold.
________________________________________________________________________________
🧠 Market Sentiment – Cautious Optimism
Overall market sentiment remains decisively positive, supported by strong earnings, a visible product pipeline, and favorable technical alignment. Yet, caution stems from the overbought technicals and valuation concerns. A prudent approach would be to accumulate on dips near ₹1,540–₹1,550, while watching for a decisive breakout and close above ₹1,580 to confirm trend continuation.
________________________________________________________________________________
📍 Investment Thesis: Accumulate with Conviction
CIPLA’s combination of strong fundamentals, a defined U.S. strategy, technical momentum, and institutional interest makes it a compelling long-term investment. Traders and investors alike can look to accumulate on dips, while treating a breakout above ₹1,580 as a confirmation trigger for further upside. Execution risk remains, but the broader setup favors a bullish bias heading into the next quarter.
For traders looking to capitalize on Cipla’s potential breakout, two entry strategies stand out. An aggressive entry can be considered in the ₹1,572–₹1,577 range, with a stop loss placed at ₹1,558. This suits momentum traders aiming to ride an early breakout, targeting ₹1,590 as an initial objective and ₹1,610+ for extended gains, offering a risk-reward ratio of 1:1 to 1:2+. Alternatively, a low-cost entry is ideal near ₹1,564 for those seeking a better cushion against volatility, with a tighter stop loss at ₹1,542. This setup also offers attractive upside toward ₹1,580–₹1,605+, maintaining similar or better risk-reward dynamics. In both cases, a decisive breakout above ₹1,580 on strong volume would confirm the bullish structure. Traders are advised to follow strict stop-loss discipline and avoid chasing if the price stretches sharply.
________________________________________________________________________________
⚠ Disclaimer (Please Read):
• These Trades are shared for educational purposes only and is not investment advice.
• I am not a SEBI-registered advisor.
• The information provided here is based on personal market observation.
• No buy/sell recommendations are being made.
• Please do your own research or consult a registered financial advisor before making any trading decisions.
• Trading involves risk. Always use proper risk management.
• I am not responsible for trading decisions based on this post.
________________________________________________________________________________
💬 Found this helpful?
Drop your thoughts or questions in the comments below ⬇️
🔁 Share this post with your trading community – let them benefit from clean charts, structured setups, and zone-based learning.
✅ Follow simpletradewithpatience for charts, clean setups, and educational content based on price action, zones, and risk-managed trades.
🚀 Trade with patience, trust your charts, and stay clear-headed!
Be Self-Reliant | Trade with Patience | Learn with Charts & Zones 📊________________________________________________________________________________

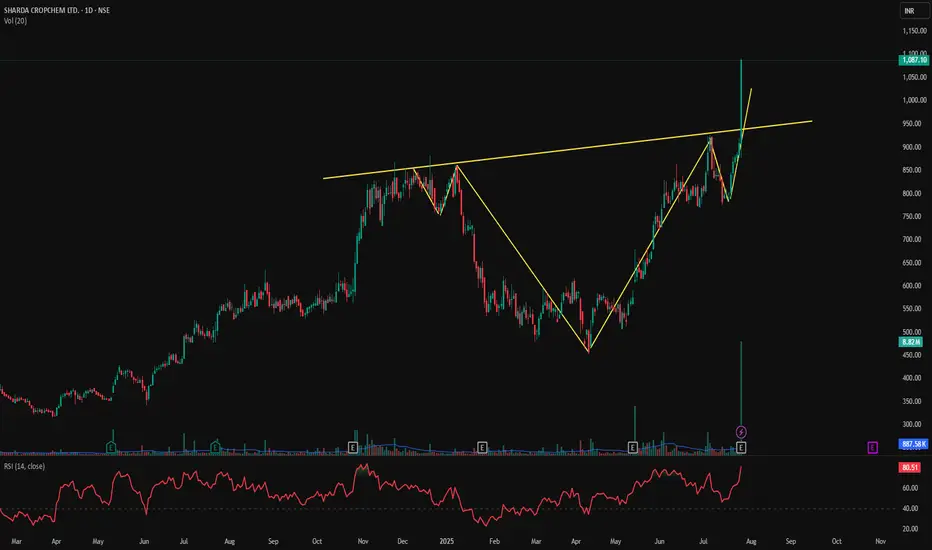
SHARDACROP – Cup & Handle Breakout with Explosive Volume📊 SHARDACROP – Cup & Handle Breakout with Explosive Volume | RSI > 80
📅 Chart Date: July 26, 2025
📍 CMP: ₹1,087.10 (+19.63%)
📈 Symbol: NSE:SHARDACROP | 1D Timeframe
🔍 Technical Analysis Breakdown
☕ Cup and Handle Breakout
A clear Cup and Handle formation has completed.
Breakout above the neckline (~₹940) with a massive bullish candle.
💥 Volume Spike
Volume surged to 8.82M, against the 20-day average of ~887K — institutional buying visible.
This is the highest volume in months, confirming the breakout strength.
📈 RSI (14, close): 80.51
Momentum is extremely strong, entering the overbought zone — may signal continuation or short-term pullback before resuming rally.
📌 Breakout Level: ₹940
📌 Immediate Resistance: ₹1,100–₹1,150
📌 Support on Retest: ₹940–₹960
🎯 Trade Setup
Entry on Retest: ₹960–₹980
Stoploss: ₹920 (below handle base)
Target: ₹1,150 / ₹1,200+
Risk Level: Moderate–High (due to RSI overbought, but pattern is strong)
⚠️ Disclaimer: This is an educational chart setup and not trading advice. Please conduct your own research and risk management.
📣 Follow @PriceAction_Pulse for more such clean breakouts and chart pattern analysis!
🔁 Drop a comment if SHARDACROP is on your radar for the next breakout rally 📈
Radico Khaitan Ltd. at Buy Support. CMP 2425Radico Khaitan Ltd. at Buy Support. CMP 2425. Breakout at 2464 closing basis. SL 2320. Momentum is gaining strength with volumes.

Epigral Ltd. at Buy Support. CMP 2158Epigral Ltd. at Buy Support. CMP 2158. Breakout at 2300. Momentum is strong, needs volumes to support the move.

Big Move Coming? Watch This Classic VCP Setup on Shriram FinanceHello everyone, i hope you all will be doing good in your trading and your life as well. Today i have brought a setup which name is VCP (Volatility Contraction Pattern) is one of the most powerful base setups, where the price contracts in multiple tight ranges, showing controlled strength. It signals that supply is drying up and the stock is getting ready for a strong move, usually a breakout. What makes it special is the combination of tightening price with lowering volume , and that's exactly what we can observe in Shriram Finance right now.
The stock has taken multiple supports from key EMAs like 9, 21, and 50 during this entire consolidation, a classic VCP sign. With each dip being bought quickly and bounce getting tighter, the stock is preparing for a potential breakout move.
Keep this one on radar , structure is clean, volume behavior is ideal, and if momentum comes, VCP patterns don’t disappoint.
For levels and risk-reward, please refer the chart above.
Disclaimer: This analysis is for educational purposes only. Please consult a financial advisor before making investment decisions.

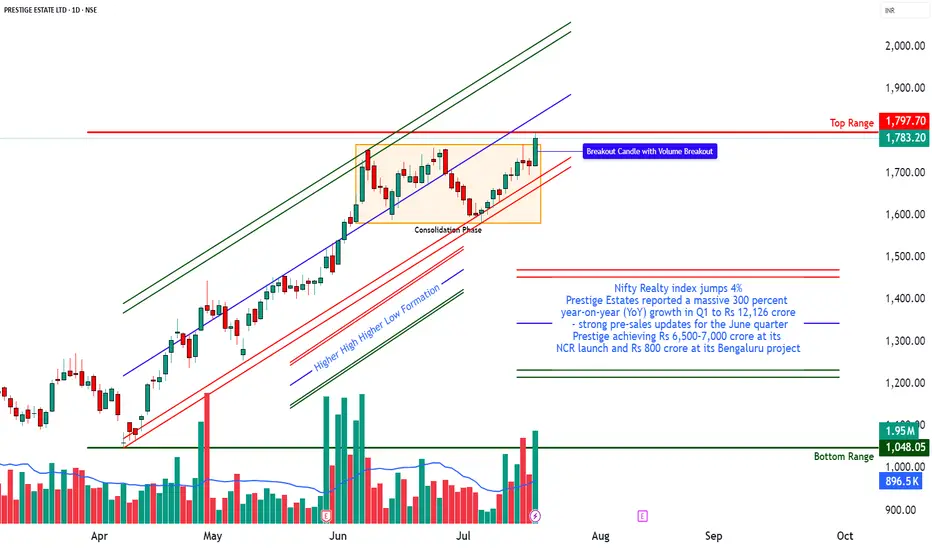
PRESTIGE – Bullish Continuation with Aggressive Call Build-Up________________________________________________________________________________📈 PRESTIGE – Bullish Continuation with Aggressive Call Build-Up
📅 Setup Date: 18.07.2025 | ⏱ Timeframe: Daily
📍 Strategy: Options Trade Setup
________________________________________________________________________________
Overall Bias: Bullish
Spot Price: ₹1,783.2
Trend: Uptrend resumption with aggressive Call OI build-up
Volatility: IV slightly falling in puts, rising in calls → good for defined risk bullish setups
Ideal Strategy Mix: Bullish with defined reward → Bull Call Spread or Naked CE
________________________________________________________________________________
1. 🔼 Bullish Trade (Naked options as per trend)
Best CE: Buy 1800 CE @ ₹49.10
Why:
• Strong Long Build Up with OI up 225%
• Massive volume (1.78L contracts) and ₹33.2 Cr TTV → clear interest
• Decent delta (approx. 0.5–0.55) → good sensitivity to price movement
• Strike closest to spot + high liquidity = ideal for directional trade
________________________________________________________________________________
2. 🔽 Bearish Trade (Naked options as per trend)
Best PE: Sell 1740 PE @ ₹28.6
Why:
• Price down 46% with high volume (4.2L) = put writing
• OI dropped 6.94% → likely unwinding from short bias
• Deep OTM with stable delta (-0.25 approx)
• Favorable if bullish view sustains and price stays above ₹1,740
________________________________________________________________________________
3. ⚙️ Strategy Trade (As per trend + OI data)
Strategy: Call Debit Spread → Buy 1780 CE + Sell 1820 CE
Net Debit: ₹57.3 - ₹41.1 = ₹16.2
Max Profit: ₹40 (spread) - ₹16.2 = ₹23.8
Max Loss: ₹16.2
Risk:Reward ≈ 1 : 1.47
Lot Size: 450
Total Risk: ₹7,290
Max Profit: ₹10,710
Why:
• 1780 CE shows explosive Long Build Up (OI ↑1031%) → active strike for bulls
• 1820 CE also shows strong Long Build Up (OI ↑1000%) → defined bullish target
• Much better R:R than 1800–1840 while staying aligned with trend
• Defined risk with improved capital efficiency and lower theta burn
________________________________________________________________________________
📘 My Trading Setup Rules
Avoid Gap Plays
→ Check pre-open price action to avoid trades influenced by gap-ups/gap-downs.
Breakout Entry Only
→ Enter trades only if price breaks previous day’s High (for bullish trades) or Low (for bearish trades).
Watch Volume for Confirmation
→ Monitor volume closely. No volume = No trade.
Enter on Strong Candle + Volume
→ Execute the trade only if a strong candle appears with increasing volume in the direction of the trade.
Defined Risk:Reward Only
→ Take trades only if R:R is favorable (ideally ≥ 1:2).(Safe R:R – 1:1)
Premium Disclaimer
→ Option premiums shown are based on EOD prices — real-time premiums may vary during execution.
Time Frame Preference
→ Trade with your preferred time frame — this strategy works across intraday or positional setups.
________________________________________________________________________________
⚠ Disclaimer (Please Read):
• These Trades are shared for educational purposes only and is not investment advice.
• I am not a SEBI-registered advisor.
• The information provided here is based on personal market observation.
• No buy/sell recommendations are being made.
• Please do your own research or consult a registered financial advisor before making any trading decisions.
• Trading involves risk. Always use proper risk management.
I am not responsible for trading decisions based on this post.
________________________________________________________________________________
💬 Found this helpful?
Drop your thoughts or questions in the comments below ⬇️
🔁 Share this post with your trading community – let them benefit from clean charts, structured setups, and zone-based learning.
✅ Follow simpletradewithpatience for charts, clean setups, and educational content based on price action, zones, and risk-managed trades.
🚀 Trade with patience, trust your charts, and stay clear-headed!
Be Self-Reliant | Trade with Patience | Learn with Charts & Zones 📊________________________________________________________________________________
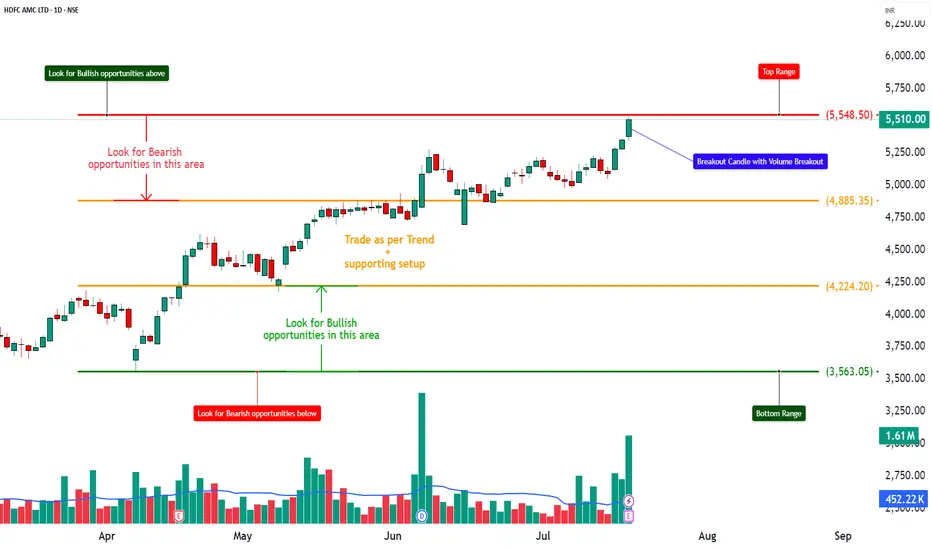
HDFCAMC – Strong Bullish Breakout on High Volume📈 HDFCAMC – Strong Bullish Breakout on High Volume
📅 Setup Date: 18.07.2025 | ⏱ Timeframe: Daily
📍 Strategy: Short-Term HNI Swing Setup
__________________________________________________________________________________
📝 Price Action Summary – HDFCAMC
HDFCAMC has delivered a textbook price action breakout, marked by a wide-range bullish candle on 3x average volume — confirming strong institutional participation. After weeks of tight consolidation and multiple failed attempts near the ₹5,385 resistance zone, the price finally broke out with a clean close near day’s high, indicating minimal selling pressure and clear buyer dominance. The breakout follows a classic compression-before-expansion setup, with the previous range acting as a base for momentum. Importantly, the absence of upper wick, strong follow-through, and volume-backed surge signal genuine strength — not a false breakout. Price has now entered a discovery phase with open space toward ₹5,673–₹5,800. As long as ₹5,385 holds as support, the bulls remain in control, and dip buying remains a high-probability setup. This is a classic case of price action speaking louder than indicators — structure, strength, and story all aligned.
__________________________________________________________________________________Trade Logic – Why This Setup:
Strong Price Structure: The stock has formed a bullish candle backed by a 20-day volume breakout, closing near the highs—indicating strong, sustained demand.
Breakout Confirmation: Price has cleanly broken out from a short-term base formed by multiple candle congestion. It's also trading above the prior resistance level of ₹5,385, confirming breakout strength.
__________________________________________________________________________________ Indicator Confluence: The RSI stands strong at 72, signaling bullish momentum. Additionally, the stock is breaking out of a Bollinger Band squeeze—an early sign of a potential momentum ignition. MACD, CCI, and Stochastic indicators are all aligned in bullish zones across daily, weekly, and monthly timeframes.
EMA Alignment: The stock is trading above all major exponential moving averages (9, 20, 50, 100, and 200 EMA), suggesting healthy trend harmony and support at every timeframe.
VWAP Positioning: Current price action remains well above the daily VWAP, indicating buying interest from institutional players and strong demand zones building underneath.
Volume Spike: Today's volume was 1.61 million, compared to the 10-day average of 452,000—more than a 3x surge, confirming strong buyer conviction and institutional participation.
Open Upside Potential: There are no significant supply zones visible until ₹5,800–₹6,000, offering a clear path for price expansion and swing targets.
Sector Tailwinds: The financial services and AMC sector is witnessing renewed traction after positive earnings and improved fund flow trends, supporting broader strength in related counters.
__________________________________________________________________________________ Would I Enter Now?
YES – Enter Now or on Dip
Reason: Price has just cleared a major volume cluster with strong momentum. Waiting too long might mean missing the breakout. The best approach would be:
• Enter 50% now
• Add 50% near ₹5,495–₹5,485 if there’s an intraday dip
__________________________________________________________________________________ 📈 Resistance Zones
• 🔴 R1: 5,591.5 (possibly weak)
• 🔴 R2: 5,673
• 🔴 R3: 5,797
📉 Support Zones
• 🟢 S1: 5,385
• 🟢 S2: 5,261
• 🟢 S3: 5,179
__________________________________________________________________________________ Direction: Buy (Bullish Bias)
Entry Price: ₹5,510 (Current Market Price)
Alternate Entry: On slight dips to ₹5,485–₹5,495 (ideal risk-managed zone)
Stop Loss: ₹5,385
Reason: This is Support 1 and a key VWAP-based level from the recent volume structure. A breach here invalidates the bullish strength.
Risk–Reward Ratio: 1:1 | 1:2 | +
__________________________________________________________________________________ Overall Bias: Bullish
Spot Price: ₹5,510
Trend: Strong upward momentum
Volatility: Slightly cooling IV (esp. in puts), but still elevated → good for defined-risk strategies
Ideal Strategy Mix: Naked CE or Call Debit Spread (defined-risk bullish strategy)
1. 🔼 Bullish Trade (Naked options as per trend)
Best CE: Buy 5400 CE @ ₹197.95
Why: Strong long buildup with rising OI, high volume, and solid delta — indicating institutional interest and momentum-backed directional strength.
__________________________________________________________________________________ 2. 🔽 Bearish Trade (Naked options as per trend)
Best PE: Sell 5200 PE @ ₹26.5
Why: Strong put writing seen with rising OI and price drop, suggesting low downside risk and income potential if bullish trend holds.
__________________________________________________________________________________
3. ⚙️ Strategy Trade (As per trend + OI data)
Strategy: Call Debit Spread → Buy 5400 CE + Sell 5600 CE
Net Debit: ₹197.95 - ₹92.6 = ₹105.35
Max Profit: ₹200 (spread) - ₹105.35 = ₹94.65
Max Loss: ₹105.35
Risk:Reward ≈ 1 : 0.9
Lot Size: 150
Total Risk: ₹15,802.5
Max Profit: ₹14,197.5
Why: This call spread is ideal because both the 5400 CE and 5600 CE are showing strong long build-up, indicating that traders expect the price to move higher. The 5600 CE has a sharp 168% jump in open interest with high volume, suggesting it’s a realistic target zone. By using a spread (buying 5400 CE and selling 5600 CE), we reduce the upfront cost and limit losses while still capturing upside. It also protects against time decay if the stock consolidates before moving up.
__________________________________________________________________________________ ⚠ Disclaimer (Please Read):
• These Trades are shared for educational purposes only and is not investment advice.
• I am not a SEBI-registered advisor.
• The information provided here is based on personal market observation.
• No buy/sell recommendations are being made.
• Please do your own research or consult a registered financial advisor before making any trading decisions.
• Trading involves risk. Always use proper risk management.
STWP is not responsible for trading decisions based on this post.
__________________________________________________________________________________ 💬 Found this helpful?
Drop your thoughts or questions in the comments below ⬇️
🔁 Share this post with your trading community – let them benefit from clean charts, structured setups, and zone-based learning.
✅ Follow simpletradewithpatience for charts, clean setups, and educational content based on price action, zones, and risk-managed trades.
🚀 Trade with patience, trust your charts, and stay clear-headed!
Be Self-Reliant | Trade with Patience | Learn with Charts & Zones 📊
__________________________________________________________________________________
*********************************************************************************************************************
Caution: This is a result based stock
*********************************************************************************************************************
"reconnect people by a futuristic way of travel,"🟢 Olectra Greentech Ltd – Positional Breakout Setup in EV Segment ⚡
CMP: ₹1280.90 | NSE: OLECTRA
🔹 Strong trendline support maintained for over 2 years
🔹 Multiple MACD (6/19, 13/55, 20/89) showing early crossover signals
🔹 RSI breakout above 50, now forming higher lows – momentum picking up
🔹 Ichimoku cloud breakout confirmation awaited – early signs of reversal
🔹 Volume holding well, OBV flat – potential accumulation zone
📈 Price breaking out from a long-term triangle pattern; if sustained, targets could open up toward ₹1450–₹1600 in coming months.
📊 Sector tailwind: EV, battery, and green mobility themes remain strong
🌱 Fundamentals supported by order book visibility, policy tailwinds, and infrastructure push
🎯 Ideal for positional traders & long-term investors with a medium-term view.
📝 Note: Please do your own due diligence. This is not a recommendation, just a view based on charts and fundamentals.
🧠 Disclaimer: For educational and research purposes only. No buy/sell advice.
📝 Chart Purpose & Disclaimer:
This chart is shared purely for educational and personal tracking purposes. I use this space to record my views and improve decision-making over time.
Investment Style:
All stocks posted are for long-term investment or minimum positional trades only. No intraday or speculative trades are intended.
⚠️ Disclaimer:
I am not a SEBI registered advisor. These are not buy/sell recommendations. Please consult a qualified financial advisor before taking any investment decision. I do not take responsibility for any profit or loss incurred based on this content.

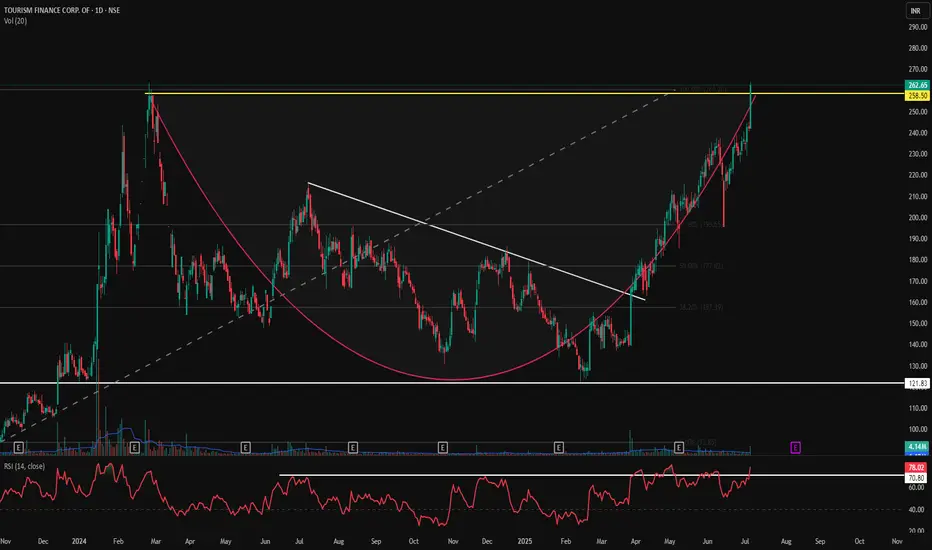
TFCILTD - Massive Cup & Handle Breakout | Daily Chart📊 TFCILTD – Massive Cup & Handle Breakout | Fib 100% Retest | RSI Overbought | Volume Surge | Daily Chart
📅 Chart Date: July 6, 2025
📍 CMP: ₹262.65 (+8.48%)
📈 Symbol: NSE:TFCILTD
🔍 Technical Analysis Summary
☕ Cup & Handle Pattern Breakout
Price broke out above the Cup & Handle neckline near ₹258.50 and hit the Fibonacci 100% extension at ₹262.65.
Clean rounding bottom formation visible, followed by bullish handle and sharp breakout.
📐 Fibonacci Retracement (from swing low ₹93.85 to high ₹262.65)
50.00% – ₹177.02
61.80% – ₹196.65
✅ 100.00% – ₹262.65 (just achieved!)
📈 RSI Indicator (14)
RSI at 78.02, clearly in overbought territory – indicating momentum strength, but a minor pullback is likely.
RSI consistently above 70 for the past few sessions reflects strong trend continuation.
📊 Volume
Volume surged to 4.14M, supporting the breakout. Confirmation of pattern breakout is validated by this volume spike.
🏁 Key Technical Levels
Breakout Zone (Neckline): ₹258.50 ✅
CMP: ₹262.65
Next Resistance: Blue Sky Zone (New Highs)
Support on Retest: ₹258.50 → ₹230.67
Major Support: ₹177.02 (Fib 50%)
💡 Trade Setup Idea
Entry: On breakout confirmation above ₹258.50 or on retest
Stoploss: Below ₹230
Target: Open sky above ₹262 → Trend-following zone
Risk Level: Medium-High (due to overbought RSI)
⚠️ Disclaimer: This is an educational chart setup and not trading advice. Please conduct your own research and risk management.
📣 Follow @PriceAction_Pulse for more such clean breakouts and chart pattern analysis!
🔁 Drop a comment if TFCILTD is on your radar for the next breakout rally 📈
Rossari Biotech – Stage 4 Ending? Stage 1 Base in Play!🧪 NSE:ROSSARI – 📉 Stage 4 Ending? Stage 1 Base in Play!
🕵️♂️ Technical Context
Rossari has been in a Stage 4 decline since its 2021 peak. But now it’s forming a solid Stage 1 base between ₹650–720, with signs of smart accumulation emerging.
🧩 Business Model Snapshot
🧵 Segments: Textile Chemicals, HPPC, Animal Nutrition
🛒 New Growth: Institutional & B2C (₹299 Cr, +67% YoY)
🌍 Markets: Strong domestic base, expanding in Middle East & SE Asia
🤝 Client Spread: Diversified, no over-reliance
🎙️ Management Commentary
⚙️ Focus on margin normalization across verticals
📊 Base EBITDA margin ~15% (excl. new segments)
🌐 FX risk control via new geographies (Egypt, Turkey, SE Asia)
🧱 Scaling up I&B2C as a future margin driver
📈 Trend Overview
📆 Monthly: Ending Stage 4 — beginning Stage 1 base
📉 Weekly: Consolidating in a tight rectangle ₹650–750
📅 Daily: Sideways movement; price hugging EMA — coiled for move
🔄 Volume: Subtle uptick — early sign of institutional interest
🧭 Indicators: MACD crossover possible, RSI turning positive
🎯 Trade Plan
💼 Accumulation Zone: ₹650–720
🔓 Breakout Buy: ₹750+ (weekly close + volume)
⛔ Stop-loss: ₹640
🎯 Targets: ₹900 → ₹1,100
📈 Risk-Reward: Up to 1:4.5 🚀
📊 Fundamental Edge
💰 FY25 Revenue: ₹2,080 Cr
🧼 Expanding B2C + Institutional verticals
🏗️ ₹192 Cr CapEx in progress
💹 ROE: ~13%, OPM: ~10%
🧾 Clean governance, no pledges
🟢 Momentum Score: 7/10
📉 Stage 1 base + rising volume
📊 Solid growth fundamentals
🧠 FX/geography risk being managed
📍 NSE: ROSSARI | Sector: Specialty Chemicals
⏳ Watch ₹720 breakout zone – Big move may be coming!
#Rossari #BreakoutStocks #StageAnalysis #SwingTrade #SmartMoney #TechFundamentals #TradingView #SpecialtyChemicals #IndiaEquity #finchoicebiz #markethunt

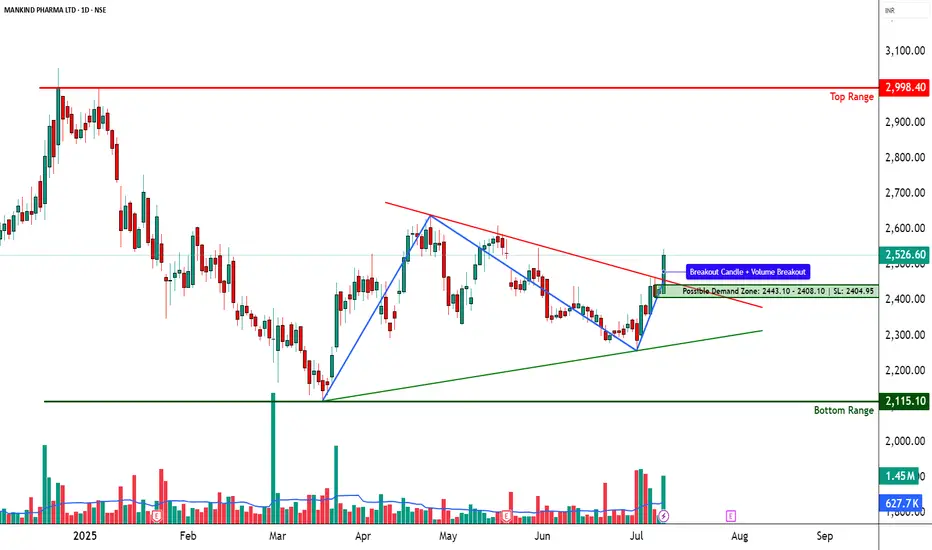
MANKIND PHARMA – Descending Triangle Breakout________________________________________________________________________________📈 MANKIND PHARMA – Falling Trendline Breakout | Strong Reversal Candle | Volume Spike
🕒 Chart Type: Daily Chart
📆 Date: July 9, 2025
________________________________________________________________________________
📌 Price Action:
MANKIND PHARMA has executed a decisive breakout above a falling trendline on the daily chart, breaking out of a multi-week descending structure. The price action had been consolidating within a triangular pattern, and on July 9, it registered a powerful wide-range bullish candle, closing at 2526.60 — well above the recent consolidation highs. This move came from a structured base with two strong pivot lows and now places the stock back into a strong bullish trajectory. The breakout is not random; it’s backed by structure, momentum, and confirmation — suggesting potential for a trend continuation if sustained.
________________________________________________________________________________
📊 Chart Pattern:
The chart shows a descending triangle breakout with compression near the apex. This setup builds pressure and usually resolves in the direction of volume. The move out of this pattern has occurred with authority, marked by a clean range expansion and bullish follow-through above resistance. This is a momentum-confirming breakout, which opens up room toward testing higher resistance zones.
________________________________________________________________________________
🕯️ Candlestick Pattern:
Strong Bullish Candle
Open = Low (Intraday strength)
Buy Today, Sell Tomorrow-type price action
Aligned with Volume Spike and Trendline Breakout
________________________________________________________________________________
🔊 Volume Analysis:
The breakout is accompanied by more than 2x the 20-day average volume, signaling real participation — not just speculative noise. Delivery volumes are notably strong, and volume came after a phase of tight consolidation, which indicates a possible transition from quiet accumulation to active participation by stronger hands.
________________________________________________________________________________
📈 Technical Indicators:
RSI (Daily): 66 – strong, trending up
MACD: Bullish crossover, both on Daily and Weekly
CCI: 220 – highly bullish momentum territory
Stochastic: 94 – overbought but confirming momentum
SuperTrend & VWAP: Clearly bullish
Bollinger Band: Price is expanding beyond upper band — volatility expansion in motion
________________________________________________________________________________
🧱 Support & Resistance:
🔻 Supports:
2448.27 – Immediate support (previous breakout zone)
2369.93 – Structure base support
2322.27 – Last defense before breakout invalidation
Bottom Range / Demand Zone: 2115.1 – Long-term accumulation zone
🔺 Resistance Zones:
2574.27 – First supply zone; watch for price reaction
2621.93 – Medium-term resistance; previously rejected here
2700.27 – Higher timeframe swing resistance
Top Range: 2998.4 – Long-term resistance; breakout confirmation if crossed
________________________________________________________________________________
👀 What’s Catching Our Eye:
What stands out is the confluence breakout — trendline, structure, volume, and indicators are all pointing in the same direction. The BB squeeze, RSI breakout, and strong candle together make this a multi-signal setup — rarely do we get such alignment across tools.
________________________________________________________________________________
🔍 What We’re Watching For:
Will the price hold above 2448–2526 for the next couple of sessions? If yes, this breakout can see momentum continuation toward 2574+. Any low-volume pullback toward the trendline or support zone could be a low-risk re-entry. If it fails to hold above the breakout candle, momentum could fade.
________________________________________________________________________________
✅ Best Buy Level for Equity (Low Risk Idea):
Entry: Above 2543.60 (post-breakout confirmation or clean retest of 2448–2455 zone)
Stop Loss: 2404.95 (on a closing basis)
Risk Reward Strategy: 1:1 initially, trail for 1:2+ if volume expands
Avoid chasing: Let the price validate with sustained volume above breakout
________________________________________________________________________________
💼 Sector Tailwinds:
The pharmaceutical sector is seeing renewed investor interest post-COVID, with growing focus on specialty products, chronic therapy lines, and export-led growth. MANKIND is among the strongest consumer-pharma brands with consistent results and brand recall — adding fundamental strength to this technical breakout.
________________________________________________________________________________
⚠️ Risk to Watch:
A close below 2448 could invalidate this setup
The overbought Stochastic means minor pullbacks or shakeouts are possible
Don’t chase — always confirm the breakout with a retest or follow-through candle
Over-positioning during volatility can lead to poor R:R trades
________________________________________________________________________________
🔮 What to Expect Next:
If this breakout holds, we may see follow-through toward 2574.27 in the short term. Strong volume above 2540+ can unlock upside toward 2621+. However, if the price closes below 2448, we may be dealing with a failed breakout — a scenario to strictly avoid. Watch next 2–3 sessions for clarity.
________________________________________________________________________________
🧠 How to Trade MANKIND PHARMA (For Educational Use Only):
🔹 Breakout Trade Plan
Entry: Above 2543.60
Stop Loss: 2404.95 (Closing basis)
Pullback Entry: Into 2448 zone with bounce candle
Risk-Reward: Start with 1:1, then trail to 1:2+
Position Sizing: Risk-calibrated, never go all-in
________________________________________________________________________________
⚠️ Disclaimer (Please Read):
• This chart is shared for educational purposes only and is not investment advice.
• I am not a SEBI-registered advisor.
• The information provided here is based on personal market observation.
• No buy/sell recommendations are being made.
• Please do your own research or consult a registered financial advisor before making any trading decisions.
• Trading involves risk. Always use proper risk management.
________________________________________________________________________________
💬 Found this helpful?
What’s your ideal approach to this setup — breakout entry or pullback into zone?
Drop your thoughts or questions in the comments below ⬇️
🔁 Share this post with your trading community
✅ Follow STWP for clean technical setups backed by price action and volume
🚀 Let’s trade with patience, logic, and clarity!
Be Self-Reliant | Trade with Patience | Learn with Logic
________________________________________________________________________________
"Outperform"🧲 RAJRATAN - Reversal in the Making?
📈 Technical View:
Monthly chart forming a strong base with a breakout from long-term falling trendline.
RSI and MACD on both weekly & monthly showing bullish crossovers after long consolidation.
Volume increasing on breakout candle, suggesting institutional interest.
Sustaining above ₹400–₹420 zone could invite further momentum.
💹 Fundamental Snapshot (as per Screener):
Consistent profit-making wire exporter with healthy ROCE and debt under control.
Revival in auto sector and export demand can support future earnings.
Promoter holding stable ~65% and no major pledging.
📝 Disclosure: Watch for confirmation above ₹430+ levels with volume. Avoid if closes below ₹390.
⚠️ Disclaimer:
This is a high-risk idea, suitable only for long-term investors or speculators with risk appetite. Not a recommendation. Do your own research.
📝 Note: Please do your own due diligence. This is not a recommendation, just a view based on charts and fundamentals.
🧠 Disclaimer: For educational and research purposes only. No buy/sell advice.
📝 Chart Purpose & Disclaimer:
This chart is shared purely for educational and personal tracking purposes. I use this space to record my views and improve decision-making over time.
Investment Style:
All stocks posted are for long-term investment or minimum positional trades only. No intraday or speculative trades are intended.
⚠️ Disclaimer:
I am not a SEBI registered advisor. These are not buy/sell recommendations. Please consult a qualified financial advisor before taking any investment decision. I do not take responsibility for any profit or loss incurred based on this content.

MOTISONS : Breakout Stock#MOTISONS #swingtrade #vcppattern #breakout #trendingstock
MOTISONS : Swing Trade
>> Trending Stock
>> Breakout Candidate
>> VCP pattern
>> Good strength & Volume Buildup
>> Good Upside Potential
Swing Traders can lock profit at 10% and keep Trailing
Please Boost, comment and follow us for more Learnings.
Disc : Charts shared are for learning purpose only, not a Trade recommendation. Do your own research and consult your financial advisor before taking any position.

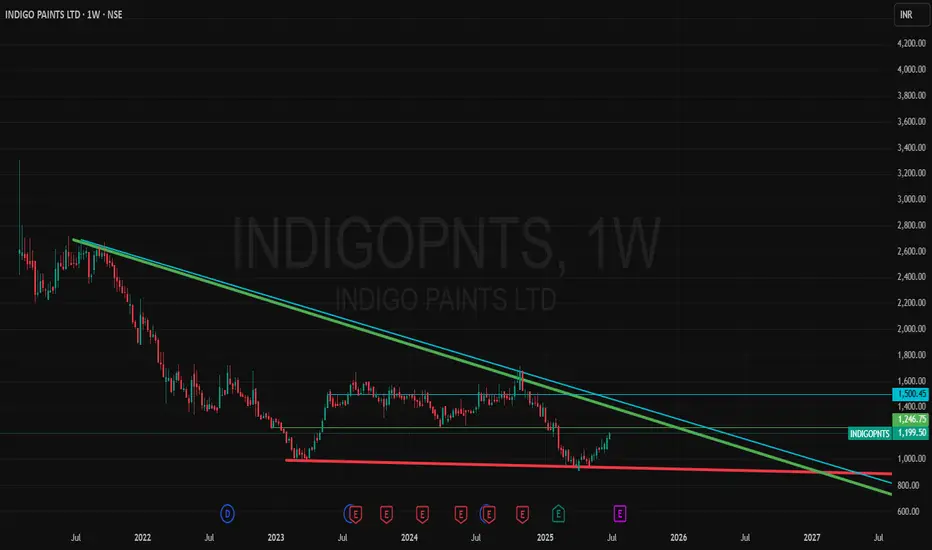
"Be Surprised" - "Jaisa Performance, Waisi Price!"Indigo Paints Ltd
About
Incorporated in 2000, Indigo Paints Ltd manufactures and sells decorative paints
Key Points
Leading Paint Company
The company is a leading paint company in India that produces a wide range of decorative paints. It is the first company to introduce category-creator products like Metallic Emulsions, Tile Coat Emulsions, etc in the decorative paint market in India. The company has ~80%-90% market share in some of its differentiated products.
Product Portfolio
The product portfolio comprises of Emulsions, Enamels, Wood Coatings, Primers, Distempers, Cement, Paints, Putties etc.
📈 Indigo Paints – Is a Breakout Brewing? 🎨
CMP: ₹1,199 | View: Positional Bullish | Chart TF: Weekly & Monthly
🔹 Technical Breakout:
Price has successfully broken out of a long-term falling trendline on both weekly and monthly charts after forming a strong base near ₹1,000.
MACD crossover, rising RSI, and Parabolic SAR flip all support this uptrend.
Volume spike seen recently confirming accumulation.
🔹 Bullish Indicators:
RSI (W1 & M1) back above 50 – momentum shifting.
MACD crossovers with histogram reversal.
Price reclaiming 50EMA and 100EMA for the first time in months.
Bullish divergence played out.
📰 Fundamental Triggers:
CNBC TV18: Management expects growth to pick up from Q1 FY26, with strong sales outlook.
MoneyControl: Sharekhan gave a Buy call with a target of ₹1234.
NDTV Profit: Indigo Paints picked as a top stock to buy this week.
📊 Screener Fundamentals:
Debt-free, consistent ROE ~18%
Strong operating margins
Expanding dealer network and brand recall improving
📝 Note: Please do your own due diligence. This is not a recommendation, just a view based on charts and fundamentals.
🧠 Disclaimer: For educational and research purposes only. No buy/sell advice.
📝 Chart Purpose & Disclaimer:
This chart is shared purely for educational and personal tracking purposes. I use this space to record my views and improve decision-making over time.
Investment Style:
All stocks posted are for long-term investment or minimum positional trades only. No intraday or speculative trades are intended.
⚠️ Disclaimer:
I am not a SEBI registered advisor. These are not buy/sell recommendations. Please consult a qualified financial advisor before taking any investment decision. I do not take responsibility for any profit or loss incurred based on this content.
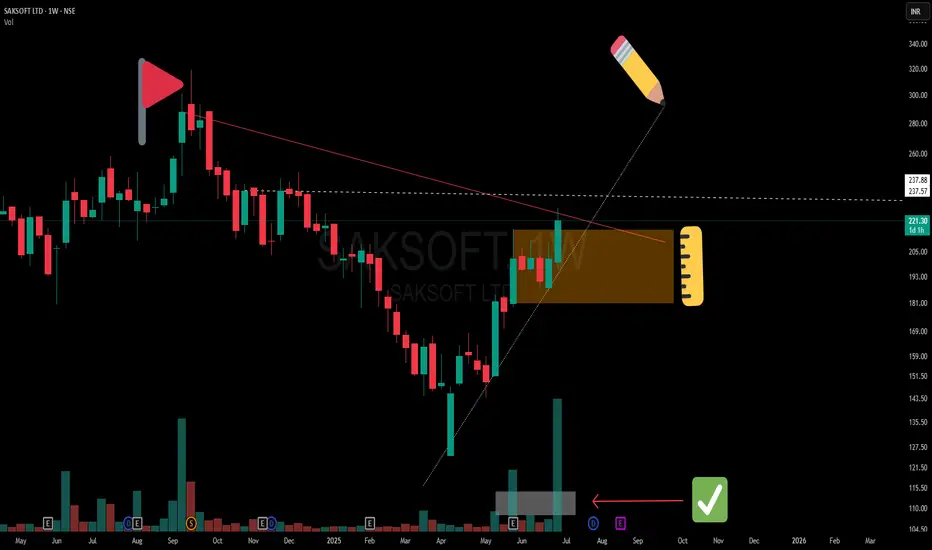
Precision Meets Patience | SAKSOFT Chart WTF🔻 A clean Control Trendline (CT) drawn from the all-time peak (🔺) on the Weekly Time Frame (WTF) shows a long-term price memory resistance finally getting tested.
📏 Overlapping that is a hidden horizontal resistance (⚪ dotted white line), representing the final hurdle before the stock can challenge the supply zone.
🟧 Mother Candle Structure: A powerful consolidation candle has now been broken with strength, giving us structure + intent in one move.
🔊 Volume speaks! We’ve seen two separate clusters of high volume, confirming active participation—not a lonely breakout.
📈 The trendline from bottom left is giving both body and wick supports—a technically clean angle where structure meets sentiment.
📝 Note:
This is a structural breakdown meant for educational and analytical purposes. Not a forecast or recommendation.
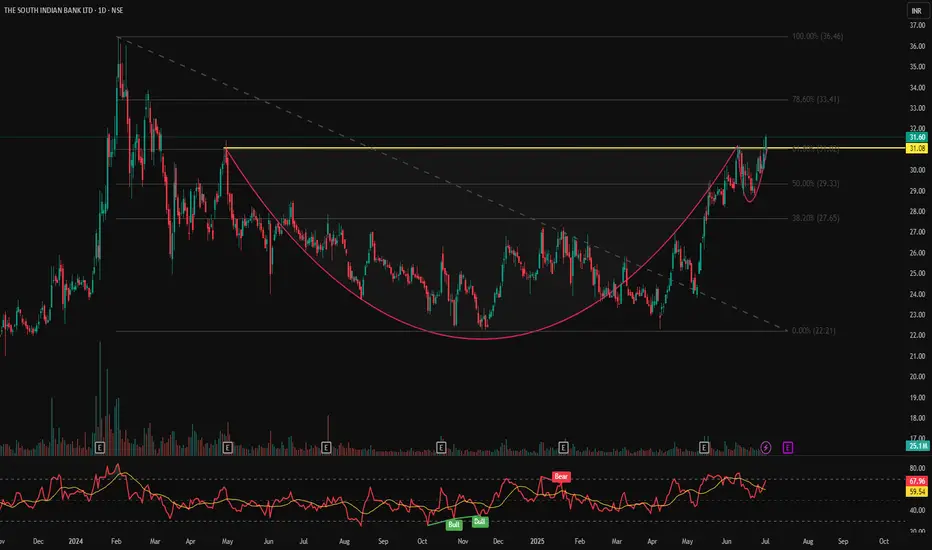
SOUTHBANK – Breakout From Cup & Handle | Daily Chart📊 SOUTHBANK – Breakout From Cup & Handle | RSI Bullish | High Volume | Fibonacci Levels | Daily Chart
📅 Chart Date: July 2, 2025
📍 CMP: ₹31.60 (+2.63%)
📈 Symbol: NSE:SOUTHBANK
🔍 Technical Breakdown
✅ Cup & Handle Breakout
A perfect cup & handle pattern breakout is visible
Price breaks out above the neckline at ₹31.08, which was a strong resistance zone
Breakout supported by rising volume (25.1M) adds conviction
📊 RSI Momentum
RSI (14) reading at 67.96 signals bullish strength, approaching overbought but not yet extreme
RSI crossover and previous bullish divergence helped initiate the move
📐 Fibonacci Retracement Levels (Swing: ₹22.21 to ₹36.46)
38.2% – ₹27.65
50.0% – ₹29.33
61.8% – ₹31.08 ✅ (Breakout zone)
78.6% – ₹33.41
100% – ₹36.46 🎯
🏁 Key Levels
Breakout Zone (Neckline): ₹31.08
CMP: ₹31.60
Resistance Levels: ₹33.41 → ₹36.46
Support Levels: ₹29.33 → ₹27.65
💡 Trade Idea
Entry: Above ₹31.10 on volume confirmation
SL: Below ₹29.30
Targets: ₹33.40 → ₹36.40+
Momentum + Breakout = High Conviction Setup
⚠️ Disclaimer
This analysis is for educational purposes only. Always do your own research and consult a registered advisor before investing.
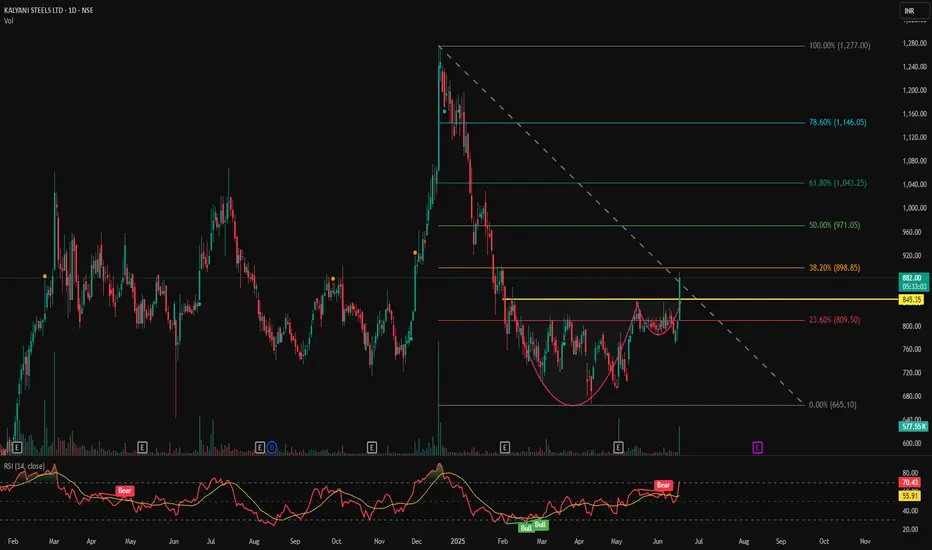
KSL - Strong Cup & Handle Breakout | Volume & RSI Confirmation📊 KALYANI STEELS LTD (KSL) – Strong Cup & Handle Breakout | Volume & RSI Confirmation | Daily Chart
📅 Chart Date: June 17, 2025
📈 CMP: ₹891.00 (+10.33%)
📍 Ticker: NSE:KSL
🔍 Technical Chart Breakdown
☕ Cup & Handle Pattern Breakout
KSL has decisively broken above the neckline resistance around ₹845 after forming a classic Cup & Handle pattern — a strong bullish continuation setup. This breakout has been accompanied by a solid volume spike (458.32K), which adds further confirmation.
💹 RSI Analysis
RSI is currently at 71.61, indicating strong bullish momentum.
RSI crossover confirms entry into the overbought zone, signaling strength but also requiring caution for late entries.
🕯️ Volume Action
Noticeable volume surge on the breakout candle suggests institutional participation.
Previous volume build-up near the handle zone indicates accumulation.
📍 Key Price Levels
✅ Breakout Zone: ₹845.35
🚀 Potential Upside Targets:
₹920 – Minor resistance
₹990–₹1,040 – Short to medium-term swing targets
₹1,150+ – Based on measured pattern height
🛡️ Support Zones:
₹845 – breakout retest level
₹800 – psychological support
₹765 – handle base and invalidation zone
🛠️ Trading Strategy Idea
Entry: Either breakout close above ₹845 or on retest of breakout zone
Stop Loss: Below ₹800
Targets: ₹920 → ₹1,000 → ₹1,150
Risk-Reward: >1:2 on first target with strong technical validation
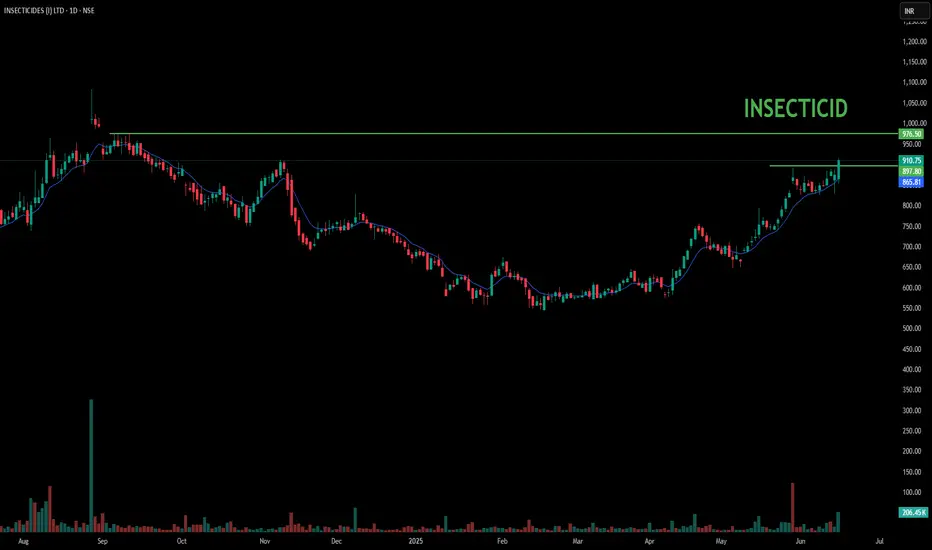
INSECTICIDES - BREAKOUT STOCK📈 Insecticides (India) Ltd – Breakout Stock on the Radar
Insecticides India is currently exhibiting strong technical momentum, supported by high volumes and a confirmed breakout on the charts. The stock has surpassed key resistance levels, indicating potential for short- to medium-term upside. Traders and investors should keep this stock on their watchlist for further price action confirmation.
🔍 Key Observations
Breakout from a consolidation zone
Rising volumes supporting the move
Technical indicators signaling bullish momentum
📌 This update is purely for informational and educational purposes only and not a recommendation to buy or sell any securities. Please do your own research or consult a SEBI-registered advisor before making any investment decisions.
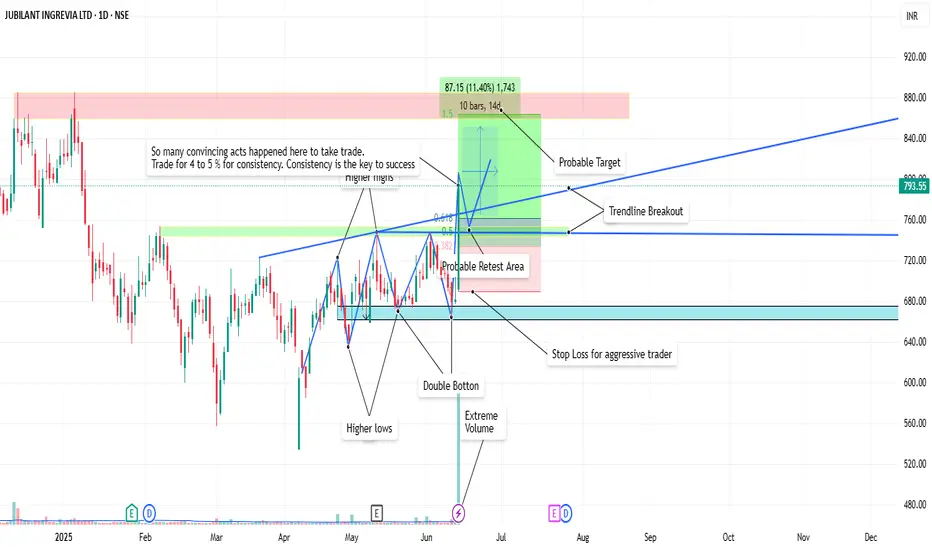
JUBLINGREA Breakout📊 1. Price Action & Pattern Analysis
Breakout Trigger:
Double Bottom at ₹660–₹670 confirmed.
Higher Lows and Higher Highs are clearly visible — a bullish trend structure.
Breakout from trendline resistance with a strong bullish candle on extreme volume confirms buyer interest.
Probable Retest Zone: Around ₹745–₹760, which overlaps with the 38.2–61.8% Fibonacci zone, indicating a good low-risk reentry area if price retests.
Stop-Loss (Aggressive): Just below ₹680 support zone (prior bottom and neckline).
🔍 2. Volume & Confirmation
Massive Volume Spike on breakout day — highest in recent months.
Volume confirms genuine buying pressure, validating the pattern breakout.
🧭 3. Stage Classification
✅ Current Stage: Stage 2 – Markup Phase (Early Stage)
Why:
Breakout from long consolidation.
Volume confirms institutional activity.
Trend structure shifting to higher highs/lows.
Strong retest and breakout of previous resistance zones.
🎯 4. Trade Plan Summary
Metric Value
📌 Entry Range ₹760–₹780 (retest possible)
🧯 Stop Loss (Aggressive) ₹675–₹680 zone
📈 Target 1 (Short-Term) ₹840–₹860 (as shown)
📈 Target 2 (Positional) ₹900+
🔎 Risk–Reward 1:2.5+ (Ideal Swing Setup)
🧠 “So many convincing acts happened here to take trade... Trade for 4 to 5% for consistency.”
✅ Conclusion
This is a classic Stage 2 early breakout with:
Multi-confirmation setup (pattern + trendline + volume)
Well-defined risk-reward
Excellent for swing-to-positional trades
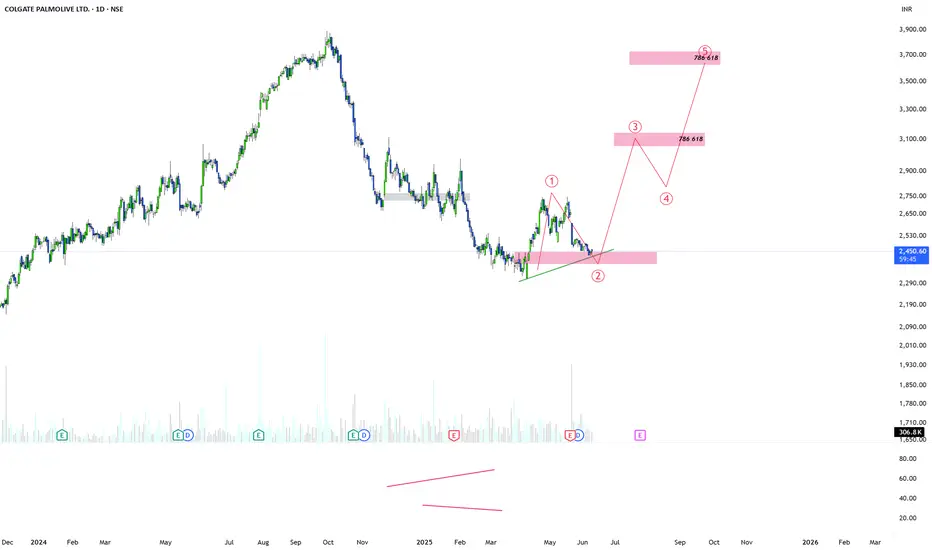
COLPAL: Bringing some PALCOLPAL is in base formation after correcting nearly 40% from the top. Currently it is in wave 2 of 2 and expected to reverse with a big move. RED BOX are the targets and reversal zones.
follow up as per your risk apatite.
NOTE: I'm not a SEBI REG. Study charts before investing.
Godrej Properties Chart Analysis: Bullish or Bearish Move Ahead? Godrej Properties – Chart Analysis & Trading Strategy
Company Background:
Godrej Properties, a branch of the renowned Godrej Group, began its journey in the real estate sector in 1990.
The company has gained recognition for its focus on innovative and sustainable construction methods.
It actively develops eco-friendly housing and commercial infrastructure projects, especially in the mid-income segment.
Core Business Areas
Residential Projects: Offers a wide range—from budget homes to premium apartments—with sustainability as a core design principle.
Commercial Developments: Develops business parks, malls, and office complexes.
Sustainable Construction: Implements green building practices and energy-efficient technologies across its developments.
Subsidiaries Include:
Godrej Construction
Godrej Fund Management
Why Consider Godrej Properties for Long-Term Investment?
📈 Rising Demand in Mid-Segment Housing: Driven by demographic shifts and urban growth.
🔗 Smart Business Partnerships: Asset-light model helps reduce risk and capital expenditure.
🌱 Sustainability Appeal: Well-aligned with global ESG goals, making it attractive for ethical and green investors.
Godrej Properties Technical Analysis – Key Levels to Watch
Godrej Properties is currently trading near ₹2,460, showing strong momentum after a recent recovery. However, the stock is approaching a critical resistance zone that will determine its next major move.
Key Resistance Zone
Major Resistance: ₹2,550 – ₹2,575
This zone is crucial. A decisive breakout above ₹2,575 on strong volume can lead to significant upside.
Bullish Scenario (Breakout)
If the stock closes above ₹2,575, it may trigger a fresh rally.
First Target: ₹2,800
Second Target: ₹3,000
Momentum traders should watch for price action confirmation above this level for potential long entries.
Bearish Scenario (Rejection at Resistance)
If ₹2,575 is not breached, the stock may face selling pressure.
Immediate Support: ₹2,240 – ₹2,215
If this zone breaks, the next key level to watch is ₹2,000, which acted as a strong support in the past.
A breakdown below ₹2,000 could shift the trend to bearish in the medium term.
Summary
Current Price: ₹2,460
Critical Resistance: ₹2,550 – ₹2,575
Upside Targets: ₹2,800 → ₹3,000 (after breakout)
Downside Supports: ₹2,240 → ₹2,215 → ₹2,000
Traders should closely track price behavior around the ₹2,575 level, which is likely to define the next directional move. As always, use proper risk management and wait for confirmation before entering trades.
Like this analysis?
👍 Don’t forget to like, comment your views, and follow for more actionable stock insights and breakout trade setups!
📈 Stay tuned for latest updates, key level revisions, and momentum alerts on Godrej Properties and other trending stocks.
