BUY TODAY SELL TOMORROW for 5%DON’T HAVE TIME TO MANAGE YOUR TRADES?
- Take BTST trades at 3:25 pm every day
- Try to exit by taking 4-7% profit of each trade
- SL can also be maintained as closing below the low of the breakout candle
Now, why do I prefer BTST over swing trades? The primary reason is that I have observed that 90% of the stocks give most of the movement in just 1-2 days and the rest of the time they either consolidate or fall
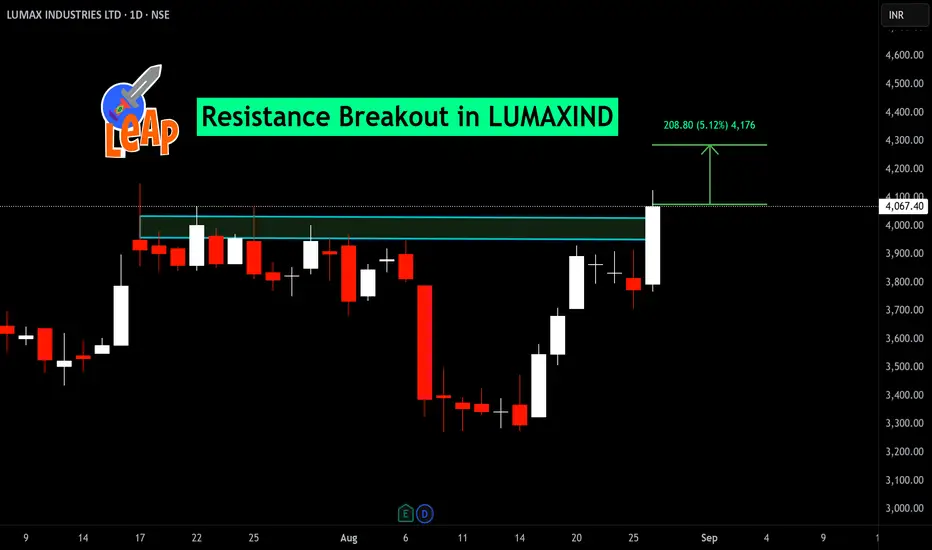
Resistance Breakout in LUMAXIND
BUY TODAY SELL TOMORROW for 5%
Breakoutstrategy
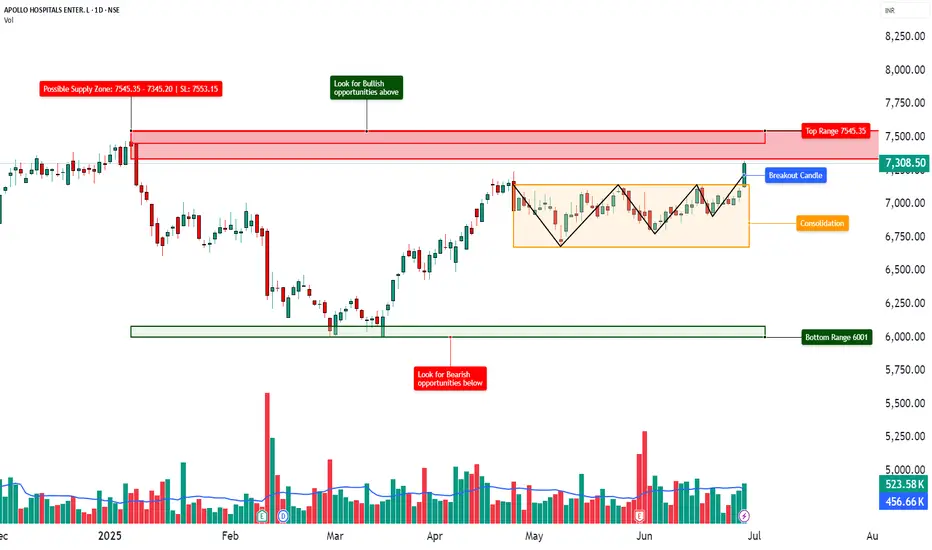
APOLLOHOSP - TECHNICAL ANALYSIS________________________________________________________________________________
📈 Apollo Hospitals Enterprises Ltd. (APOLLOHOSP) – TECHNICAL ANALYSIS
📆 Date: June 28, 2025 | Timeframe: Daily Chart
🔍 For Educational Purposes Only
________________________________________________________________________________
📊 Structure Overview
• Pattern: Rounded "W" Base Breakout
• Breakout Level: ₹7,324
• Current Price: ₹7,308.50 (pullback after breakout)
• Volume: 523.58K vs avg. 456.66K – confirming breakout strength
• Trend Bias: Bullish (as long as price sustains above ₹7,176–₹7,043)
________________________________________________________________________________
📌 Key Zones
🔺 Top Range Resistance: ₹7,545.35
📛 Possible Supply Zone: ₹7,545.35–₹7,345.20 | SL: ₹7,553.15
🟧 Consolidation Zone: ₹6,750–₹7,300
🟩 Demand Support: ₹7,176 / ₹7,043 / ₹6,969
🔻 Bottom Support Range: ₹6,001 (long-term demand base)
Resistance Levels:
• ₹7,382.5
• ₹7,456.5
• ₹7,589.0
Support Levels:
• ₹7,176.0
• ₹7,043.5
• ₹6,969.5
________________________________________________________________________________
🧠 Technical Signals
✔️ Rounded W pattern breakout
✔️ Bollinger Band expansion (BB Squeeze OFF)
✔️ RSI around 62 – showing strength
✔️ SuperTrend & VWAP supportive during breakout
✔️ Sectoral tailwind: Hospitals gaining traction in current market narrative
________________________________________________________________________________
🎯 STWP Educational Trade Plan (For Study Only)
• Entry (Breakout Retest): ₹7,324
• Stop Loss: ₹6,989
• Risk: ₹335/share
• Position Size: 50 shares
• Risk-Reward Ratio: 1:1 | 1:2+
📌 Setup Logic: Volume-backed W Breakout + Consolidation Range Break + Sector Strength
________________________________________________________________________________
⚠️ Cautionary Notes
• Breakdown below ₹7,043 = weakening structure
• If price gets rejected at ₹7,456, sideways action likely
• Always track volume + RSI for divergence signs
________________________________________________________________________________
📢 Disclaimer
This is a study-based chart analysis shared for educational purposes only. It is not a buy/sell recommendation. The author is not SEBI-registered. Please consult a SEBI-registered advisor before making any investment decisions.
________________________________________________________________________________
💬 Your Turn:
Do you think ₹7,545 will break or will price revisit ₹7,000 first?
👇 Drop your view or chart in the comments — let’s grow together!
________________________________________________________________________________
STWP | Learn. Trade. Grow.
________________________________________________________________________________
How Richard Dennis Created Millionaires Turtle Trading ExperimntHello Traders!
Imagine you’re a total beginner. No experience. No finance degree. No trading background. Now imagine someone teaches you a simple trading system. Trains you for just two weeks. And then gives you real money to manage. Sounds like a dream, right. But it actually happened in the 1980s. A legendary trader named Richard Dennis did it. And many of the people he trained went on to become millionaires.
This was called the Turtle Trading Experiment .
And it changed the way people looked at trading forever.
Who Was Richard Dennis? (The Trader Who Taught Success)
Richard Dennis started with just $1,600 and grew it to more than $200 million through commodities trading. But his biggest legacy was not his profits. It was his belief that trading success can be taught.
He once said:
“We can grow traders just like they grow turtles in Singapore.” That quote became the foundation of the Turtle experiment.
What Was the Turtle Experiment All About?
Richard Dennis had a debate with his friend William Eckhardt. Dennis believed that anyone, could be trained to trade. Eckhardt disagreed. To settle the argument, Dennis placed an ad and selected a small group of everyday people.,They included teachers, musicians, engineers, and people who had never traded before. He trained them for two weeks. Then gave them real capital to trade.
What Strategy Did the Turtles Follow? (Simple and Powerful)
Breakout Entry:
They entered trades when price crossed a 20-day or 55-day high or low.
Trend Following:
They stayed in the trade until the trend reversed.
Position Sizing:
They calculated trade size based on market volatility.
ATR-Based Stop Loss:
Each trade had a fixed stop loss using Average True Range.
Multi-Market Trading:
They traded futures across different asset classes like gold, oil, corn, currencies, and indices.
How Did the Turtles Perform?
The outcome was unbelievable. Most of them made large profits. Some became hedge fund managers. The average returns were far above industry standards.
What’s important is that these were not naturally gifted traders.
They simply followed the rules, stayed consistent, and trusted the process.
Rahul Tip:
Don’t overcomplicate trading.
Even a basic breakout strategy can make money if traded with discipline and risk control.
Before chasing complex setups, ask yourself: Am I even following one simple system properly?
Conclusion:
The Turtle Trading Experiment proved that trading is not magic.
It’s a skill that can be taught, practiced, and mastered.
All you need is a solid system and the mindset to follow it every single time.
Would you trust a mechanical strategy like the Turtles did? Or do you prefer full control? Let’s talk in the comments!
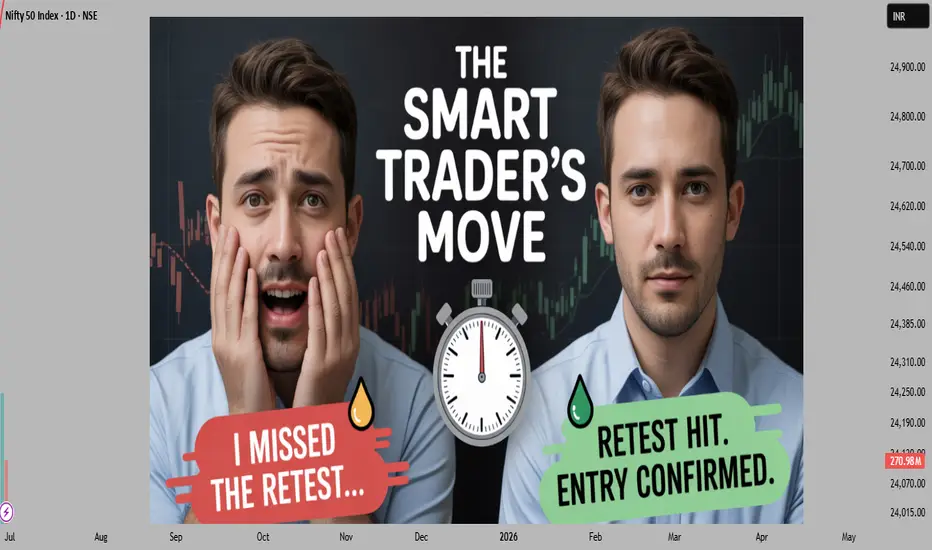
“Wait for Retest” – The Hardest Thing for Impatient Traders!Hello Traders!
How many times have you seen a perfect breakout… jumped in instantly… and then watched price pull back, hit your stop-loss, and reverse back up? You’re not alone. “Waiting for the retest” is one of the most powerful but emotionally difficult habits to build in trading — especially for impatient traders. Let’s break down why it matters and how to use it with discipline.
Why Retests Matter in Breakout Trading
Confirmation of Breakout Strength: A breakout followed by a retest shows the level is truly flipping from resistance to support (or vice versa), validating the move.
Stops Get Triggered on Fakeouts: Impulsive entries during breakout candles often lead to stop-hunting or false breakouts.
Better Risk-Reward Ratio: Waiting for the retest often gives you a tighter stop-loss and bigger upside, improving your overall risk-to-reward.
Why It’s Hard for Traders to Wait
Fear of Missing Out (FOMO): Traders fear they’ll miss the entire move if they don’t jump in on the breakout candle.
Lack of Patience or Planning: Without a pre-defined rule or system, emotions take over and lead to impulsive entries.
Overtrading Mindset: Many traders feel the need to “do something” instead of letting the setup come to them.
Rahul’s Tip
Let the market prove itself before you act. If the retest doesn’t happen, it wasn’t your trade. But if it does, it’s confirmation. That’s when you strike with confidence.
How to Master Retest Trading
Set Alerts at Key Zones: Use trading platforms to alert you when price comes back to retest the breakout or breakdown level.
Use Candlestick Confirmation: Look for bullish reversal candles at retest zones (like bullish engulfing, hammer, etc.) before entering.
Combine with Volume & Structure: Confirm that volume supports the breakout and retest isn't a weak bounce.
Conclusion
“Waiting for the retest” is about discipline, not prediction. Master this skill, and you’ll enter with more clarity, better risk control, and higher probability trades. Don’t let impulse rob you of smart setups. Be patient — your best entries will wait for you.
Have you been caught by a fake breakout recently? Share your experience in the comments and let’s grow together!
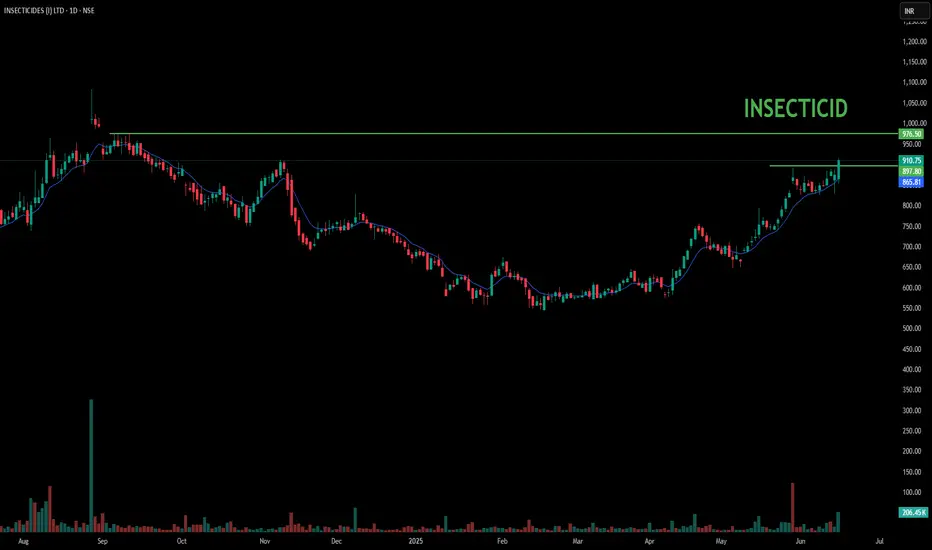
INSECTICIDES - BREAKOUT STOCK📈 Insecticides (India) Ltd – Breakout Stock on the Radar
Insecticides India is currently exhibiting strong technical momentum, supported by high volumes and a confirmed breakout on the charts. The stock has surpassed key resistance levels, indicating potential for short- to medium-term upside. Traders and investors should keep this stock on their watchlist for further price action confirmation.
🔍 Key Observations
Breakout from a consolidation zone
Rising volumes supporting the move
Technical indicators signaling bullish momentum
📌 This update is purely for informational and educational purposes only and not a recommendation to buy or sell any securities. Please do your own research or consult a SEBI-registered advisor before making any investment decisions.
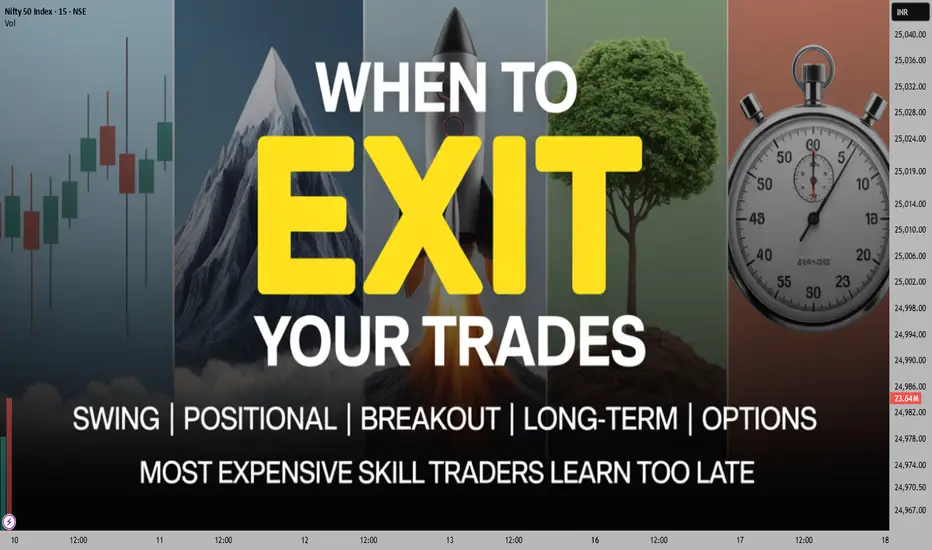
When to Exit a Trade: Exit Plan for Every Trading Style!Hello Traders!
Every trade type needs a different kind of exit plan — but most traders use one-size-fits-all. That’s why they either exit too soon or too late.
Today, I’ll break down how to plan your exits based on trade type and intention .
A smart exit plan fits the nature of the trade — not just your emotion in the moment.
Exit Plan for Swing Trades
Target Based: Pre-decide 1:2 or 1:3 risk-reward levels.
Trailing SL (Candle Based): Move SL below each higher low in uptrend.
Exit on Structure Break: If price breaks key swing low, exit immediately.
Exit Plan for Positional Trades
Weekly Chart View: Exit only if weekly trend changes or closes below trendline.
Partial Booking: Book some profits at resistance zones, hold rest for trend continuation.
News/Events SL: Avoid holding through uncertain events unless strategy-backed.
Exit Plan for Long-Term Trades (Investment Trades)
Fundamental Exit: Exit only if company fundamentals weaken or story changes.
Valuation-Based Exit: Exit when valuations are stretched beyond long-term average.
Exit in Phases: Don’t exit fully — scale out in parts across 10-20% intervals.
Exit Plan for Breakout Trades
Multi-Year Breakout: Hold till price holds above breakout zone on weekly chart.
2-Week Breakout: Use previous resistance as SL. Exit if it fails to sustain above it.
Volume Confirmation: Exit if breakout happens on weak volume and fails to follow through.
Exit Plan for Options Trades
Defined SL in Premium: Keep strict SL (e.g., ₹30 loss on ₹100 premium).
Time-Based Exit: Exit if expected move doesn’t come by your time window.
Theta Decay Watch: Exit early if holding beyond 2–3 days and premium drops without move.
Momentum Exit: Trail SL tightly once premiums start shooting.
Rahul’s Tip
Don’t treat every trade the same. Swing, positional, long-term — each needs its own exit discipline.
Your plan should depend on chart timeframe, reason for entry, and trade type — not just emotions.
Conclusion
Your exit strategy should match your trade type, not just your mood.
Once you start using the right exit logic for the right trade, your results will become more consistent, more powerful, and way less stressful.
Thanks for reading!
If this helped bring clarity, do like, share and follow for more trading insights made simple.
ETH Technicals Hint at Breakout — All Eyes on the 2588 Level📊 Cycle Structure:
HWC (Higher Wave Cycle): Bullish 🔼
MWC (Middle Wave Cycle): Ranging 🔁
LWC (Lower Wave Cycle): Bullish 🔼
The overall market structure leans bullish. With both HWC and LWC pointing upward, the directional pressure favors long setups.
❗️If you're looking for a short position, this analysis isn't for you.
🔍 Price Action Structure & Entry Scenario:
A strong resistance zone at 2588 has already been tested four times.
A fifth touch often increases the probability of a breakout — especially in a bullish-biased environment.
A 1H ascending trendline sits right below the resistance, acting as dynamic support.
📌 My Strategy: Pre-Breakout Entry
My approach focuses on entering before a confirmed breakout — riding the early wave toward resistance.
This includes watching for compression, weak selling volume, and bullish candlestick structures.
⚠️ This method is inherently riskier, and the chance of getting stopped out is higher, so solid risk management is essential.
👥 Based on trading style, here’s how different traders might approach this:
🔁 Reactive traders can wait to see how price reacts at the trendline.
🔓 Breakout traders should wait for a confirmed 15min or 1H close above 2588.
🐳 Those expecting a sharp whale-driven move may consider placing a Buy Stop Order above resistance.
🎯 Entry Levels & Risk Management:
Aggressive Entry: Pre-breakout trigger near 2588 (riskier).
Conservative Entry: Wait for a confirmed breakout candle above 2588.
Stop-loss idea: Below the 1H trendline, acting as a dynamic support.
📉 Invalidation Level:
My bullish outlook holds as long as we’re above 2387.
If price closes below that, I’ll re-evaluate for a possible short — but until then, the focus remains on the long side.
💬 Want me to analyze a specific coin?
Drop it in the comments — I’ll review and pick one for the next post.
⚠️ Without proper risk management, you're just a ticking time bomb.
— PXA 📊

Short Covering Trap Strategy – How to Catch Massive Moves!Hello Traders!
Today, we are diving into one of the most powerful and explosive setups in trading — the Short Covering Trap Strategy . When shorts get trapped and are forced to exit their positions, it can trigger massive upward moves in a very short time. If you can spot these traps early, you can ride some of the fastest rallies in the market!
What is a Short Covering Trap?
Short sellers bet on the market falling by selling first, planning to buy later at a lower price.
When the market suddenly reverses up against their position, they are forced to buy quickly to cover losses — creating a short covering rally .
This forced buying can lead to big green candles, breakout moves, and strong trend continuation .
How to Spot a Short Covering Trap
Identify Weakness or Breakdown Attempt
→ Price tries to break a support level but immediately reverses with high volume.
Sharp Reversal Candle
→ Look for strong bullish engulfing, hammer, or big green marubozu candle after false breakdown.
Volume Spike Confirmation
→ Check for sudden volume surge along with price reversal.
More volume = more trapped shorts.
Breakout Above Resistance
→ If price breaks above immediate resistance after trapping shorts, momentum can explode.
Real Example (OI Study please check chart above)
On 25th April 2025, Nifty faced rejection from the Resistance Zone around 24,100 levels.
OI data at 2 PM showed rising call writing pressure — indicating strong bearish sentiment initially.
By 3:30 PM, signs of weakening call writers emerged as put writers started adding positions, hinting at potential reversal.
On 28th April 2025, after Monday market opening, early morning OI data (9:15 AM and 10:15 AM) showed massive unwinding of call writers and heavy addition of put writing.
This sudden OI shift triggered a Short Covering Trap , leading to a quick rally of around 284 points in a short time.
Entry, Stop Loss, and Target Plan
Entry:
After confirmation candle closes above immediate resistance.
Stop Loss:
Below the reversal candle or recent swing low.
Target:
First target = Previous day's high or next major resistance.
Second target = Risk-Reward 1:2 or more.
When to Avoid This Setup
Low Volume Moves:
If the reversal happens without volume, it’s risky — avoid trading it.
Trending Down Days:
If broader market sentiment is heavily bearish, short covering may not sustain.
Rahul’s Tip
“Short covering rallies are like a firecracker — fast and furious. Ride it with strict risk control and exit smartly at targets.”
Conclusion
The Short Covering Trap Strategy offers some of the best risk-reward trades, especially in volatile markets. Recognize the signs early, manage your risk, and you can catch powerful explosive moves before the crowd!
Have you ever caught a massive short covering rally? Share your best trades and experiences in the comments below!
If you found this post valuable, don't forget to LIKE and FOLLOW !
I regularly share real-world trading setups, actionable strategies, and learning-focused content — all from real trading experience, not theory. Stay connected if you're serious about growing as a trader!

Survive & Succeed as an Option Buyer – Use This 2-Step Filter!Option Buyer’s Survival Setup – Only Trade When These 2 Conditions Match!
Hello Traders!
Option buying can be highly rewarding — but only if done with timing and logic. Most option buyers lose money not because of direction, but because they enter trades when volatility and structure don’t support the move . Today, let’s uncover a simple but powerful setup I use that helps option buyers survive and thrive by trading only when two key conditions align.
The 2 Conditions for Option Buyers’ Survival
1. Price Action Confirmation:
Always enter trades when the price breaks key levels with a strong candle and volume confirmation .
→ Look for breakout/rejection candles, bullish/bearish engulfing, or range breakout retest setups .
2. IV/VIX Support for Momentum:
Check India VIX or option premiums.
→ Trade only when VIX is supportive (e.g., rising or above 13–14) to allow enough premium expansion.
→ Avoid buying in low VIX chop zones unless supported by strong news or breakout.
Why This Setup Works So Well
Avoids Time Decay Traps: You enter only when a move is expected — not during sideways chop.
Improves RR Ratio: Strong confirmation = better entry + reduced SL hits.
Filters Out Noise: Stops you from overtrading every price move and focuses only on high-conviction trades.
Bonus Tips for Buyers
Prefer ATM Options in Momentum Trades for better delta and faster movement.
Exit Partial at 30–40% Move and trail remaining to maximize runners.
Don’t Trade Every Move — Wait for these 2 rules to align, or skip.
Rahul’s Tip
Being an option buyer is tough – unless you're selective. Don’t buy hope. Buy confirmation. Let structure and volatility guide your trade.
Conclusion
Option buying is a game of survival and sharp entries. If you follow these 2 key rules — structure + volatility confirmation — you’ll avoid unnecessary SL hits and capture the real moves. Discipline is your edge.
What’s your personal filter before buying options? Share below and let’s learn together!

Doji Sandwich + Volume Spike = 10/10 Trades If You Spot It RightHello Traders!
Today, let’s talk about a highly underrated but powerful candlestick pattern — the Doji Sandwich . When this pattern appears with a volume spike , it can give you a high-probability breakout or breakdown setup . If you’ve ever missed strong moves because of late entries, this one’s for you.
Let’s decode how to spot it, trade it, and why it works so well.
What is the Doji Sandwich Pattern?
Structure: The pattern consists of three candles — a strong candle (bullish or bearish), followed by a Doji , and then another strong candle in the same direction as the first.
Indecision Trap: The Doji shows indecision, but the follow-up candle confirms that the previous trend will continue.
Reliability Boost: When supported by a volume spike on the third candle, it becomes a powerful confirmation of trend continuation.
How to Trade the Doji Sandwich Setup
Entry: Enter on the breakout of the third candle (closing above or below the Doji range).
Stop Loss: Place your stop loss just below the Doji (in bullish case) or above it (in bearish case).
Volume Confirmation: Make sure the third candle is accompanied by a visible volume spike — this confirms institutional activity.
Ideal Timeframe: 15min, 1hr, or Daily chart — depending on your trading style (intraday or swing).
When Does It Work Best?
Near support/resistance zones — as a continuation signal.
After a short pullback or consolidation .
In trending markets where volume confirms momentum.
Rahul’s Tip
Always combine price pattern + volume confirmation. A Doji Sandwich alone is good, but with a volume spike — it’s fire🔥. Don’t just watch it — prepare for it.
Conclusion
The Doji Sandwich pattern is one of those rare 10/10 setups when spotted correctly with volume. Simple, clean, and powerful — it can help you catch big moves early. Add it to your watchlist strategy, and you’ll never ignore this combo again!
Have you ever traded this pattern? Share your experience below, and let’s learn from each other!

What is 'Hot Money Flow' and How to Use It in Your Trades!Hello Traders!
Ever noticed how certain stocks or sectors suddenly get all the attention — with volume, price action, and buzz? That’s called Hot Money Flow . It’s the smart money rotating quickly into momentum plays — and as traders, learning how to follow it can give you a serious edge.
Let’s break it down in simple terms and learn how to ride the wave instead of missing it.
What is Hot Money Flow?
It refers to fast-moving capital that flows into stocks or sectors showing strength, momentum, or fresh news.
Smart money (like institutions, FII, or big traders) quickly shifts funds to chase short-term gains in active names.
It creates high volume, fast price movement, and short-term volatility — perfect for intraday or swing trades.
How to Identify Hot Money Flow
High Relative Volume (RVOL): Stocks trading at 2x or more their average volume show active interest.
Sector Rotation Clues: If multiple stocks from the same sector are moving together, hot money may be flowing there.
News Triggers: Stocks reacting to news, results, or budget-related triggers often attract hot money.
Breakouts with Volume: A clean breakout supported by volume is a classic hot money setup.
How to Trade with Hot Money Flow
Act Fast, But Smart: These trades don’t last forever. Enter with a clear plan — don’t chase after the move is done.
Use Tight Stop Losses: Hot money reversals can be sharp. Risk management is key.
Monitor Sector Leaders: If leaders break down, the rest may follow — stay alert.
Exit Early or Trail SL: Lock profits quickly or trail SL — these trades are momentum-based, not long-term.
Rahul’s Tip
Hot money creates waves — your job is to ride them, not fight them. Follow volume, news, and sectors — and trade like a sniper, not a machine gun.
Conclusion
Hot Money Flow is a powerful clue that shows where action is happening. If you learn to spot it early — using RVOL, sector activity, and breakouts — you’ll position yourself ahead of the crowd. Just remember, speed and discipline matter most in this game.
Have you ever caught a hot money move early? Let’s discuss in the comments below!

Short Term Trading Idea for Power Grid Corp Ltd.Hello everyone, i hope you all will be doing good in your trading and your life as well. Today i have brought an idea which is for power sector leader stock. Yes it is Nifty50 stock, Please check chart aove for 1-hour chart of Power Grid Corp Ltd ., we can see a clear Inverted Head and Shoulders pattern, a bullish reversal formation indicating potential upside movement. The breakout from the neckline has already occurred, with a significant volume spike confirming the strength of the move. This breakout suggests the stock is likely to continue its upward momentum in the short term.
For entry, consider buying within the range of 272-267 with a stop loss at 262 . The first target is set at 278 , followed by 286 and a final target of 292 , offering an estimated upside of 8.5% . The strong volume during the breakout adds confidence to this trade, making it a solid short-term opportunity with a good risk-to-reward ratio. Always be mindful of price action around entry points and adjust your strategy accordingly.
I have an option trade as well for this strategy:
For option buying:- Take 265ce which is trading at 10.15, and keep strictly stop loss at 6.5 and Targets will be 12.25/14.65/17.15++
For Option writing (Sell) with hedging:- Sell 275 pe which is trading at 8.05 and buy 265 pe which is now at 3.75. ( I will suggest you to choose this strategy )
NOTE:- Please strictly follow stop loss,options trading carry huge risk and reward so trade carefully or simply go with cash trade.
Disclaimer: This analysis is for educational purposes only. Please consult a financial advisor before making investment decisions.
If you Found this helpful? Don’t forget to like, share, and drop your thoughts in the comments below.

Volatility Contraction Pattern (VCP)-Breakout Strategy ExplainedHello everyone! I hope you’re doing great, not just in life but also in your trading journey. Today, I’m here to share something exciting—a strategy I started using just a few months ago. It’s been performing really well for me, and I’m confident that if you use it properly, you’ll see great results too.
So, without wasting any more time, let’s get straight to it. Here we go!
Volatility Contraction Pattern (VCP): A Blueprint for Explosive Breakouts
The Volatility Contraction Pattern (VCP) is one of the most powerful chart patterns I’ve come across. It reveals when a stock is gearing up for a significant breakout. By understanding how price tightens over time and paying close attention to volume behavior, traders can catch high-probability moves before they unfold .
Let’s take a closer look at this concept using the example shown in the chart above.
What Is the VCP?
The VCP is all about price contractions. Here’s what typically happens:
Each pullback becomes smaller, signaling reduced volatility.
Volume starts to decline, which shows that sellers are losing steam.
Finally, the breakout occurs, often with a surge in volume, confirming the move.
It’s like a spring coiling tighter and tighter until it bursts free.
Step-by-Step Breakdown of Chart above
1. First Contraction (-19.31%)
This is where the pattern begins. The stock sees a sharp correction of 19.31%, showing some initial volatility.
At this point, volume begins to decrease, which is the first clue that sellers are starting to back off.
2. Second Contraction (-9.34%)
The price recovers but pulls back again, this time by just 9.34%.
This smaller contraction is a clear sign of the tightening price action, which is a hallmark of the VCP.
3. Third Contraction (-6.70%)
Another pullback happens, but now it’s even smaller—just 6.70%.
Volume continues to decline during this phase, further confirming that selling pressure is steadily fading.
4. Fourth Contraction (-4.56%)
The final contraction is the tightest of all, with a pullback of only 4.56%.
At this stage, the price is moving in a very narrow range, setting the stage for the big breakout.
Breakout
The stock finally breaks above the ₹5,000 resistance zone with a surge in volume.
This is the signal traders wait for—the confirmation that buyers are stepping in with strength.
How to Trade the VCP
Here’s how you can trade this pattern effectively:
Spot the Pattern:
Look for a sequence of contractions where each pullback is smaller than the previous one. Draw trendlines connecting the highs and lows to visualize the tightening range.
Volume Behavior:
Make sure that volume decreases during contractions and spikes significantly on the breakout.
Entry Point:
Enter the trade when the price breaks above the resistance level with high volume (₹5,000 in this case).
Stop-Loss Placement:
Place your stop-loss slightly below the last contraction low (₹4,500 here) to limit your risk.
Profit Targets:
Use trailing stops or set predefined targets based on previous price movements to lock in your gains.
Key Observations on the Chart
Take a moment to review the chart above, and here’s what stands out:
Resistance Zone (₹5,000):
The resistance level acted as a strong barrier, containing price until the breakout.
Consolidation Zone:
The price moved within a tightening range, building up energy for the breakout.
Volume Behavior:
Volume steadily declined during each contraction, and a spike in volume confirmed the breakout.
Breakout Candle:
The large breakout candle above ₹5,000 was the ultimate signal for entry.
Why Does the VCP Work?
The VCP reflects the psychology of the market:
Fear Fades: Each contraction shows that sellers are losing control.
Demand Grows: Buyers quietly step in, creating higher lows.
Energy Builds: As price tightens, the stock prepares for an explosive move.
Context Is Key:
The VCP works best in trending markets or fundamentally strong stocks. Always consider the bigger picture
.
Volume Is Crucial:
Without a volume surge, breakouts might not sustain. Be cautious of false signals.
Conclusion
The Volatility Contraction Pattern (VCP) is a highly reliable setup for spotting breakout opportunities. Once you master this pattern, you’ll be able to identify and trade high-probability moves with confidence.
Take a close look at the chart above to see how this setup played out in this example. Have you noticed similar patterns in other stocks? Share your thoughts in the comments—I’d love to hear your insights!
If you found this strategy or educational content helpful, don’t forget to hit the like button and show your support. It keeps me motivated to share more valuable insights with you all! 😊

CANFINHOME - The Ascending Triangle PatternCan Fin Homes Ltd has recently exhibited a notable range-bound movement, forming an ascending triangle pattern that highlights its price consolidation phase. The stock oscillated between key price levels, with a significant high of 938 on July 1st and a low of 680 on June 4th, before peaking at 909.80 on July 25th. This range-bound behavior reflects a period of accumulation and steady buying pressure, as the price repeatedly tests the horizontal resistance while respecting the upward-sloping support line. This consolidation phase is crucial as it sets the stage for a potential breakout, indicating that the stock is gearing up for a significant directional move. The pattern suggests that investors are increasingly optimistic, with the price confined within these key levels, paving the way for future volatility and trading opportunities. In this analysis, we will explore three key trading strategies for CANFINHOME based on the recent ascending triangle pattern. First, we will examine the Breakout Strategy, which capitalizes on the price movement once it surpasses key resistance levels. Next, we will discuss the Pullback Strategy, focusing on entering trades during price retracements to the breakout level. Finally, we will consider the Breakdown Strategy, which prepares for a potential bearish reversal if the price falls below critical support levels. Each strategy will be detailed with entry points, stop losses, and targets to help you make informed trading decisions.
In this analysis, we will explore three key trading strategies for CANFINHOME based on the recent ascending triangle pattern. First, we will examine the Breakout Strategy, which capitalizes on the price movement once it surpasses key resistance levels. Next, we will discuss the Pullback Strategy, focusing on entering trades during price retracements to the breakout level. Finally, we will consider the Breakdown Strategy, which prepares for a potential bearish reversal if the price falls below critical support levels. Each strategy will be detailed with entry points, stop losses, and targets to help you make informed trading decisions.
Breakout Strategy:
Entry Point: For an optimal entry, consider buying above 914 as an early signal or above 938 for a regular entry. This indicates a confirmed breakout from the ascending triangle pattern, signaling strong bullish momentum.
Stop Loss: Place your stop loss just below the support level of 838. This precautionary measure helps safeguard against potential reversals or false breakouts.
Target: Set your price target around 1196. This level is calculated by adding the vertical height of the triangle to the breakout point, reflecting the expected upward movement based on the pattern.
Rationale: Entering at 914 or 938 allows you to capitalize on the upward potential following the breakout. With a stop loss at 838, you manage risk effectively. The target of 1196 aligns with the pattern’s projection, maximizing your profit potential.
Pullback Strategy:
Entry Point: Look for a buying opportunity during a pullback to the breakout level around 914 or the support level of 903.85. This approach leverages a temporary price retracement to secure a more advantageous entry.
Stop Loss: Position the stop loss below the support level of 838 to mitigate risk in case the pullback evolves into a deeper correction.
Target: Maintain the target at approximately 1196, consistent with the breakout strategy.
Rationale: The pullback strategy offers a chance to enter at a better price while confirming the validity of the breakout. The stop loss below 838 provides protection against significant losses, and the target of 1196 remains aligned with the anticipated price movement.
Breakdown Strategy:
Entry Point: If the price drops below the key support level of 838, consider this a breakdown of the ascending triangle pattern. This shift indicates a bearish reversal and a potential shift in market sentiment.
Stop Loss: Set the stop loss above the support level of 838 to prevent substantial losses if the breakdown proves to be a false signal.
Target: For a breakdown scenario, the target will need to be adjusted based on new technical analysis of lower support levels. Immediate downside targets should be reevaluated as the situation unfolds.
Rationale: The breakdown strategy addresses the possibility of a bearish reversal when the support level is breached. The stop loss above 838 helps limit potential losses, while the target will depend on further analysis of the emerging support levels.
Conclusion :
The ascending triangle pattern for Can Fin Homes Ltd indicates a bullish outlook with a potential price target of 1196 if the breakout is confirmed. The breakout strategy aims to capture the upward trend, while the pullback strategy provides an opportunity to enter during a retracement. Conversely, the breakdown strategy prepares for a potential bearish scenario if the support level is breached. Each strategy includes specific entry points, stop losses, and targets, offering a comprehensive approach to trading based on the pattern’s analysis.
Disclaimer :
The information provided in this article is for educational and informational purposes only and should not be construed as financial advice. Trading and investing in the stock market involve risk, and you should consult with a qualified financial advisor before making any investment decisions. The author and the publisher are not responsible for any losses or damages that may occur as a result of using the information provided in this article. Past performance is not indicative of future results. Always conduct your own research and due diligence before making any investment decisions.
*** Hint*** Use a buffer at entry to avoid false breakout

HOW TO USE DESCENDING TRIANGLE AS A SETUP?This is Berger Paint stock. In this stock Descending triangle is forming.
* What is the Descending triangle pattern?
- A descending triangle is a chart pattern used in technical analysis created by drawing one
trend line connecting a series of lower highs and a second horizontal trend line connecting a
series of lows.
A regular descending triangle pattern is commonly considered a bearish chart pattern or a
continuation pattern with an established downtrend. However, a descending triangle pattern
can also be bullish, with a breakout in the opposite direction, and is known as a reversal
pattern.
So here it is in Bandhan Bank support is at 190. and stock is in the accumulation phase from the long term. From above we will connect lower high and down we make a support zone. Now stock is in stock and ready to fly.
* How will we know that stock is ready to move using descending triangle?
- Lower High
- Time at support zone
- Bullish Candle at support
All this step is to be followed. Then it is the best setup.
-

Swing Breakout Stocks for Tomorrow | Breakout Stocks to Buy Now#swingtrading , #breakoutsignals
In
this video, we're going to share with you our top 5 #breakoutstocks for tomorrow! These stocks are poised to make big moves in the coming days, so be sure to check them out!
And finally, in this video, we'll give you some tips on how to invest in breakout stocks. We'll share with you our tips on how to find breakout stocks, how to trade them, and how to find :-
1. Breakout Stock
2. Breakout Stocks for Next Week
3. Breakout Stocks for Tomorrow
4. Breakout Stocks of The Week
5. Breakout Stocks to Buy Now
6. Breakout Stocks Tomorrow
7. Best Breakout Stocks for Tomorrow
8. Positional Breakout Stocks
9. Positive Breakout Stocks for Swing Trading
10. Positive Breakout Stocks
11. Swing Breakout Stocks for Tomorrow
12. Tomorrow Breakout Stocks
13. Tomorrow Intraday Breakout Stocks
14. Top breakout Stocks for Today
15. Top Breakout Stocks
------------------------------------------------------------------------------------------------------------------------
Welcome to the official youtube channel of India's first Retail Investors community BREAKOUT SIGNALS!
The purpose of this channel is to spread knowledge and awareness about the Stock Market for free. We do extensive fundamental and technical analysis and give recommendations solely based on our research.
Disclaimer: We are not SEBI registered. All the content (videos, comments, posts, community posts, live streaming, etc) of this channel is for educational and informational purposes only, Conduct your own due diligence, or consult a licensed financial advisor or broker before making any and all investment decisions.
-----------------------------------------------------------------------------------------------------------------------------
#breakoutsstocksfortomorrow
#swingtradestrategy #tradingstrategies #tradingstrategy #tradingstrategies #swingtrader #swingtrading #swingstocks #swingidea

Turbo Breakout Setup: High-Probability Trades with Precision.NSE:CNXFINANCE
Hello Traders,
In this video, I have explained a Breakout trading setup that will generate only high-probability breakout trades, that have high success rate than another breakout.
The setup is based on a pure price action structure and does not require any indicators just we are using volume as a confirmation tool.
Why does this setup work?
The logic is very simple
let's talk about the 1st variation of this setup:- Fake Breakout
as you can see in this setup most of the time the structure completes after a fake breakout.
So that fake breakout means the short sellers in the correction phase trying to defend there stop loss and make prices go down but what do you think for how long they will be able to defend that zone when buyers' strength is increasing? so after that when buyers push the price a little above-failed breakout zone the price hits short sellers stop losses and include new buying at that level to push prices toward the sky.
What about scenario 2nd:- NO failed breakout but horizontal range inside trend resistance line.
When the trend Resistance line and horizontal line break at the same price point it invites many traders to put a limit order above that horizontal line and most of the short sellers also have put their stop loss when that zone hit the price again and start moving towards the sky.
Other factors and detailed setup have been explained in the video.
Any setup is useless without a pre-defined stop loss cause you need to focus on capital protection first then you can aim for profits.
Always take calculated risks and use proper position sizing.
This is only for educational purposes only.
Always trade with stop-loss.
I hope you found this idea helpful.
Please like and comment.
Share with Your Friends.
Keep Learning,
Happy Trading!

#Unitedspirits 6 year resistance rounding pattern breakout6 year old resistance has been clearly broken when breakout happened last week.
Volumes are above average with momentum and trend indicator bullish on all time patterns
It is rounding pattern breakout on long term timeframes too and could be forming cup and handle as well.
Up move is expected to sustain considering all these

#hindustanuniliver #HUL : broke out of resistance within channelthis stock is riding a multi year trendline channel and has broken out of a previous resistance tested 4
times in 1.5 years. momentum is bullish on all timeframes but an entry now may not be ideal and
it could now take a dip in a week or two and reverse and watching the candle pattern on signals of reversals could give
a multiweek swing trade if there is patience.

L&Tinfotech : double bottom breakout in progressL&T infotech : double bottom breakout in progress. Momentum and trend bullish on all timeframes .
latest daily candle is open = low bullish pattern and likely to trend up.
stop loss could be close below breakout neckline. trailing could be done on daily trendline breach and close also could be indication
for short swing trades.
LLong

Fortis Healthcare - Multiyear Breakout StockFortis Healthcare stock given a bullish multiyear breakout above 220 & sustained above 220 and presently trading at 233 levels. The stock is expected to give multifold return in coming years with the new management in action since 2019 and now we can see the outperformance in this stock. So one can think of adding this stocks in their portfolio, stop loss to be used in case the stock did't work out.
The Post is only for Educational Purpose.


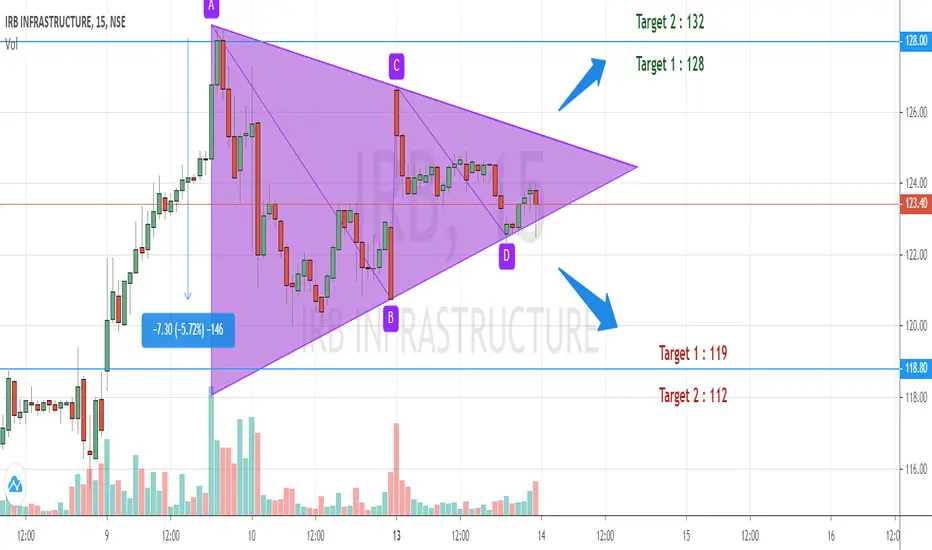
Triangle Breakout!!TRADING PSYCHOLOGY : The stock forms a triangle pattern when the tug of war between BULLS and BEARS is at the end stage where one is bound to give up.
AC line will act as resistance line.
BD line will act as support line.
when to trade : The candlestick has to break the support/resistance line with increasing volume to confirm the direction.
STOP LOSS: If the breakout is upwards then support line will act as stop loss.
If the breakout is downwards then resistance will act as stop loss.
PS : This is 15 minute candlestick chart so the targets are most likely to achieve in 1-2 days.
The accuracy of this strategy is 80%.