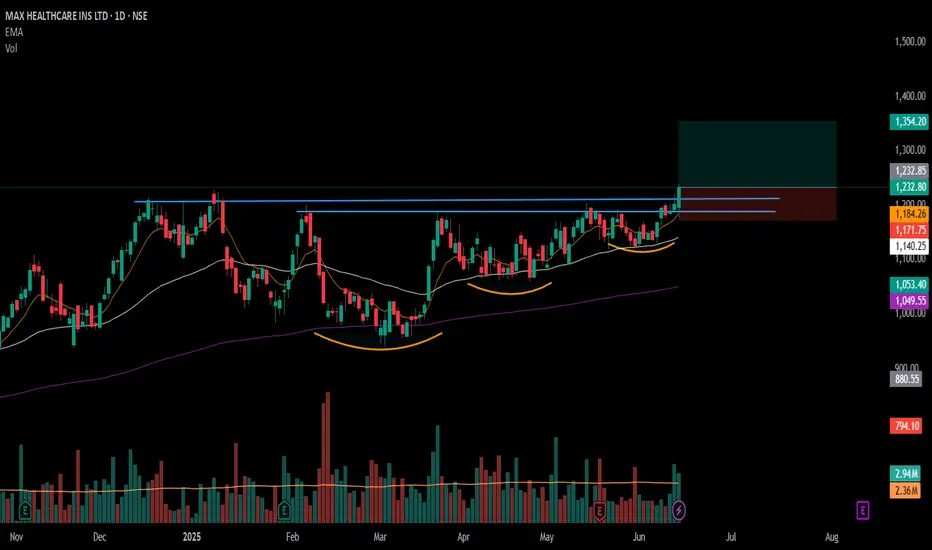
#MAXHEALTH - VCP Set up Breakout in Daily Time Frame📊 Script: MAXHEALTH
Key highlights: 💡⚡
📈 VCP Set up Breakout in Daily Time Frame.
📈 Price consolidating near Resistance, then Breakout.
📈 Volume spike seen during Breakout.
📈 MACD Cross
📈 Can go for a swing trade
BUY ONLY ABOVE 1235 DCB
⏱️ C.M.P 📑💰- 1232.80
🟢 Target 🎯🏆 – 11%
⚠️ Stoploss ☠️🚫 – 5%
⚠️ Important: Market conditions are Okish, Position size 50% per Trade. Protect Capital Always
⚠️ Important: Always Exit the trade before any Event.
⚠️ Important: Always maintain your Risk:Reward Ratio as 1:2, with this RR, you only need a 33% win rate to Breakeven.
✅Like and follow to never miss a new idea!✅
Disclaimer: I am not SEBI Registered Advisor. My posts are purely for training and educational purposes.
Eat🍜 Sleep😴 TradingView📈 Repeat 🔁
Happy learning with MMT. Cheers!🥂
Breakouttrade
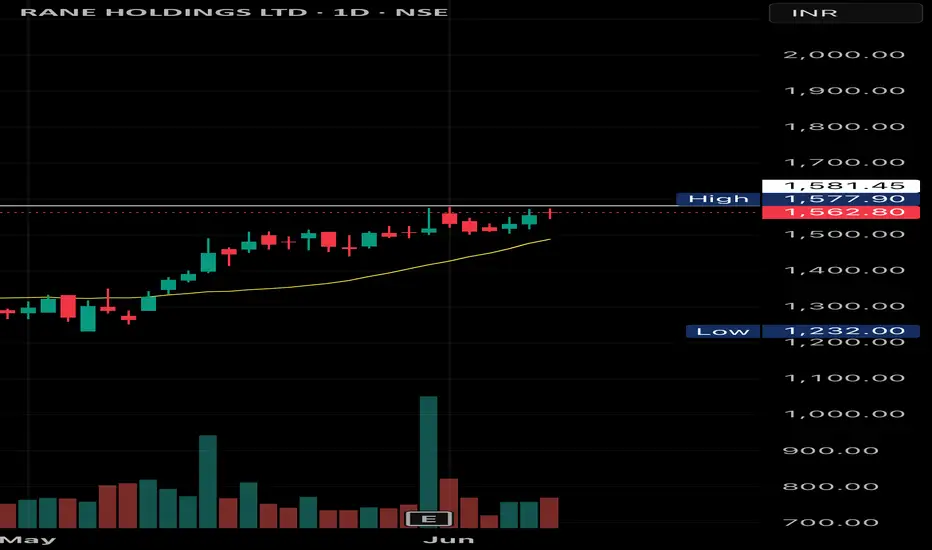
RANE HOLDING SWING TRADE SETUPRane holding swing trade setup. Breakout soon possible, can be a good breakout above 1581 and stop loss Below 1544. Analyse yourself before entry
Share your view on this
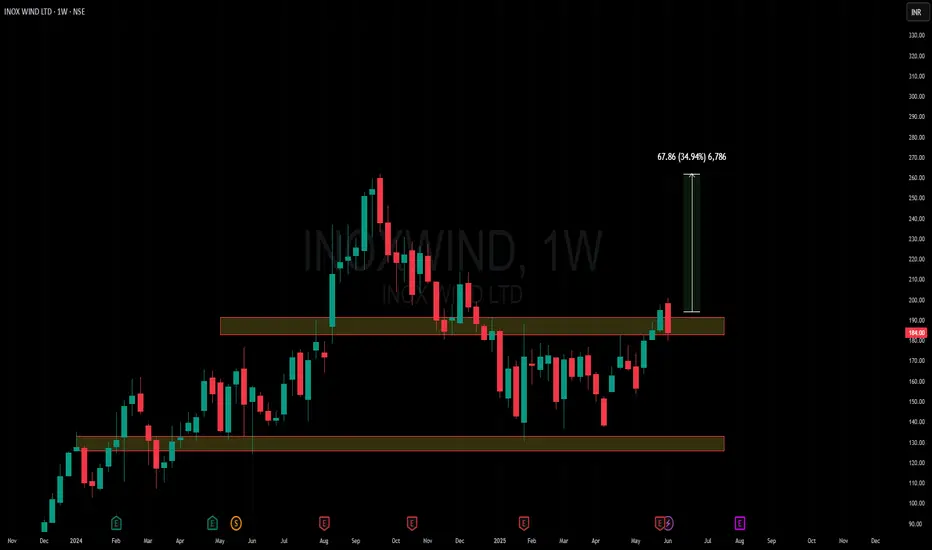
Amazing breakout on WEEKLY Timeframe - INOXWINDCheckout an amazing breakout happened in the stock in Weekly timeframe, macroscopically seen in Daily timeframe. Having a great favor that the stock might be bullish expecting a staggering returns of minimum 25% TGT. IMPORTANT BREAKOUT LEVELS ARE ALWAYS RESPECTED!
NOTE for learners: Place the breakout levels as per the chart shared and track it yourself to get amazed!!
#No complicated chart patterns
#No big big indicators
#No Excel sheet or number magics
TRADE IDEA: WAIT FOR THE STOCK TO BREAKOUT IN WEEKLY TIMEFRAME ABOVE THIS LEVEL.
Checkout an amazing breakout happened in the stock in Weekly timeframe.
Breakouts happening in longer timeframe is way more powerful than the breakouts seen in Daily timeframe. You can blindly invest once the weekly candle closes above the breakout line and stay invested forever. Also these stocks breakouts are lifelong predictions, it means technically these breakouts happen giving more returns in the longer runs. Hence, even when the scrip makes a loss of 10% / 20% / 30% / 50%, the stock will regain and turn around. Once they again enter the same breakout level, they will flyyyyyyyyyyyy like a ROCKET if held in the portfolio in the longer run.
Time makes money, GREEDY & EGO will not make money.
Also, magically these breakouts tend to prove that the companies turn around and fundamentally becoming strong. Also the magic happens when more diversification is done in various sectors under various scripts with equal money invested in each N500 scripts.
The real deal is when to purchase and where to purchase the stock. That is where Breakout study comes into play.
Check this stock which has made an all time low and high chances that it makes a "V" shaped recovery.
> Taking support at last years support or breakout level
> High chances that it reverses from this point.
> Volume dried up badly in last few months / days.
> Very high suspicion based analysis and not based on chart patterns / candle patterns deeply.
> VALUABLE STOCK AVAILABLE AT A DISCOUNTED PRICE
> OPPURTUNITY TO ACCUMULATE ADEQUATE QUANTITY
> MARKET AFTER A CORRECTION / PANIC FALL TO MAKE GOOD INVESTMENT
DISCLAIMER : This is just for educational purpose. This type of analysis is equivalent to catching a falling knife. If you are a warrior, you throw all the knives back else you will be sorrow if it hits SL. Make sure to do your analysis well. This type of analysis only suits high risks investor and whose is willing to throw all the knives above irrespective of any sectoral rotation. BE VERY CAUTIOUS AS IT IS EXTREME BOTTOM FISHING.
HOWEVER, THIS IS HOW MULTIBAGGERS ARE CAUGHT !
STOCK IS AT RIGHT PE / RIGHT EVALUATION / MORE ROAD TO GROW / CORRECTED IV / EXCELLENT BOOKS / USING MARKET CRASH AS AN OPPURTUNITY / EPS AT SKY.
LET'S PUMP IN SOME MONEY AND REVOLUTIONIZE THE NATION'S ECONOMY!
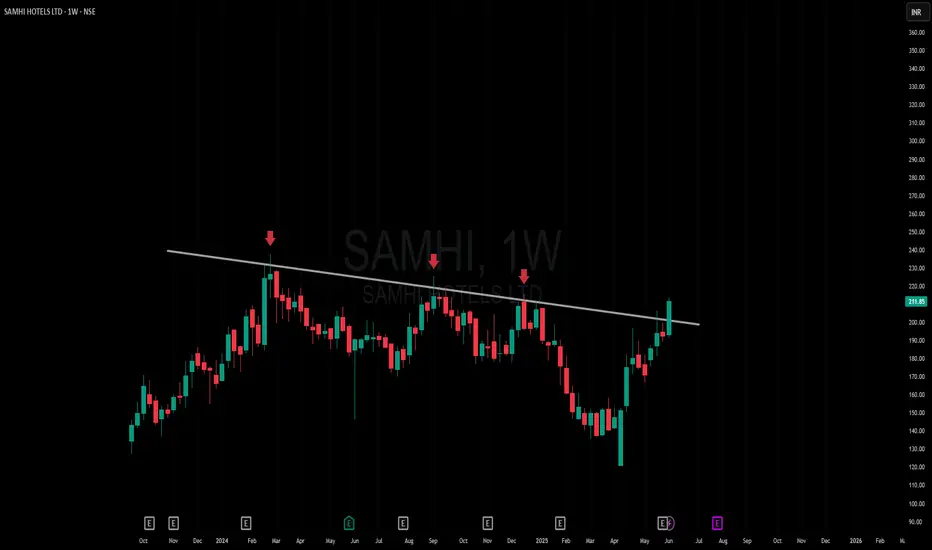
Amazing breakout on WEEKLY Timeframe - SAMHICheckout an amazing breakout happened in the stock in Weekly timeframe, macroscopically seen in Daily timeframe. Having a great favor that the stock might be bullish expecting a staggering returns of minimum 25% TGT. IMPORTANT BREAKOUT LEVELS ARE ALWAYS RESPECTED!
NOTE for learners: Place the breakout levels as per the chart shared and track it yourself to get amazed!!
#No complicated chart patterns
#No big big indicators
#No Excel sheet or number magics
TRADE IDEA: WAIT FOR THE STOCK TO BREAKOUT IN WEEKLY TIMEFRAME ABOVE THIS LEVEL.
Checkout an amazing breakout happened in the stock in Weekly timeframe.
Breakouts happening in longer timeframe is way more powerful than the breakouts seen in Daily timeframe. You can blindly invest once the weekly candle closes above the breakout line and stay invested forever. Also these stocks breakouts are lifelong predictions, it means technically these breakouts happen giving more returns in the longer runs. Hence, even when the scrip makes a loss of 10% / 20% / 30% / 50%, the stock will regain and turn around. Once they again enter the same breakout level, they will flyyyyyyyyyyyy like a ROCKET if held in the portfolio in the longer run.
Time makes money, GREEDY & EGO will not make money.
Also, magically these breakouts tend to prove that the companies turn around and fundamentally becoming strong. Also the magic happens when more diversification is done in various sectors under various scripts with equal money invested in each N500 scripts.
The real deal is when to purchase and where to purchase the stock. That is where Breakout study comes into play.
Check this stock which has made an all time low and high chances that it makes a "V" shaped recovery.
> Taking support at last years support or breakout level
> High chances that it reverses from this point.
> Volume dried up badly in last few months / days.
> Very high suspicion based analysis and not based on chart patterns / candle patterns deeply.
> VALUABLE STOCK AVAILABLE AT A DISCOUNTED PRICE
> OPPURTUNITY TO ACCUMULATE ADEQUATE QUANTITY
> MARKET AFTER A CORRECTION / PANIC FALL TO MAKE GOOD INVESTMENT
DISCLAIMER : This is just for educational purpose. This type of analysis is equivalent to catching a falling knife. If you are a warrior, you throw all the knives back else you will be sorrow if it hits SL. Make sure to do your analysis well. This type of analysis only suits high risks investor and whose is willing to throw all the knives above irrespective of any sectoral rotation. BE VERY CAUTIOUS AS IT IS EXTREME BOTTOM FISHING.
HOWEVER, THIS IS HOW MULTIBAGGERS ARE CAUGHT !
STOCK IS AT RIGHT PE / RIGHT EVALUATION / MORE ROAD TO GROW / CORRECTED IV / EXCELLENT BOOKS / USING MARKET CRASH AS AN OPPURTUNITY / EPS AT SKY.
LET'S PUMP IN SOME MONEY AND REVOLUTIONIZE THE NATION'S ECONOMY!
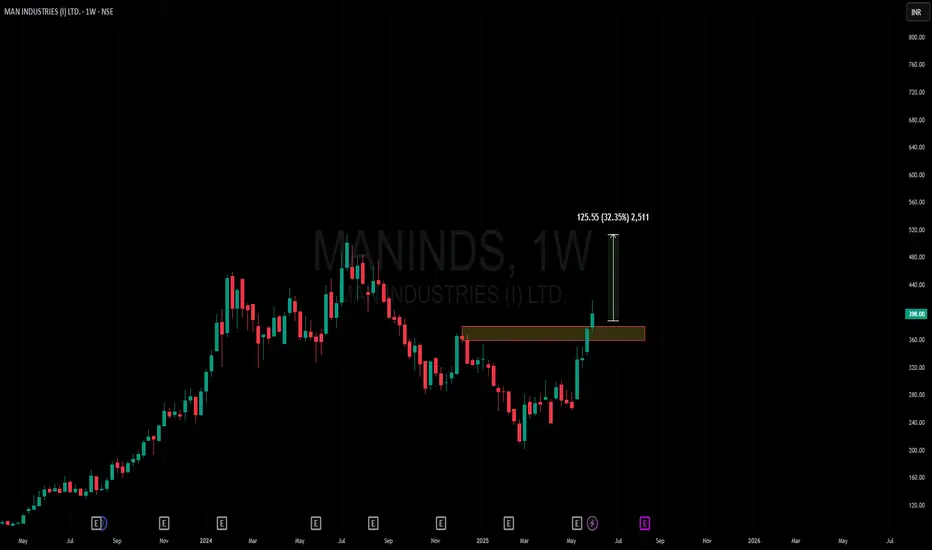
Amazing breakout on WEEKLY Timeframe - MANINDSCheckout an amazing breakout happened in the stock in Weekly timeframe, macroscopically seen in Daily timeframe. Having a great favor that the stock might be bullish expecting a staggering returns of minimum 25% TGT. IMPORTANT BREAKOUT LEVELS ARE ALWAYS RESPECTED!
NOTE for learners: Place the breakout levels as per the chart shared and track it yourself to get amazed!!
#No complicated chart patterns
#No big big indicators
#No Excel sheet or number magics
TRADE IDEA: WAIT FOR THE STOCK TO BREAKOUT IN WEEKLY TIMEFRAME ABOVE THIS LEVEL.
Checkout an amazing breakout happened in the stock in Weekly timeframe.
Breakouts happening in longer timeframe is way more powerful than the breakouts seen in Daily timeframe. You can blindly invest once the weekly candle closes above the breakout line and stay invested forever. Also these stocks breakouts are lifelong predictions, it means technically these breakouts happen giving more returns in the longer runs. Hence, even when the scrip makes a loss of 10% / 20% / 30% / 50%, the stock will regain and turn around. Once they again enter the same breakout level, they will flyyyyyyyyyyyy like a ROCKET if held in the portfolio in the longer run.
Time makes money, GREEDY & EGO will not make money.
Also, magically these breakouts tend to prove that the companies turn around and fundamentally becoming strong. Also the magic happens when more diversification is done in various sectors under various scripts with equal money invested in each N500 scripts.
The real deal is when to purchase and where to purchase the stock. That is where Breakout study comes into play.
Check this stock which has made an all time low and high chances that it makes a "V" shaped recovery.
> Taking support at last years support or breakout level
> High chances that it reverses from this point.
> Volume dried up badly in last few months / days.
> Very high suspicion based analysis and not based on chart patterns / candle patterns deeply.
> VALUABLE STOCK AVAILABLE AT A DISCOUNTED PRICE
> OPPURTUNITY TO ACCUMULATE ADEQUATE QUANTITY
> MARKET AFTER A CORRECTION / PANIC FALL TO MAKE GOOD INVESTMENT
DISCLAIMER : This is just for educational purpose. This type of analysis is equivalent to catching a falling knife. If you are a warrior, you throw all the knives back else you will be sorrow if it hits SL. Make sure to do your analysis well. This type of analysis only suits high risks investor and whose is willing to throw all the knives above irrespective of any sectoral rotation. BE VERY CAUTIOUS AS IT IS EXTREME BOTTOM FISHING.
HOWEVER, THIS IS HOW MULTIBAGGERS ARE CAUGHT !
STOCK IS AT RIGHT PE / RIGHT EVALUATION / MORE ROAD TO GROW / CORRECTED IV / EXCELLENT BOOKS / USING MARKET CRASH AS AN OPPURTUNITY / EPS AT SKY.
LET'S PUMP IN SOME MONEY AND REVOLUTIONIZE THE NATION'S ECONOMY!
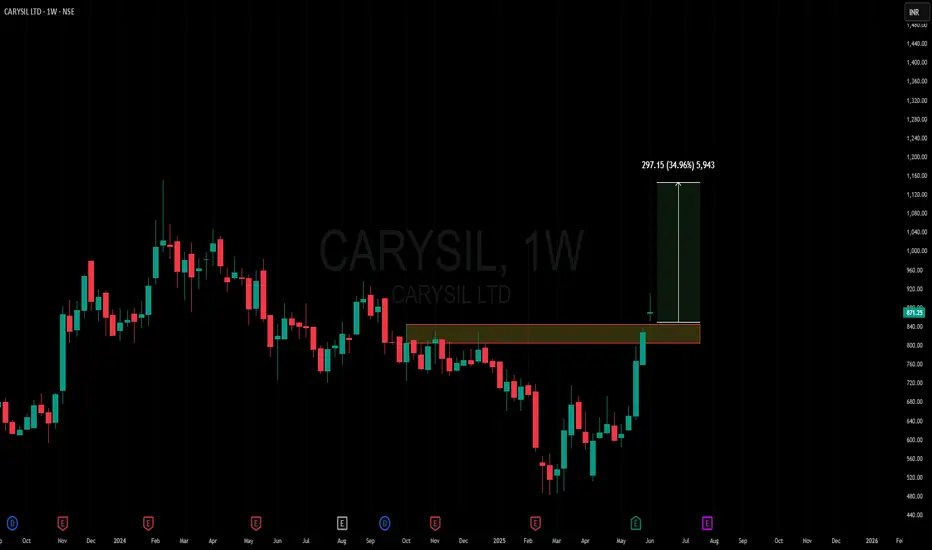
Amazing breakout on WEEKLY Timeframe - CARYSILCheckout an amazing breakout happened in the stock in Weekly timeframe, macroscopically seen in Daily timeframe. Having a great favor that the stock might be bullish expecting a staggering returns of minimum 25% TGT. IMPORTANT BREAKOUT LEVELS ARE ALWAYS RESPECTED!
NOTE for learners: Place the breakout levels as per the chart shared and track it yourself to get amazed!!
#No complicated chart patterns
#No big big indicators
#No Excel sheet or number magics
TRADE IDEA: WAIT FOR THE STOCK TO BREAKOUT IN WEEKLY TIMEFRAME ABOVE THIS LEVEL.
Checkout an amazing breakout happened in the stock in Weekly timeframe.
Breakouts happening in longer timeframe is way more powerful than the breakouts seen in Daily timeframe. You can blindly invest once the weekly candle closes above the breakout line and stay invested forever. Also these stocks breakouts are lifelong predictions, it means technically these breakouts happen giving more returns in the longer runs. Hence, even when the scrip makes a loss of 10% / 20% / 30% / 50%, the stock will regain and turn around. Once they again enter the same breakout level, they will flyyyyyyyyyyyy like a ROCKET if held in the portfolio in the longer run.
Time makes money, GREEDY & EGO will not make money.
Also, magically these breakouts tend to prove that the companies turn around and fundamentally becoming strong. Also the magic happens when more diversification is done in various sectors under various scripts with equal money invested in each N500 scripts.
The real deal is when to purchase and where to purchase the stock. That is where Breakout study comes into play.
Check this stock which has made an all time low and high chances that it makes a "V" shaped recovery.
> Taking support at last years support or breakout level
> High chances that it reverses from this point.
> Volume dried up badly in last few months / days.
> Very high suspicion based analysis and not based on chart patterns / candle patterns deeply.
> VALUABLE STOCK AVAILABLE AT A DISCOUNTED PRICE
> OPPURTUNITY TO ACCUMULATE ADEQUATE QUANTITY
> MARKET AFTER A CORRECTION / PANIC FALL TO MAKE GOOD INVESTMENT
DISCLAIMER : This is just for educational purpose. This type of analysis is equivalent to catching a falling knife. If you are a warrior, you throw all the knives back else you will be sorrow if it hits SL. Make sure to do your analysis well. This type of analysis only suits high risks investor and whose is willing to throw all the knives above irrespective of any sectoral rotation. BE VERY CAUTIOUS AS IT IS EXTREME BOTTOM FISHING.
HOWEVER, THIS IS HOW MULTIBAGGERS ARE CAUGHT !
STOCK IS AT RIGHT PE / RIGHT EVALUATION / MORE ROAD TO GROW / CORRECTED IV / EXCELLENT BOOKS / USING MARKET CRASH AS AN OPPURTUNITY / EPS AT SKY.
LET'S PUMP IN SOME MONEY AND REVOLUTIONIZE THE NATION'S ECONOMY!
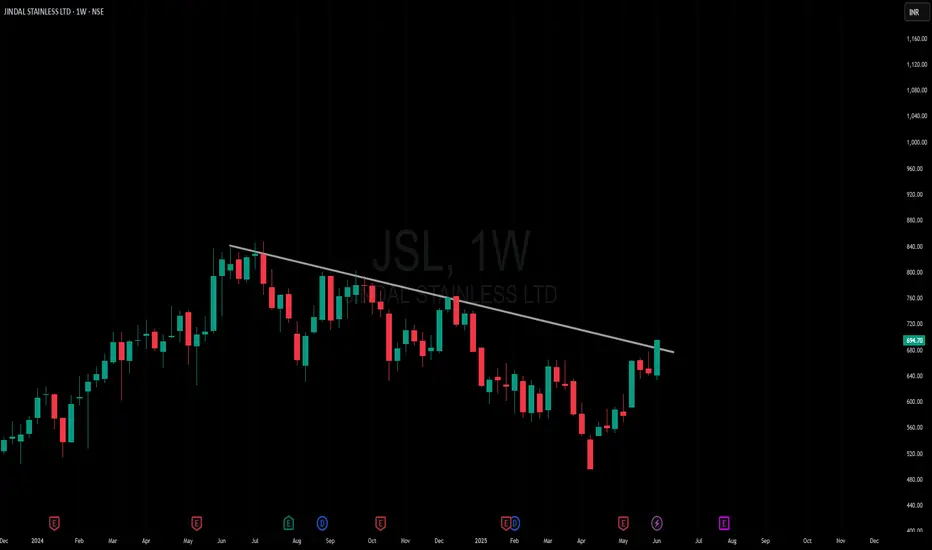
Amazing breakout on WEEKLY Timeframe - JSLCheckout an amazing breakout happened in the stock in Weekly timeframe, macroscopically seen in Daily timeframe. Having a great favor that the stock might be bullish expecting a staggering returns of minimum 25% TGT. IMPORTANT BREAKOUT LEVELS ARE ALWAYS RESPECTED!
NOTE for learners: Place the breakout levels as per the chart shared and track it yourself to get amazed!!
#No complicated chart patterns
#No big big indicators
#No Excel sheet or number magics
TRADE IDEA: WAIT FOR THE STOCK TO BREAKOUT IN WEEKLY TIMEFRAME ABOVE THIS LEVEL.
Checkout an amazing breakout happened in the stock in Weekly timeframe.
Breakouts happening in longer timeframe is way more powerful than the breakouts seen in Daily timeframe. You can blindly invest once the weekly candle closes above the breakout line and stay invested forever. Also these stocks breakouts are lifelong predictions, it means technically these breakouts happen giving more returns in the longer runs. Hence, even when the scrip makes a loss of 10% / 20% / 30% / 50%, the stock will regain and turn around. Once they again enter the same breakout level, they will flyyyyyyyyyyyy like a ROCKET if held in the portfolio in the longer run.
Time makes money, GREEDY & EGO will not make money.
Also, magically these breakouts tend to prove that the companies turn around and fundamentally becoming strong. Also the magic happens when more diversification is done in various sectors under various scripts with equal money invested in each N500 scripts.
The real deal is when to purchase and where to purchase the stock. That is where Breakout study comes into play.
Check this stock which has made an all time low and high chances that it makes a "V" shaped recovery.
> Taking support at last years support or breakout level
> High chances that it reverses from this point.
> Volume dried up badly in last few months / days.
> Very high suspicion based analysis and not based on chart patterns / candle patterns deeply.
> VALUABLE STOCK AVAILABLE AT A DISCOUNTED PRICE
> OPPURTUNITY TO ACCUMULATE ADEQUATE QUANTITY
> MARKET AFTER A CORRECTION / PANIC FALL TO MAKE GOOD INVESTMENT
DISCLAIMER : This is just for educational purpose. This type of analysis is equivalent to catching a falling knife. If you are a warrior, you throw all the knives back else you will be sorrow if it hits SL. Make sure to do your analysis well. This type of analysis only suits high risks investor and whose is willing to throw all the knives above irrespective of any sectoral rotation. BE VERY CAUTIOUS AS IT IS EXTREME BOTTOM FISHING.
HOWEVER, THIS IS HOW MULTIBAGGERS ARE CAUGHT !
STOCK IS AT RIGHT PE / RIGHT EVALUATION / MORE ROAD TO GROW / CORRECTED IV / EXCELLENT BOOKS / USING MARKET CRASH AS AN OPPURTUNITY / EPS AT SKY.
LET'S PUMP IN SOME MONEY AND REVOLUTIONIZE THE NATION'S ECONOMY!
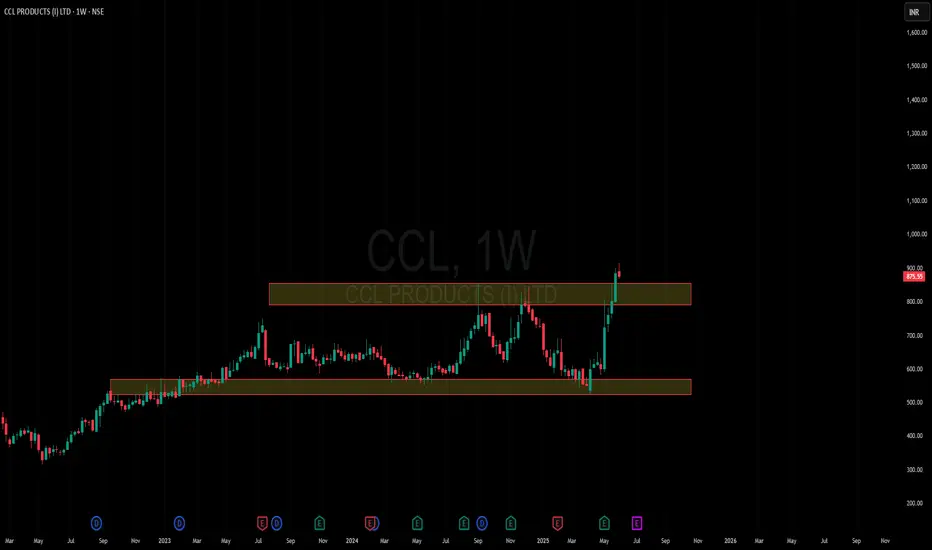
Amazing breakout on WEEKLY Timeframe - CCLCheckout an amazing breakout happened in the stock in Weekly timeframe, macroscopically seen in Daily timeframe. Having a great favor that the stock might be bullish expecting a staggering returns of minimum 25% TGT. IMPORTANT BREAKOUT LEVELS ARE ALWAYS RESPECTED!
NOTE for learners: Place the breakout levels as per the chart shared and track it yourself to get amazed!!
#No complicated chart patterns
#No big big indicators
#No Excel sheet or number magics
TRADE IDEA: WAIT FOR THE STOCK TO BREAKOUT IN WEEKLY TIMEFRAME ABOVE THIS LEVEL.
Checkout an amazing breakout happened in the stock in Weekly timeframe.
Breakouts happening in longer timeframe is way more powerful than the breakouts seen in Daily timeframe. You can blindly invest once the weekly candle closes above the breakout line and stay invested forever. Also these stocks breakouts are lifelong predictions, it means technically these breakouts happen giving more returns in the longer runs. Hence, even when the scrip makes a loss of 10% / 20% / 30% / 50%, the stock will regain and turn around. Once they again enter the same breakout level, they will flyyyyyyyyyyyy like a ROCKET if held in the portfolio in the longer run.
Time makes money, GREEDY & EGO will not make money.
Also, magically these breakouts tend to prove that the companies turn around and fundamentally becoming strong. Also the magic happens when more diversification is done in various sectors under various scripts with equal money invested in each N500 scripts.
The real deal is when to purchase and where to purchase the stock. That is where Breakout study comes into play.
Check this stock which has made an all time low and high chances that it makes a "V" shaped recovery.
> Taking support at last years support or breakout level
> High chances that it reverses from this point.
> Volume dried up badly in last few months / days.
> Very high suspicion based analysis and not based on chart patterns / candle patterns deeply.
> VALUABLE STOCK AVAILABLE AT A DISCOUNTED PRICE
> OPPURTUNITY TO ACCUMULATE ADEQUATE QUANTITY
> MARKET AFTER A CORRECTION / PANIC FALL TO MAKE GOOD INVESTMENT
DISCLAIMER : This is just for educational purpose. This type of analysis is equivalent to catching a falling knife. If you are a warrior, you throw all the knives back else you will be sorrow if it hits SL. Make sure to do your analysis well. This type of analysis only suits high risks investor and whose is willing to throw all the knives above irrespective of any sectoral rotation. BE VERY CAUTIOUS AS IT IS EXTREME BOTTOM FISHING.
HOWEVER, THIS IS HOW MULTIBAGGERS ARE CAUGHT !
STOCK IS AT RIGHT PE / RIGHT EVALUATION / MORE ROAD TO GROW / CORRECTED IV / EXCELLENT BOOKS / USING MARKET CRASH AS AN OPPURTUNITY / EPS AT SKY.
LET'S PUMP IN SOME MONEY AND REVOLUTIONIZE THE NATION'S ECONOMY!
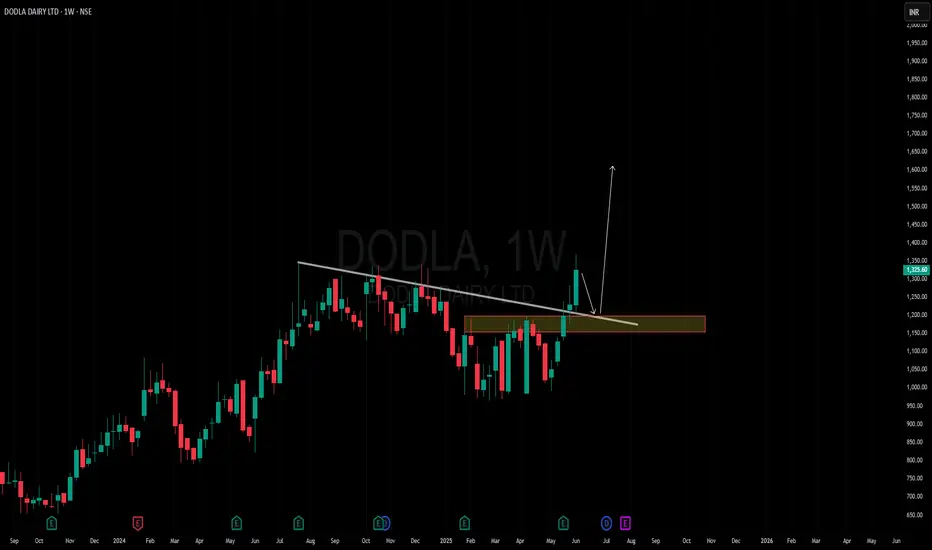
Amazing breakout on WEEKLY Timeframe - DODLACheckout an amazing breakout happened in the stock in Weekly timeframe, macroscopically seen in Daily timeframe. Having a great favor that the stock might be bullish expecting a staggering returns of minimum 25% TGT. IMPORTANT BREAKOUT LEVELS ARE ALWAYS RESPECTED!
NOTE for learners: Place the breakout levels as per the chart shared and track it yourself to get amazed!!
#No complicated chart patterns
#No big big indicators
#No Excel sheet or number magics
TRADE IDEA: WAIT FOR THE STOCK TO BREAKOUT IN WEEKLY TIMEFRAME ABOVE THIS LEVEL.
Checkout an amazing breakout happened in the stock in Weekly timeframe.
Breakouts happening in longer timeframe is way more powerful than the breakouts seen in Daily timeframe. You can blindly invest once the weekly candle closes above the breakout line and stay invested forever. Also these stocks breakouts are lifelong predictions, it means technically these breakouts happen giving more returns in the longer runs. Hence, even when the scrip makes a loss of 10% / 20% / 30% / 50%, the stock will regain and turn around. Once they again enter the same breakout level, they will flyyyyyyyyyyyy like a ROCKET if held in the portfolio in the longer run.
Time makes money, GREEDY & EGO will not make money.
Also, magically these breakouts tend to prove that the companies turn around and fundamentally becoming strong. Also the magic happens when more diversification is done in various sectors under various scripts with equal money invested in each N500 scripts.
The real deal is when to purchase and where to purchase the stock. That is where Breakout study comes into play.
Check this stock which has made an all time low and high chances that it makes a "V" shaped recovery.
> Taking support at last years support or breakout level
> High chances that it reverses from this point.
> Volume dried up badly in last few months / days.
> Very high suspicion based analysis and not based on chart patterns / candle patterns deeply.
> VALUABLE STOCK AVAILABLE AT A DISCOUNTED PRICE
> OPPURTUNITY TO ACCUMULATE ADEQUATE QUANTITY
> MARKET AFTER A CORRECTION / PANIC FALL TO MAKE GOOD INVESTMENT
DISCLAIMER : This is just for educational purpose. This type of analysis is equivalent to catching a falling knife. If you are a warrior, you throw all the knives back else you will be sorrow if it hits SL. Make sure to do your analysis well. This type of analysis only suits high risks investor and whose is willing to throw all the knives above irrespective of any sectoral rotation. BE VERY CAUTIOUS AS IT IS EXTREME BOTTOM FISHING.
HOWEVER, THIS IS HOW MULTIBAGGERS ARE CAUGHT !
STOCK IS AT RIGHT PE / RIGHT EVALUATION / MORE ROAD TO GROW / CORRECTED IV / EXCELLENT BOOKS / USING MARKET CRASH AS AN OPPURTUNITY / EPS AT SKY.
LET'S PUMP IN SOME MONEY AND REVOLUTIONIZE THE NATION'S ECONOMY!
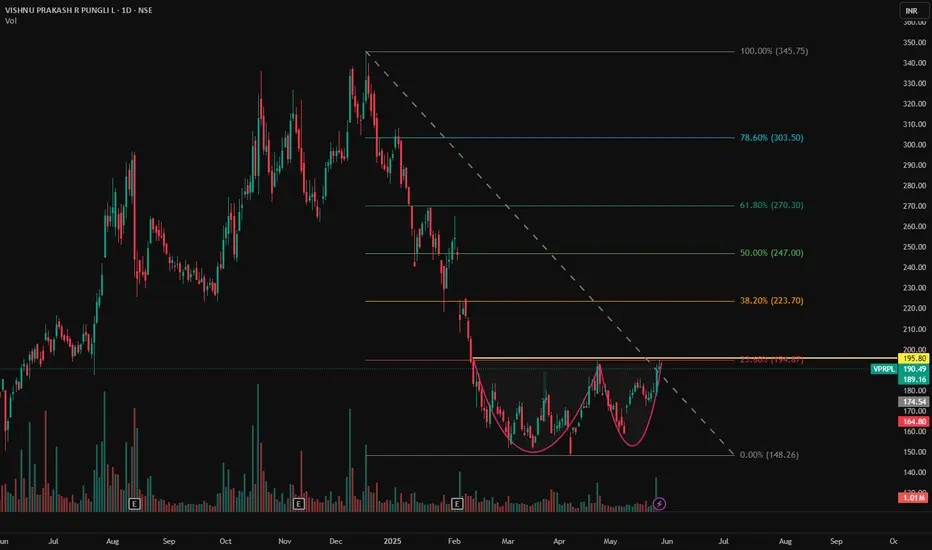
VPRPL - NSE | Daily Timeframe📊 VISHNU PRAKASH R PUNGLIA LTD (VPRPL) – NSE | Daily Timeframe
📅 Date: May 29, 2025
📈 CMP: ₹190.49 (−0.41%)
📌 Ticker: NSE:VPRPL
🧠 Technical Overview
✅ Cup & Handle Pattern in Formation 🍵
Price action is carving out a clean Cup & Handle base near the ₹195.80 resistance zone. A breakout above this neckline could ignite a fresh upside rally. The symmetry, volume spike, and recent bullish structure are all supporting potential continuation.
🧪 Volume Analysis
Noticeable volume increase as the price nears breakout zone, indicating accumulation and rising interest.
📍 Key Levels to Watch
🟡 Breakout Resistance:
₹195.80 (horizontal neckline)
🟢 Support Zone:
₹174.50 (base support of the cup)
₹165 (lower handle risk zone)
🎯 Potential Targets (Post Breakout):
₹220
₹240
₹265 (pattern-measured target zone)
💡 Trade Plan
Entry (on breakout): ₹196+ (with strong volume confirmation)
Stop Loss: Below ₹174
Target Range: ₹220–₹265
Risk-Reward: ~1:2.5+
⚠️ Disclaimer
This chart analysis is for educational purposes only. Always DYOR (Do Your Own Research) and consult a financial advisor before making investment decisions.
INDIAN TELEPHONE INDUSTRIED LTD - NSE | Daily Chart📊 INDIAN TELEPHONE INDUSTRIES LTD (ITI) – NSE | Daily Chart
📅 Date: May 28, 2025
📈 Current Price: ₹309.25 (+9.99%)
📌 Ticker: NSE:ITI
🧠 Technical Analysis Overview
✅ Cup & Handle Breakout 🍵📈
Price action has formed a classic Cup & Handle pattern — a bullish continuation setup indicating a potential uptrend continuation. The breakout is confirmed with a strong bullish candle and significant volume surge today.
✅ Volume Confirmation 📊
Today’s breakout above the ₹288 resistance comes with massive volume (~11.6M), validating strong buyer interest and momentum behind the move.
📍 Key Price Levels
📌 Breakout Level:
✅ ₹288.05 (Previous resistance flipped into support)
📌 Immediate Resistance / Targets
🎯 ₹340 – ₹360 (Short-term target based on pattern projection)
🎯 ₹400+ (Medium-term upside potential if momentum sustains)
📌 Support
🟨 ₹288 (Breakout retest zone)
🟥 ₹270 (Handle support)
📈 Trade Idea
Breakout Entry: ₹290–₹305
Retest Entry: Near ₹288 (if price revisits)
Stop Loss: Below ₹270
Target 1: ₹340
Target 2: ₹360
Target 3: ₹400
⚠️ Disclaimer
This chart analysis is for educational and informational purposes only. Not financial advice. Always do your own research before investing.

Vascon Engineers – Weekly CT BreakoutA clean Weekly CT breakout supported by strong volume (19M+), signaling strength. Key levels and structure:
🔍 Technical Breakdown:
📏 CT Line (White): Clean breakout from weekly closing-based counter-trendline
🕵️ Hidden Line (Dotted White): Secondary hidden resistance cleared
🟧 ₹45.49 Zone: Major gap-up area on DTF – key retracement demand zone
🔵 200 DEMA (Blue Line): Historical resistance now flipped – strength confirmed
🟥 Supply Zone (₹78–₹83): Overhead resistance – long-term target zone
📈 Volume: 🔥 Spiked to 19M+ – highest since Jan ‘24 – confirms breakout strength

Emcure Pharma CMP at 1045 After an admissible correction stock started moving upside, if the observed wave wroked well we may see an upside for 1247 with wave 3 and correction will be over .
I am bullish on it .

Muthoot Microfin LTD – Major Breakout in Play!🟦 Blue Line: 200 DEMA
Still overhead, but the recent price action indicates a potential shift in trend. Price reclaiming above this zone will be another bullish confirmation.
📌 Breakout Highlights:
Counter Trendline Breakout: Price shattered the CT-based trendline with high volume.
W-Bottom Formation: A textbook double bottom structure is visible with neckline breakout.
Green Path: Illustrates the bullish trajectory already played out post breakout.
Red Zone: Key resistance turned support — now a potential demand zone on retest.
Yellow Path: A healthy retest scenario could play out, offering better R:R entries. A pullback to the neckline before continuation would be ideal.
🔔 Keep it on your radar — structure, volume, and trend all align for a bullish bias.

Amazing breakout on WEEKLY Timeframe - CAMLINFINECheckout an amazing breakout happened in the stock in Weekly timeframe, macroscopically seen in Daily timeframe. Having a great favor that the stock might be bullish expecting a staggering returns of minimum 25% TGT. IMPORTANT BREAKOUT LEVELS ARE ALWAYS RESPECTED!
NOTE for learners: Place the breakout levels as per the chart shared and track it yourself to get amazed!!
#No complicated chart patterns
#No big big indicators
#No Excel sheet or number magics
TRADE IDEA: WAIT FOR THE STOCK TO BREAKOUT IN WEEKLY TIMEFRAME ABOVE THIS LEVEL.
Checkout an amazing breakout happened in the stock in Weekly timeframe.
Breakouts happening in longer timeframe is way more powerful than the breakouts seen in Daily timeframe. You can blindly invest once the weekly candle closes above the breakout line and stay invested forever. Also these stocks breakouts are lifelong predictions, it means technically these breakouts happen giving more returns in the longer runs. Hence, even when the scrip makes a loss of 10% / 20% / 30% / 50%, the stock will regain and turn around. Once they again enter the same breakout level, they will flyyyyyyyyyyyy like a ROCKET if held in the portfolio in the longer run.
Time makes money, GREEDY & EGO will not make money.
Also, magically these breakouts tend to prove that the companies turn around and fundamentally becoming strong. Also the magic happens when more diversification is done in various sectors under various scripts with equal money invested in each N500 scripts.
The real deal is when to purchase and where to purchase the stock. That is where Breakout study comes into play.
LET'S PUMP IN SOME MONEY AND REVOLUTIONIZE THE NATION'S ECONOMY!

Bank India | Head & Shoulder Breakout | Swing TradeBank India | Head & Shoulder Breakout | Swing Trade
The provided information is for educational purposes only, not trading advice. There's a risk of being completely wrong.
I am not Sebi registered analyst. My studies are for educational purpose only.
Happy Trading!!
Bigfoot Academy
Disclaimer and Risk Warning.
The analysis and discussion provided on in.tradingview.com is intended for educational purposes only and should not be relied upon for trading decisions. Bigfoot Academy is not an investment adviser and the information provided here should not be taken as professional investment advice. We are not responsible for you profit or losses that you may incur. So Please Consult your financial advisor before trading or investing.

Stock Analysis: #LLOYDSENTHello, Traders! 👋
Let’s dive into #LLOYDSENT, a stock I personally hold and continue to monitor closely. Here’s what I see:
📈 Technical Overview:
🔹 The stock is trading near key levels that I’ve marked on the chart.
💡 Current Position:
As a holder, my view might be biased, but I believe these levels could define the stock’s next major move. Watching closely for confirmation before making any adjustments.
⚠️ Disclaimer:
🔹 I am not a SEBI-registered advisor.
🔹 This analysis reflects my personal views and is not a recommendation to buy or sell.
🔹 Shared for learning purposes only—please do your own research or consult a professional.
Let me know if you’re tracking #LLOYDSENT or have thoughts on its movement! 🚀
#TradingView #StockAnalysis #LLOYDSENT #KeyLevels

Praj Industries big breakout expected triangle pattern.More upside expected after the breakout from this triangle Pattern and range consolidation.
Easy and great fundamentals.

BALKRISIND - Breakout in Falling WedgeView : Bullish
Entry Zone- 2860- 2800 (Trend line breakout)
Exit Zone - Based on Trader mindset. Exit 1 - 2935
Exit 2- 3050
Exit 3 - 3300
Stoploss : Close below 2750
Timeframe: Daily
Notes: Trednline break out the Falling wedge pattern. Price consolidates since May 2024.

HPLHPL is on resistance nr 615. If it sustains above 615 then it may start new run from here. Market participation also increased in recent session. Keep on radar above 615

IndusTower monthly Chart analysisIndus tower trading at the buying/retest area of the previous breakout zone. Good upside potential with positive business growth can be seen in the fundamental data of the stock.
Do your own analysis before creating any position in this.

Swing Last in 2015 this stock given breakout but at retest level it failed and came down to 335
Then tried multiple times to give breakout at the same level of from where it falled in 2015
But this time in 2024 this green BO candel closed above the resistance line and while retesting it sustained it support line from where it falled in 2015.
When reversal came it closed above its resistance line in Day Tf also in week Tf also
BULLISH

20% upside possible in TATA Group (FMCG) Stock in short termHello i hope you all will be doing good in your life and your trading as well, today i have brought a stock which is belongs from TATA Group and stock in from FMCG sector. Stock is forming narrow Contractions which comes in volume contraction Pattern. Soon stock can give breakout of the zones which i have marked above in chart. Stock is good to go as positionally for short term to medium term. I will explain about this VCP method in next paragraph.
The Volatility Contraction Pattern (VCP) is a technical chart pattern used in stock trading to help identify potential buying opportunities and market breakouts. It's based on the idea that a period of low volatility is likely to follow a prolonged consolidation phase.
What it is?
A chart pattern that indicates a stock is preparing for a breakout.
How it works?
A price consolidation phase, where the price moves within a narrow range, followed by a breakout or breakdown.
Characteristics?
A series of smaller contractions, each tighter than the last, ideally with 2-4 contractions.
How it's created?
A supply and demand characteristic, created by institutions accumulating within a base.
How it's used?
To identify potential entry points for trades.
Note:- I have taken help of Google to explain about this pattern.
Tata Consumer Products Ltd. is one of the leading companies of the Tata Group, with presence in the food and beverages business in India and internationally. It is the second largest tea company globally and has significant market presence and leadership in many markets. In addition to South Asia (mainly India), it has presence in various other geographies including Canada, UK, North America, Australia, Europe, Middle East and Africa.
Market Cap
₹ 1,20,297 Cr.
Current Price
₹ 1,216
High / Low
₹ 1,254 / 844
Stock P/E
90.6
Book Value
₹ 162
Dividend Yield
0.64 %
ROCE
10.6 %
ROE
8.32 %
Face Value
₹ 1.00
Industry PE
30.1
Debt
₹ 3,477 Cr.
EPS
₹ 11.5
Promoter holding
33.8 %
Intrinsic Value
₹ 188
Pledged percentage
0.00 %
EVEBITDA
46.1
Change in Prom Hold
0.29 %
Profit Var 5Yrs
27.0 %
Sales growth 5Years
16.0 %
Return over 5years
34.4 %
Debt to equity
0.22
Net profit
₹ 1,167 Cr.
ROE 5Yr
6.83 %
Profit growth
15.9 %
Earnings yield
1.81 %
PEG Ratio
3.36
Disclaimer:- Please always do your own analysis or consult with your financial advisor before taking any kind of trades.
Dear traders, If you like my work then do not forget to hit like and follow me, and guy's let me know what do you think about this idea in comment box, i would be love to reply all of you guy's.
Thankyou.
