APOLLOHOSP – Ranging Channel Breakout Case Study (Educational)________________________________________
📊 APOLLOHOSP – Technical & Fundamental Educational Snapshot
Ticker: NSE: APOLLOHOSP | Sector: 🏥 Hospitals & Healthcare Services
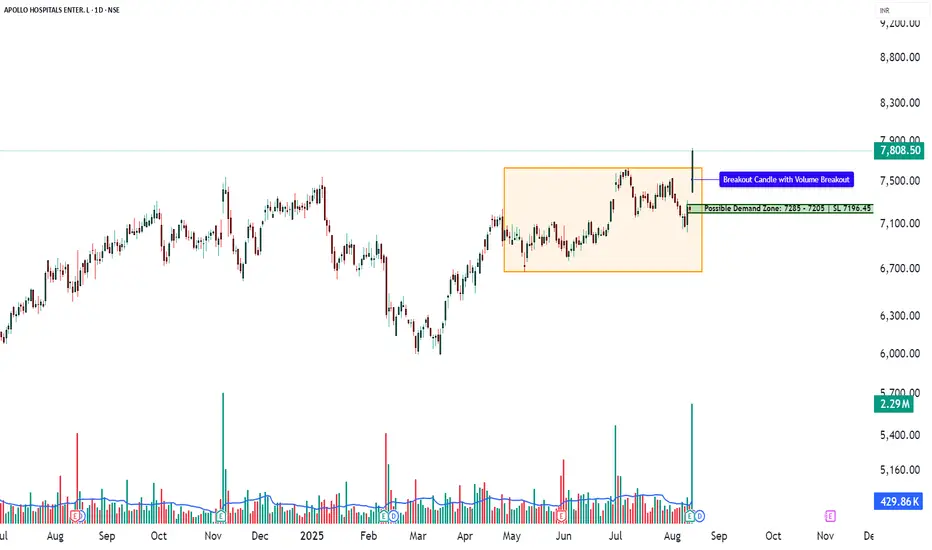
CMP: ₹7,808.50 ▲ (as of 13 Aug 2025)
Rating: ⭐⭐⭐⭐☆ (Moderately Bullish Setup – Educational Purposes Only)
Pattern Observed: 📈 Ranging Channel Breakout
________________________________________
“Apollo Hospitals is on fire! After reporting a stunning 42% rise in Q1 net profit, the stock zoomed nearly 8%, now hovering near its 52-week high. Technical charts are flashing a powerful ‘Strong Buy’ signal across multiple indicators—momentum is undeniable. With balanced options interest and analyst targets pegged around ₹8,100, the stock may still have room to run. A breakout past ₹7,800 could set the stage for the next leg higher!”
________________________________________
Chart Pattern & Technical Analysis:
Close: ₹7,808.5 — strong bullish momentum after Ranging Channel breakout.
Candle: Big bullish bar with multiple confirmations — 52-week breakout, RSI breakout, MACD crossover, Bollinger Band breakout, bullish SuperTrend.
Momentum: WVAP bullish; RSI 68, MACD Buy, CCI 235, Stochastic 96.
________________________________________
Volume Analysis:
Volume: 2.29M shares traded — 5× the 20-day average (429.86K).
Signal: Exceptional participation confirming a decisive 20-day volume breakout.
________________________________________
Support & Resistance:
Resistance: ₹7,969, ₹8,130, ₹8,420.
Support: ₹7,518, ₹7,228, ₹7,060.7.
Outlook: Possible breakout opportunity with swing trade potential.
________________________________________
Learnings:
Q1 FY26 Results: PAT ↑ ~42% YoY to ₹433 cr; revenue ↑ ~15% YoY to ₹5,842 cr; stock rallied 5–6% post-results.
AI Focus: Plans to double AI investments in 2–3 years to boost efficiency & patient outcomes.
Value Unlocking: Spin-off & listing of digital health & pharmacy unit in 18–21 months.
Share Swap: 195.2 shares in new entity for every 100 Apollo shares; Apollo to retain ~15% stake.
________________________________________
Investment Outlook & Conclusion:
📈 Bullish Case:
5th straight quarter of profit growth; Q1 beat estimates.
Expanding margins via premium care, diagnostics, and digital.
Demerger of digital health & pharmacy arm could unlock value.
AI investments to enhance efficiency & returns.
Rising insurance penetration & healthcare spending favor leaders.
________________________________________
📉 Bearish Case:
Premium valuation risks de-rating if growth slows.
Demerger success hinges on smooth execution.
Regulatory changes could impact margins.
Heavy capex & competition may delay returns.
________________________________________
📅 Short vs Long Term:
Short-term (1–3M): Possible follow-through gains from Q1 beat; track Q2 updates & demerger progress.
Long-term (12–24M): Growth from core hospitals + value creation via digital arm listing & AI-driven efficiency.
________________________________________
📊 STWP Trade Analysis:
Trend: Bullish continuation — price broke key range and sustained momentum.
Sample Trade Setup:
Entry: ₹7,840 | Stop: ₹7,011.95
Reference Levels: ₹8,668 (~1:1 RR), ₹9,496 (~1:2 RR)
💡 These prices are only for demonstrating risk–reward calculations and position planning — not for live execution.
________________________________________
Conservative Setup:
Entry Zone: ₹7,808.50–₹7,840 | Stop: ₹7,723.24
Reference Levels: ₹8,064, ₹8,235
(For learning position sizing and risk control)
________________________________________
Pullback Watch:
Zone: ₹7,717.56 | Stop: ₹7,594 | Potential retest area
Potential Use: Studying pullback retests in breakout structures.
________________________________________
Possible Demand Zone(on Daily Time Frame): 7285 - 7205 | SL 7196.45
This is for observing historical demand behaviour — not a call to buy.
________________________________________
Market View (Based on Current Data):
Overall Bias: Bullish positioning.
Trend: Uptrend likely if ₹7,800–₹7,850 holds as support.
Volatility: Moderate (IV ~22–26).
OI Insight: Strong call writing above spot & put writing below — bullish stance with support defense.
________________________________________
🔍 Option Structures – For Learning Purpose
(Prices, Greeks & OI data are from market snapshot on 13 Aug 2025)
________________________________________
7800 CE – LTP ₹155.60
📊 Delta: 0.54 | Theta: -6.27 | IV: 22.39%
💡 Breakeven: ₹7,955.60
Why it’s worth studying:
ATM strike with quick reaction to spot moves (Delta ~0.50)
Strong OI build-up (+1.52L) & high liquidity (37k contracts)
Positioned just above spot; could capture momentum on a 7,850+ breakout
________________________________________
7600 PE – LTP ₹66.60 | Contra View
📊 Delta: -0.27 | Theta: -4.19 | IV: 25.18%
💡 Breakeven: ₹7,533.40
Why study it:
Strong short build-up in Puts (+3.32L OI) shows confidence price stays above this level
~200 pts below spot, acting as a buffer support zone
Higher IV means time decay favours sellers if support holds
________________________________________
Bull Call Spread
🟢 Buy: 7800 CE @ ₹155.60
🔴 Sell: 8000 CE @ ₹72.20
💰 Net Debit: ₹83.40 | Breakeven: ₹7,883.40
Why study it:
Lowers cost vs. naked CE buy by pairing ATM buy with OTM sell
Positive delta for upside, with loss capped to net debit
8000 strike OI acts as a profit cap zone, helping define risk-reward
Reduces theta decay compared to a single long option
________________________________________
📘 My Trading Setup Rules
Avoid Gap Plays
→ Check pre-open price action to avoid trades influenced by gap-ups/gap-downs.
Breakout Entry Only
→ Enter trades only if price breaks previous day’s High (for bullish trades) or Low (for bearish trades).
Watch Volume for Confirmation
→ Monitor volume closely. No volume = No trade.
Enter on Strong Candle + Volume
→ Execute the trade only if a strong candle appears with increasing volume in the direction of the trade.
Defined Risk:Reward Only
→ Take trades only if R:R is favorable (ideally ≥ 1:2).
Premium Disclaimer
→ Option premiums shown are based on EOD prices — real-time premiums may vary during execution.
Time Frame Preference
→ Trade with your preferred time frame — this strategy works across intraday or positional setups.
________________________________________
⚠️ Disclaimer – Please Read Carefully
The information shared here is meant purely for learning and awareness. It is not a buy or sell recommendation and should not be taken as investment advice. I am not a SEBI-registered investment advisor, and all views expressed are based on personal study, chart patterns, and publicly available market data.
Trading — whether in stocks or options — carries risk. Markets can move unexpectedly, and losses can sometimes be larger than the money you have invested. Past performance or past setups do not guarantee future results.
If you are a beginner, treat this as a guide to understand how the market works — practice on paper trades before risking real money. If you are an experienced trader, remember to assess your own risk, position sizing, and strategy suitability before entering any trade.
Data, prices, and analysis are based on information available as of 12 August 2025, and market conditions can change at any time. Always verify with reliable sources and consult a SEBI-registered financial advisor before making any real trading decision.
By reading, watching, or engaging with this content, you acknowledge that you take full responsibility for your own trades and investments.
________________________________________
💬 Found this useful?
Drop your thoughts, questions, or setups in the comments — let’s grow together!
🔁 Share this post with fellow traders and beginners to spread clean, structure-based learning.
✅ Follow simpletradewithpatience for beginner-friendly setups, price action insights, and disciplined trading content.
🚀 Stay Calm. Stay Clean. Trade With Patience.
Trade Smart | Learn Zones | Be Self-Reliant 📊
________________________________________
Breakouttrading
BUY TODAY SELL TOMORROW for 5%DON’T HAVE TIME TO MANAGE YOUR TRADES?
- Take BTST trades at 3:25 pm every day
- Try to exit by taking 4-7% profit of each trade
- SL can also be maintained as closing below the low of the breakout candle
Now, why do I prefer BTST over swing trades? The primary reason is that I have observed that 90% of the stocks give most of the movement in just 1-2 days and the rest of the time they either consolidate or fall
Trendline Breakout in CUPID
BUY TODAY SELL TOMORROW for 5%

BUY TODAY SELL TOMORROW for 5%DON’T HAVE TIME TO MANAGE YOUR TRADES?
- Take BTST trades at 3:25 pm every day
- Try to exit by taking 4-7% profit of each trade
- SL can also be maintained as closing below the low of the breakout candle
Now, why do I prefer BTST over swing trades? The primary reason is that I have observed that 90% of the stocks give most of the movement in just 1-2 days and the rest of the time they either consolidate or fall
Trendline Breakout in STARCEMENT
BUY TODAY SELL TOMORROW for 5%

POLICYBZR – Technical & Fundamental Analysis | Channel Breakout📊 POLICYBZR – Technical & Fundamental Educational Snapshot
Ticker: NSE: POLICYBZR | Sector: Digital Insurance & Fintech
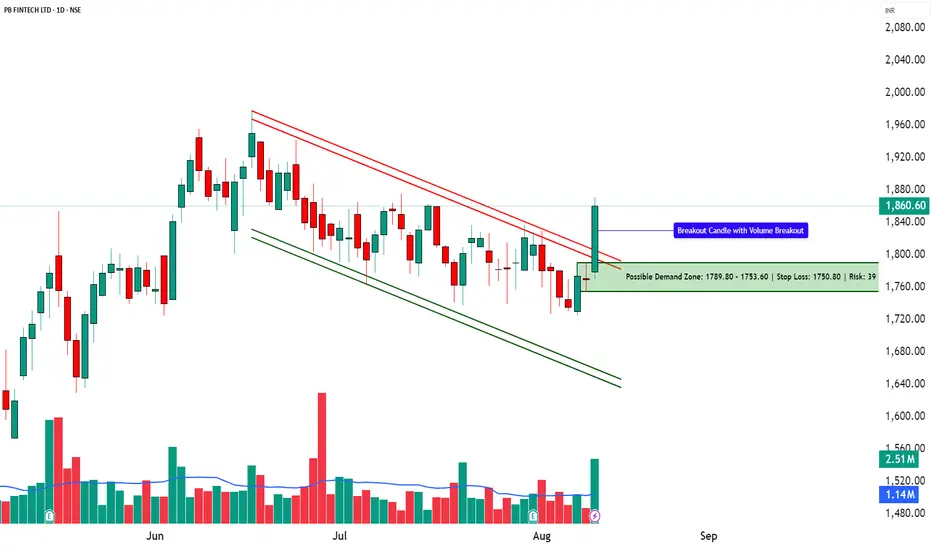
CMP: ₹1,860.60
Rating: ⭐⭐⭐ (Neutral to Moderately Bullish Setup – Educational Purposes Only)
Pattern Observed: 📈 Channel Breakout
________________________________________
POLICYBZR (CMP: ₹1,860.6) is exhibiting a Channel Breakout formation, supported by a strong bullish candle. The stock has moved from a bottom range of ₹1,558.4 towards the top range of ₹1,978, with key resistances placed at ₹1,898, ₹1,935, and ₹1,998, while supports are noted at ₹1,797, ₹1,733, and ₹1,696. Technical indicators show RSI at 59 (breakout zone), a bullish MACD crossover, CCI at 122, and Stochastic at 93, indicating strong upward momentum. The price action has also seen a Bollinger Band breakout and is trading above VWAP, suggesting bullish bias. Volume surged to 2.51M shares, significantly higher than the 20-day average of 1.14M, indicating institutional participation. Based on current momentum, there is a possibility of breakout continuation; however, traders should monitor support levels for any reversal signals.
As of early August 2025, PB Fintech’s insurance platform Policy Bazaar has been penalised ₹5 crore by the insurance regulator for certain regulatory lapses, leading to a short-term decline of around 2–3 percent in its share price. Despite this development, the company reported a 33 percent year-on-year increase in Q1 revenues, with net profit rising by 50 percent, supported by a 35 percent growth in core insurance premium collections to approximately ₹6,616 crore. In addition, its enterprise arm has introduced “ClaimSetu”, an AI-powered claims insights and scoring tool for group health insurance, aimed at streamlining documentation and potentially improving claim processing efficiency by up to 50 percent.
From an investment perspective, the outlook for PB Fintech (Policy Bazaar) remains mixed, with both upside potential and downside risks. On the bullish side, sustained revenue growth, rising profitability, and continued expansion in insurance premium collections reflect strong operational momentum. The introduction of AI-driven claim processing solutions could enhance efficiency and customer experience, potentially boosting market share over time. However, the bearish view factors in recent regulatory penalties, heightened compliance scrutiny, and the possibility of short-term sentiment pressure on the stock price. In the short term, price action may remain volatile as the market digests recent developments and broader market conditions. Over the long term, the company’s growth trajectory will depend on successful regulatory compliance, execution of technology-led initiatives, and maintaining a competitive edge in the digital insurance space.
________________________________________
📊 STWP Trade Analysis – Based on the STWP trade framework, a backtest-style example of a possible breakout setup could involve a long entry near ₹1,870.7 with a protective stop at ₹1,722.2. In similar past setups, price movements have reached zones such as ₹2,019 (approx. 1:1 risk–reward) and ₹2,168 (approx. 1:2 risk–reward).
A more conservative hypothetical example might involve an entry in the ₹1,870.70–₹1,860.60 zone, with a protective stop at ₹1,832.48 and potential upside zones at ₹1,945 and ₹2,001 — risk–reward will vary based on entry.
Additionally, a pullback scenario could be illustrated with a potential entry near ₹1,842.9, protective stop at ₹1,805.6, and upside zones aligned with resistance levels.
Possible Demand Zone (Illustrative): ₹1,789.80 – ₹1,753.60 with Stop Loss: ₹1,750.80
Approximate Risk: ₹39
________________________________________
⚠️ Risk Reminder:
Price volatility may increase due to regulatory factors, market sentiment, or broader index trends. Past chart patterns and backtests do not guarantee future performance.
________________________________________
⚠️ Disclaimer (Read Carefully)
This post is for educational and informational purposes only.
The author is not a SEBI-registered investment advisor. No buy or sell recommendations are being made.
All views are based on chart patterns, publicly available data, and personal learning experience.
Trading involves risk. Losses can exceed your investment. Always consult a SEBI-registered advisor before making financial decisions.
By engaging with this content, you agree to these terms.
________________________________________
💬 Found this useful?
Drop your thoughts, questions, or setups in the comments — let’s grow together!
🔁 Share this post with fellow traders and beginners to spread clean, structure-based learning.
✅ Follow simpletradewithpatience for beginner-friendly setups, price action insights, and disciplined trading content.
🚀 Stay Calm. Stay Clean. Trade With Patience.
Trade Smart | Learn Zones | Be Self-Reliant 📊
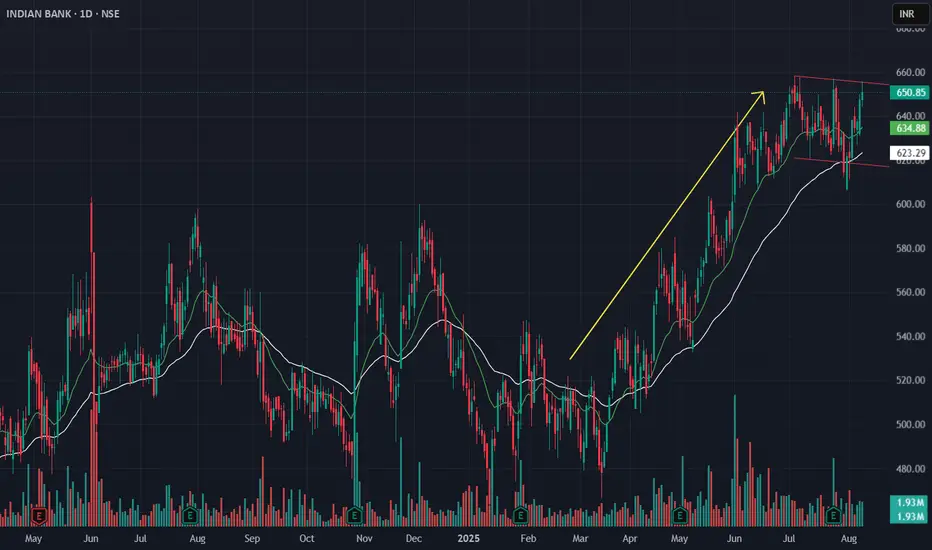
Indian Bank – Flag Breakout Setup from Sector Rotation ScreeningIn the latest sector rotation review, PSU Banks moved into the Improving quadrant, showing early signs of leadership. Within this space, Indian Bank was shortlisted based on:
-- Alignment of 9 EMA & 21 EMA across daily and weekly timeframes
-- MACD trending positively
-- EFI (Elders Force Index) showing accumulation on higher timeframes
Technical Structure:
On the Daily and Weekly charts, Indian Bank is consolidating in a flag pattern after a strong uptrend. The EMAs are acting as dynamic support. On the Hourly chart, a rounding base is forming, indicating early recovery of momentum.
Trade Plan:
-- Breakout Entry: Above ₹656 with strong volume
-- Stop Loss: ₹640 (ATR-based)
-- Targets: ₹695 → ₹716 → ₹746
This setup aligns both with sector momentum and technical structure, offering a favorable risk–reward. Watch for sustained momentum on the breakout day to confirm entry.
BUY TODAY SELL TOMORROW for 5%DON’T HAVE TIME TO MANAGE YOUR TRADES?
- Take BTST trades at 3:25 pm every day
- Try to exit by taking 4-7% profit of each trade
- SL can also be maintained as closing below the low of the breakout candle
Now, why do I prefer BTST over swing trades? The primary reason is that I have observed that 90% of the stocks give most of the movement in just 1-2 days and the rest of the time they either consolidate or fall
Resistance Breakout in LINCOLN
BUY TODAY SELL TOMORROW for 5%

BUY TODAY SELL TOMORROW for 5%DON’T HAVE TIME TO MANAGE YOUR TRADES?
- Take BTST trades at 3:25 pm every day
- Try to exit by taking 4-7% profit of each trade
- SL can also be maintained as closing below the low of the breakout candle
Now, why do I prefer BTST over swing trades? The primary reason is that I have observed that 90% of the stocks give most of the movement in just 1-2 days and the rest of the time they either consolidate or fall
Resistance Breakout in AVALON
BUY TODAY SELL TOMORROW for 5%

BUY TODAY SELL TOMORROW for 5%DON’T HAVE TIME TO MANAGE YOUR TRADES?
- Take BTST trades at 3:25 pm every day
- Try to exit by taking 4-7% profit of each trade
- SL can also be maintained as closing below the low of the breakout candle
Now, why do I prefer BTST over swing trades? The primary reason is that I have observed that 90% of the stocks give most of the movement in just 1-2 days and the rest of the time they either consolidate or fall
Rising Wedge Pattern in OSWALAGRO
BUY TODAY SELL TOMORROW for 5%

Asian Paints | Cup & Handle Breakout Building Momentum
Description:
Asian Paints is forming a classic cup and handle on the daily chart, supported by a rounded bottom structure on the weekly. Price is attempting to breakout above ₹2500, with positive EFI and upward momentum.
📌 Breakout Level: ₹2500
📉 Stoploss: ₹2449 (ATR-based)
🎯 Targets: ₹2749 → ₹2886 → ₹3108 (Fibonacci extension)
🧭 Macro Context:
- Stable inflation and INR
- Improving margin outlook for the sector
- Paint stocks showing strength post consolidation
Strong price-action setup supported by fundamentals and structure.

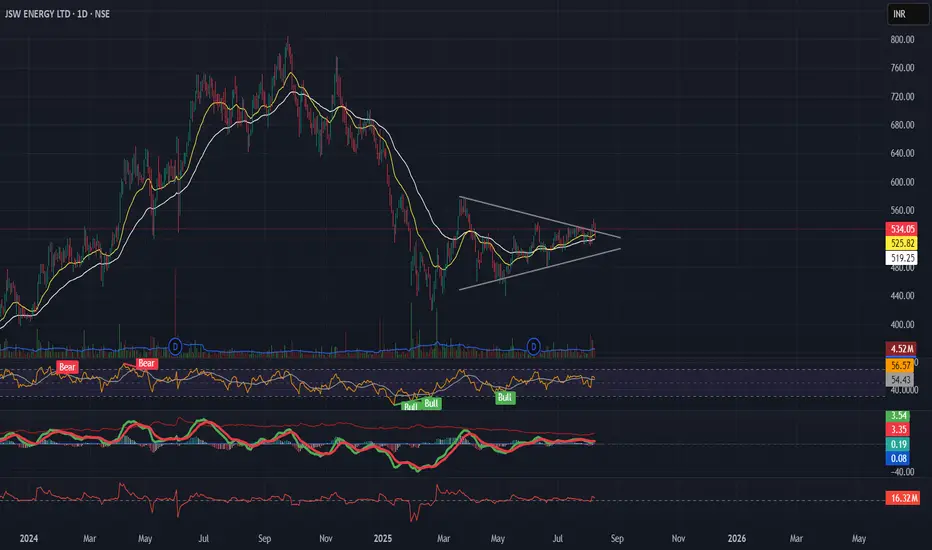
JSWENERGY | Symmetrical Triangle Breakout in Progress?Description:
JSW Energy is forming a symmetrical triangle on the daily chart after a downtrend — resembling a potential bearish pennant, but price structure, sloping EMAs, rising momentum, and positive EFI hint at bullish strength.
📌 Breakout Level: ₹534
📉 Stoploss: ₹519 (ATR-based)
🎯 Targets: ₹563 → ₹597 → ₹694 (as per Fib projections)
🧭 Macro Context:
- Infra & Energy sectors improving
- Govt push for renewables
- Dollar weakening, risk-on tone aiding sentiment
Structure, volume, and macro are aligned — tracking this breakout closely.
BUY TODAY SELL TOMORROW for 5%DON’T HAVE TIME TO MANAGE YOUR TRADES?
- Take BTST trades at 3:25 pm every day
- Try to exit by taking 4-7% profit of each trade
- SL can also be maintained as closing below the low of the breakout candle
Now, why do I prefer BTST over swing trades? The primary reason is that I have observed that 90% of the stocks give most of the movement in just 1-2 days and the rest of the time they either consolidate or fall
RESISTANCE Breakout in PRAKASH
BUY TODAY SELL TOMORROW for 5%

Godfrey Phillips India - Breakout Setup, Move is ON...#GODFRYPHLP trading above Resistance of 6771
Next Resistance is at 9804
Support is at 4339
Here are previous charts:
Chart is self explanatory. Levels of breakout, possible up-moves (where stock may find resistances) and support (close below which, setup will be invalidated) are clearly defined.
Disclaimer: This is for demonstration and educational purpose only. This is not buying or selling recommendations. I am not SEBI registered. Please consult your financial advisor before taking any trade.

How I Identify High‑Probability Setups Using Weekly + Daily TFI daily make educational content videos for Posts for Swing Trading
📌 This post is for educational purposes only and is not financial or investment advice

BUY TODAY SELL TOMORROW for 5%DON’T HAVE TIME TO MANAGE YOUR TRADES?
- Take BTST trades at 3:25 pm every day
- Try to exit by taking 4-7% profit of each trade
- SL can also be maintained as closing below the low of the breakout candle
Now, why do I prefer BTST over swing trades? The primary reason is that I have observed that 90% of the stocks give most of the movement in just 1-2 days and the rest of the time they either consolidate or fall
Trendline Support in SUZLON
BUY TODAY SELL TOMORROW for 5%

Open Interest & Option Chain AnalysisOptions trading has grown rapidly among retail and institutional traders due to its strategic flexibility and leverage. Two of the most critical tools for options traders are Open Interest (OI) and Option Chain Analysis. These tools provide deep insights into market sentiment, potential support and resistance levels, and liquidity zones. This guide will walk you through the concepts of Open Interest, Option Chain interpretation, real-world strategies, and how to apply this knowledge for smarter trading decisions.
🔹 What is Open Interest?
Open Interest refers to the total number of outstanding options contracts (calls or puts) that have not been settled or closed. It reflects how much active participation exists in a particular strike price and expiry.
Key Points:
Increase in OI: Indicates that new positions are being added (either long or short).
Decrease in OI: Means traders are closing out positions.
High OI: Signals strong interest in that strike price – potentially a key level for support or resistance.
Unlike volume (which resets daily), OI is cumulative and updates after the close of each trading day.
Example:
You buy 1 lot of Nifty 17000 CE, and someone sells it to you → OI increases by 1.
You later sell it and the counterparty closes their position too → OI decreases by 1.
🔹 What is an Option Chain?
An Option Chain is a table displaying all available option contracts for a specific stock/index across various strike prices and expiries. It includes data such as:
Strike Call OI Call LTP Put LTP Put OI
17500 1,20,000 ₹75 ₹30 90,000
17600 2,40,000 ₹45 ₹40 2,00,000
Key Elements:
Strike Price: Price at which the option can be exercised.
Calls vs Puts: Calls are on the left; puts on the right (or vice versa).
LTP: Last Traded Price.
OI & Change in OI: Used to spot where the smart money is positioned.
🔹 How to Read Open Interest in the Option Chain
OI provides crucial support and resistance data. Here's how to read it:
1. High Call OI ➝ Resistance
Traders are selling call options at that level, expecting the price won’t rise above it.
2. High Put OI ➝ Support
Traders are selling puts, expecting the price won’t fall below it.
3. Change in OI (Today’s change) ➝ Trend confirmation
Positive change in Call OI + Price Falling → Bearish
Positive change in Put OI + Price Rising → Bullish
🔹 Multi-Strike OI Build-Up
Sometimes, OI builds up in multiple strike prices above/below the spot. This forms resistance/support zones.
Example:
Call OI: 17800 (3L), 17900 (2.7L), 18000 (4.1L)
Strong resistance between 17800–18000
Breakout above 18000 is significant.
🔹 Intraday Option Chain Analysis
For intraday traders, changes in OI on a 5- to 15-minute basis can reveal sharp shifts in sentiment.
Use Change in OI (Live updates).
Look at IV (Implied Volatility): Spikes can indicate event-based risk.
Combine with Volume Profile, VWAP, and Price Action.
Example:
At 11 AM, sudden jump in Put OI at 17700.
Price bouncing from 17720 → Intraday long trade setup.
🔹 Common Mistakes to Avoid
Looking at absolute OI only – Always compare to change in OI.
Ignoring context – Use OI in combination with price, volume, and trend.
Chasing false breakouts – Wait for OI shift confirmation.
Trading illiquid options – Stick to strikes with high volume and OI.
🔹 Tools for Option Chain Analysis
NSE India Website – Free option chain.
Sensibull, Opstra, StockMock – Visual OI charts and PCR.
TradingView OI Indicators – Live OI overlays.
Fyers/Webull/Zerodha – Broker-integrated data.
🔹 Advanced: OI Spreads & Traps
OI data can also reveal where retail traders are trapped:
Call writers trapped when price shoots up → Short covering leads to spikes.
Put writers trapped when price falls → Sudden breakdown.
Watch for spikes in volume + OI unwinding.
🔹 Summary: Step-by-Step Framework
Step Action
1 Identify spot price and trading range.
2 Look for highest Call & Put OI levels.
3 Observe changes in OI throughout the day.
4 Use PCR for overall bias.
5 Confirm with price action before trade.
6 Exit if OI starts shifting against your trade.
🔹 Conclusion
Open Interest and Option Chain Analysis are powerful tools when used correctly. They offer traders a real-time look at market sentiment, help identify key levels, and give clues about institutional activity. However, they should not be used in isolation. Combine them with price action, volume, and technical analysis for the best results.
Whether you're an intraday trader, swing trader, or options strategist, mastering the art of reading the option chain and open interest will give you a strong edge in today's fast-moving markets.
Part4 Institution Trading How Options Work
Example of a Call Option
Suppose a stock is trading at ₹100. You buy a call option with a ₹110 strike price, expiring in 1 month, and pay a ₹5 premium.
If the stock rises to ₹120: Your profit is ₹120 - ₹110 = ₹10. Net gain = ₹10 - ₹5 = ₹5.
If the stock stays at ₹100: The option expires worthless. Your loss = ₹5 (premium).
Example of a Put Option
Suppose the same stock is ₹100, and you buy a put option with a ₹90 strike price for ₹5.
If the stock drops to ₹80: Your profit = ₹90 - ₹80 = ₹10. Net gain = ₹10 - ₹5 = ₹5.
If the stock stays above ₹90: The option expires worthless. Your loss = ₹5.

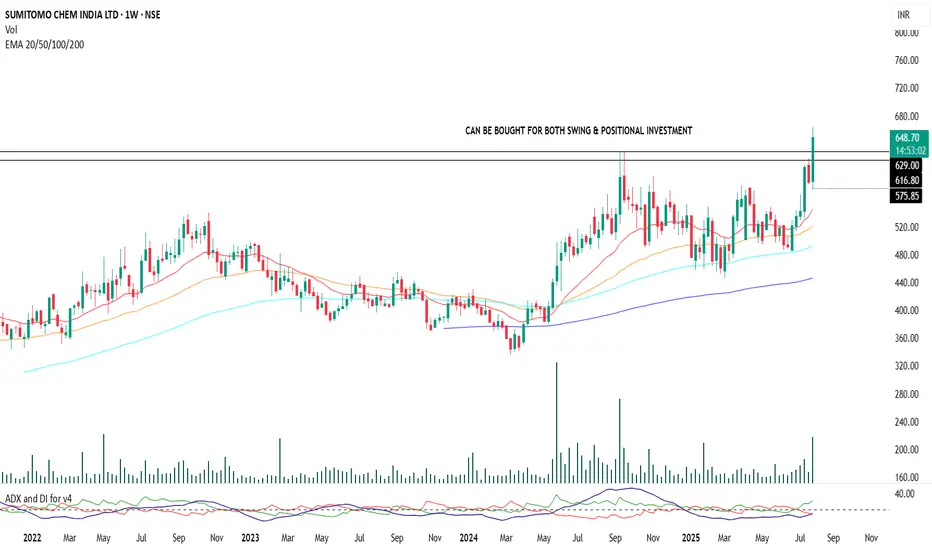
Sumitomo Chemical | Positional Swing Setup with Dynamic SLA strong setup is forming in Sumitomo Chemical with bullish c price action and trend indicators. Entry can be been initiated at current levels with small quantity with a stop-loss placed at ₹570 on a weekly closing basis.
No fixed targets. This is a trailing stop-loss-based position aimed at capturing a sustained trend move.
Add-on Zone: If the price retests the support near the ₹630 level (previous structure/support), more quantity will be added as part of a pyramiding strategy, provided broader market structure remains bullish.
Indicators Used for Trailing SL & Confirmation:
ADX & DI , RSI Levels
Exit Criteria:
Weekly close below ₹570 (hard stop)
Note: This is a disciplined, structure-based swing trade with optional pyramiding. Avoid impulsive exits; trail stop-losses logically based on trend indicators.
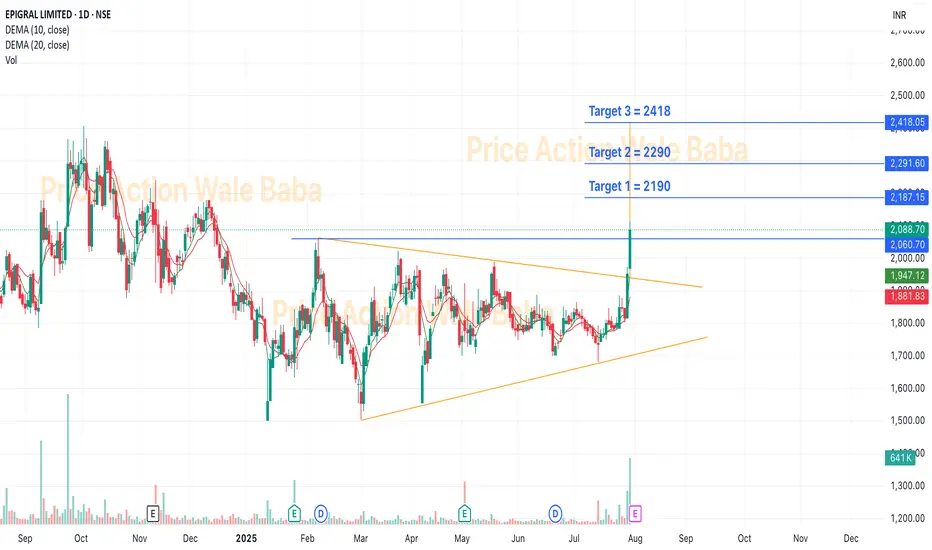
EPIGRAL - BreakoutEpigral Limited, formerly known as Meghmani Finechem Ltd, incorporated in 2007, is a leading integrated manufacturer of chemicals in India. Epigral’s Dahej facility is a backward and forward integrated and automated complex with a well-planned infrastructure.
In India, Epigral is the first to set up an Epichlorohydrin plant and largest capacity plant of CPVC Resin. Epigral is also a leading manufacturer of Caustic Soda, Caustic Potash, Chloromethanes, Hydrogen Peroxide, Chlorine and Hydrogen.
Breakout from the Triangle pattern
Market Cap: ₹ 8,996 Cr.
Promoter holding: 68.8 %
FII holding: 3.06 %
DII holding: 4.78 %
Public holding: 23.3 %
Debt: ₹ 593 Cr.
Debt 3Years back: ₹ 993 Cr.
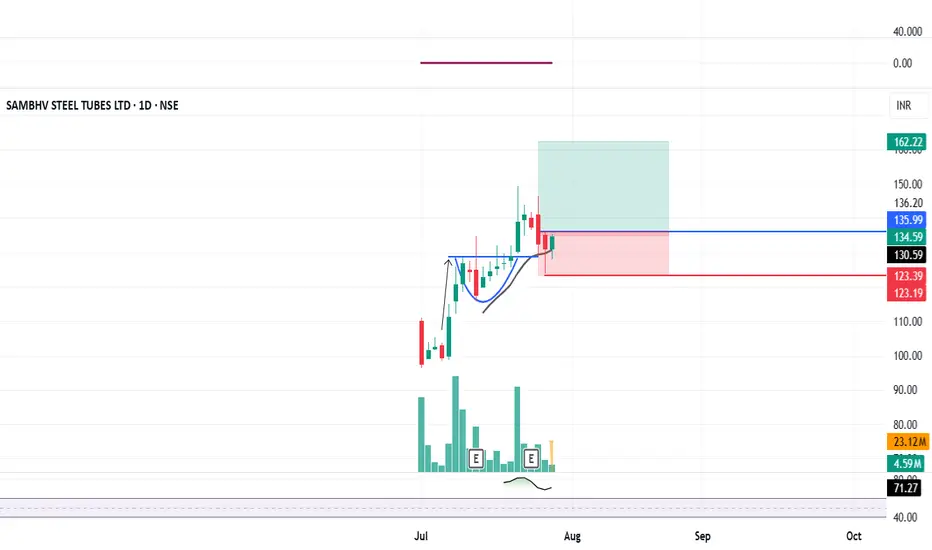
SAMBHV: IPO Base Breakout + Retest done#SAMBHV #ipostock #breakoutstock #trendingstock #swingtrading
SAMBHV : Swing Trading
>> Breakout & Retest done
>> Trending stock
>> Good Strength & Volumes
>> Low Risk High Reward Trade
Swing Traders can lock profits at 10% & Keep Trailing
Pls Comment , Boost and Follow for more such Analysis
Disc : Charts shared are for Learning Purpose and not a Trade recommendation, Consult your Financial advisor or a SEBI Registered Advisor before taking position in it.
Lauruslabs-It can fly towards ATH again!Lauruslabs has given a good breakout of trendline and horizontal resistance with volume.
Stock is looking strong for a reversal and can fly towards ATH if market supports.
Keep in watchlist.

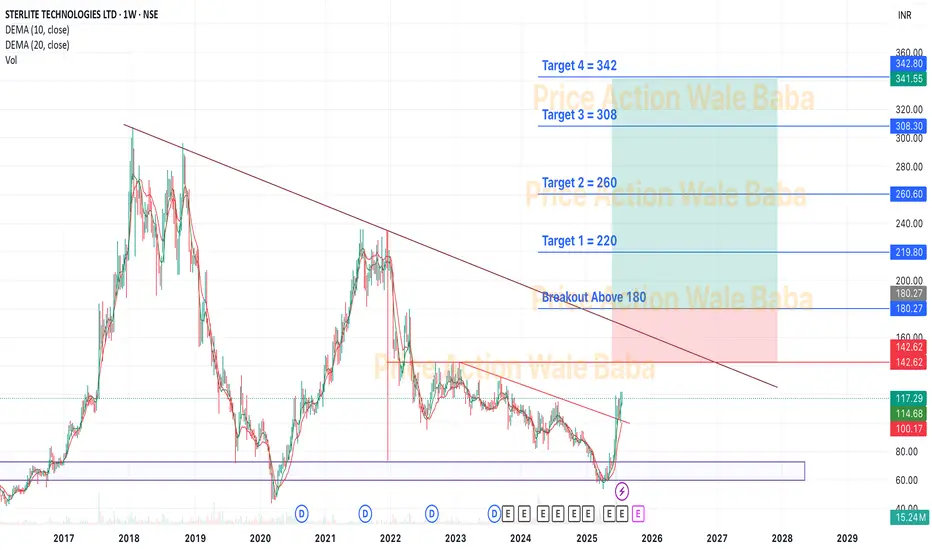
Sterlite Technologies Ltd - Near Breakout.Sterlite Technologies Limited was established in July 2001 after the demerger of the telecom division of Sterlite Industries Ltd (SIL). In July 2006, STL acquired the transmission line business of SIL to foray into the power transmission cables business. STL has grown over the years to become the largest Optical Fiber and Optical Fiber Cables manufacturer in the country. The company also has sizeable presence in the overseas markets with an established presence in the global optical fiber market.
The company’s global ex-China Optical Fiber Cables (OFC) market share was 8% in FY24 vs 12% in FY23. It is among the largest and lowest-cost producers of Optical Fibre and OFC in India because of extensive backward integration.
Order Book
As of Q4 FY24, the company's order book stood at Rs. ~10,200 Cr vs Rs. ~9,800 Cr in Q3 FY24.
Telcos: 59%
Citizen Networks: 22%
Enterprises: 19%.
Optical Connectivity portfolio in US
On 29 July 24, the company announce the expansion of its Optical Networking capability with the addition of its Optical Connectivity portfolio in the US market.
Market Cap: ₹ 5,723 Cr.
Promoter holding: 44.4 %
FII holding: 6.74 %
DII holding: 11.3 %
Public holding: 37.5 %
Debt: ₹ 1,926 Cr.
Debt 3 Years back: ₹ 3,475 Cr.
Note: Debt is decreasing
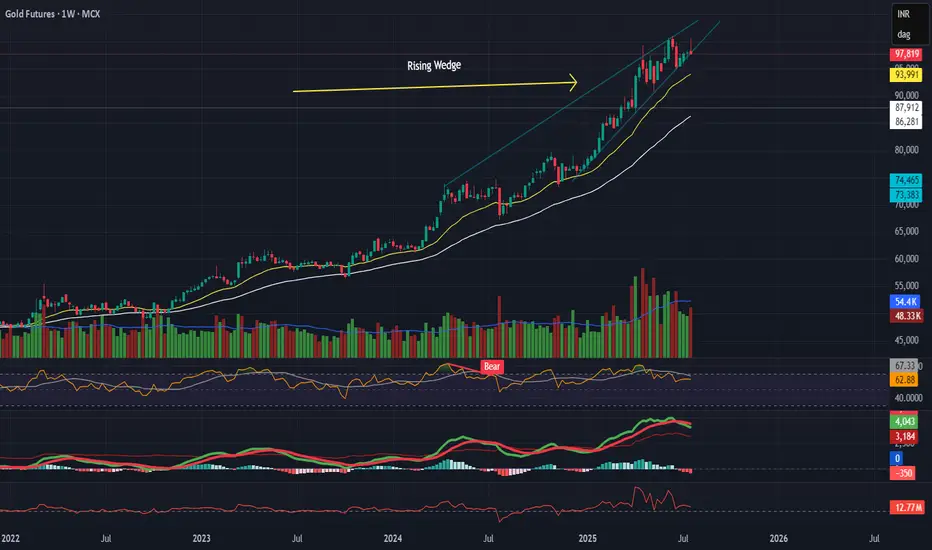
Gold Breaking Down – Rising Channel + Wedge Breakdown
Gold Breaking Down – Rising Channel + Wedge Breakdown
Description:
Gold has broken down from a rising channel on the daily timeframe and a rising wedge on the weekly, signaling a possible intermediate correction.
Key Observations:
- Momentum divergence on RSI, MACD, EFI
- Bearish volume supporting the move
- Price now below 20 EMA, approaching 50 EMA
- Weekly wedge failure after a secondary test of highs
Macro Drivers:
- Lower inflation
- Stable USD
- Dovish Fed stance
- Middle East tension cooled
- Gold appears overpriced on relative terms
Trade Setup:
🔻 Breakdown: ₹97,500
🎯 Targets: ₹92,000 → ₹87,000
🛑 Stoploss: ₹1,00,560 (near ATR and resistance)
🧠 Bearish bias short-term unless macro changes again.
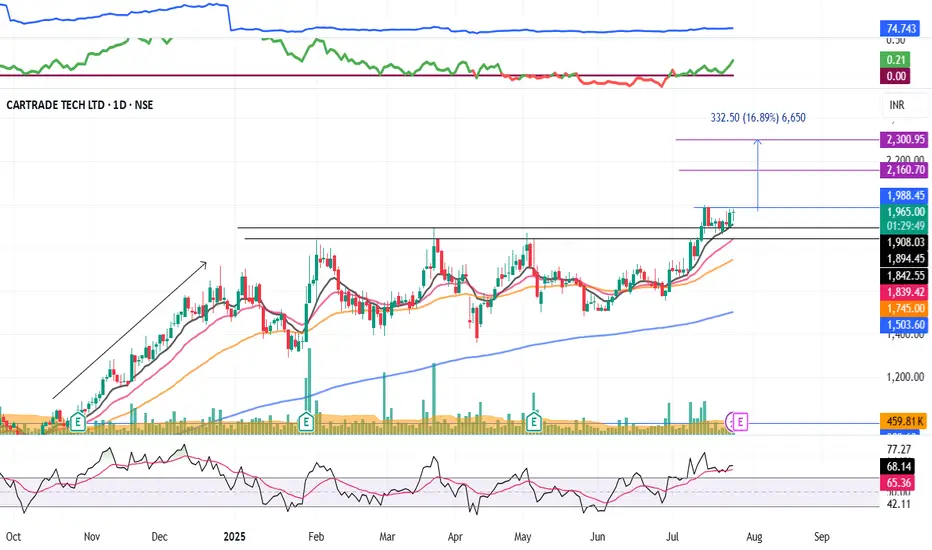
CARTRADE : Momentum pick#CARTRADE #swingtrade #momentumstock #breakoutstock #basingpattern
CARTRADE : Swing Trade
>> Good Base formation
>> Breakout + Retest done
>> Good Strength & Volume dried up
>> Trending setup
Swing Traders can lock profit at 10% and keep trailing
Pls boost, comment and follow us for more such analysis
Disc : Charts shared are for Learning purpose and not a Trade recommendation. consult a SEBI Registered Advisor before taking position in it.