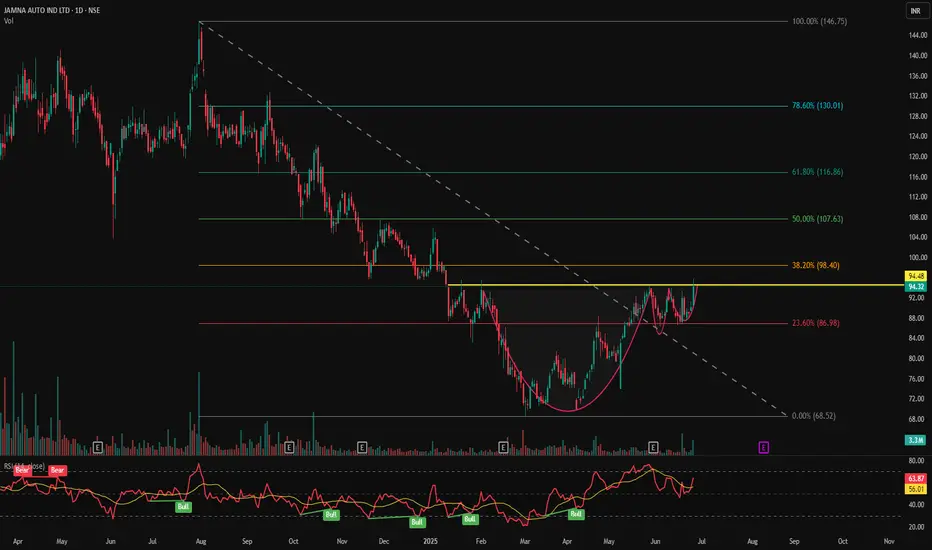
JAMNAAUTO - VCP Pattern Near Breakout📊 JAMNA AUTO (JAMNAAUTO) – VCP Pattern Near Breakout | RSI Momentum | Volume Surge | Daily Chart
📅 Chart Date: June 26, 2025
📈 CMP: ₹94.32 (+4.60%)
📍 Ticker: NSE:JAMNAAUTO
🔍 Technical Analysis Summary
☕ Cup & Handle Formation
The chart shows a well-formed Cup & Handle pattern
Neckline resistance at ₹94.48 – a break above this zone could trigger bullish continuation
Pattern suggests accumulation and breakout setup after prolonged downtrend reversal
📈 Volume
Rising volume on recent candles, supporting strength of potential breakout
Volume above 3.3M confirms strong buying interest
📊 RSI Indicator (14)
RSI currently at 63.87 and rising
Multiple historical RSI Bullish crossovers visible during base and handle formation
RSI > 60 indicates momentum is favoring bulls
📍 Key Price Levels
✅ Breakout Zone (Neckline): ₹94.48
🚀 Upside Targets (Post-breakout estimate):
₹102
₹110
₹120+
🛡️ Support Zones:
₹90 (immediate)
₹85 (handle base)
₹80 (cup base)
📌 Trade Setup Idea
Entry: On breakout above ₹94.50 with volume
SL: Below ₹89
Targets: ₹102 → ₹110 → ₹120+
Risk-Reward: Good, considering rounded base and handle plus RSI confirmation
⚠️ Disclaimer
This chart analysis is for educational purposes only. Always DYOR (Do Your Own Research) and consult a financial advisor before making investment decisions.
Breakouttrading
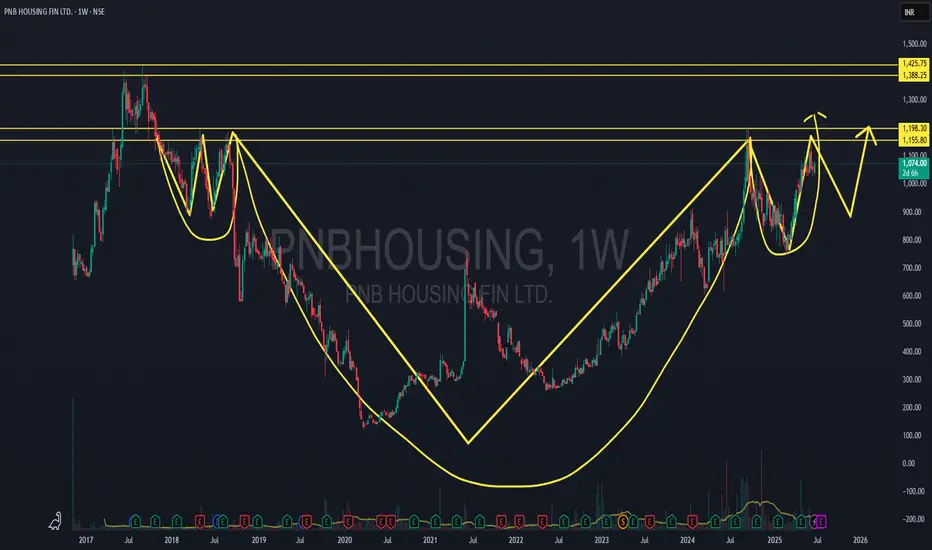
CUP in Making & H&S in PNB HOUSING FinanceGood to go Long as PNB in Making of CUP &
ready for give Breakout of Inverse H&S pattern
Safe Traders Enter after one Pattern Conformation @ 1200 on Daily Closing with Big Bull candle
CUP Pattern Breakout at 1430-1450 Range..
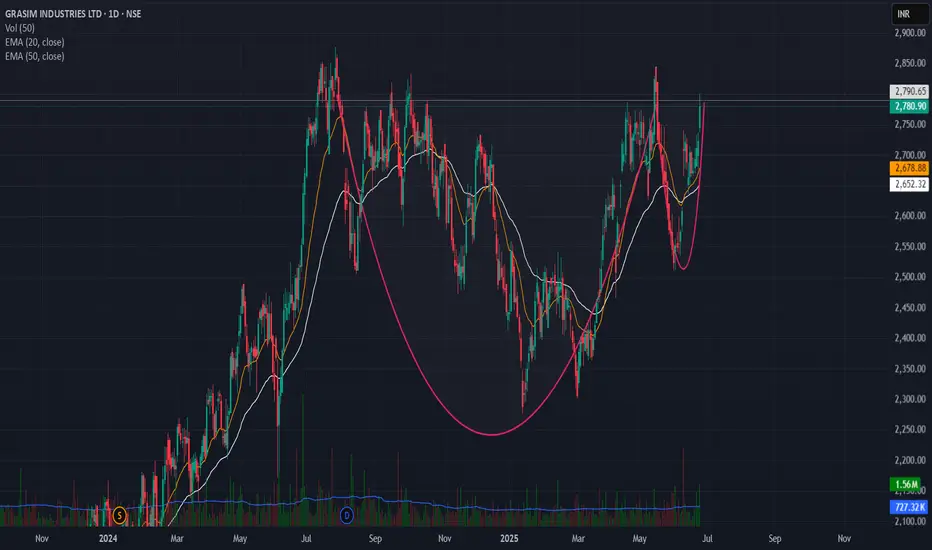
Breakout from cup and handle pattern Grasim Cup and Handle Breakout Setup
Grasim is forming a classic Cup and Handle pattern on the daily chart.
✅ Breakout Level: 2790
🛑 Stoploss: Below 2650 (handle low)
🎯 Target Zone: 3290 (based on depth projection and prior highs)
Pattern Logic:
Rounded cup base indicates accumulation
Handle pullback was shallow with declining volume
Breakout attempt with volume surge
Price above 20 EMA & 50 EMA
RSI > 55 and MACD nearing bullish crossover
Cup & Handle Breakout + Golden Cross Confirms Bullish Megatrend Timeframe: Daily
Ticker: NSE:SIEMENS
🔥 Key Technical Setup:
Cup & Handle Pattern:
Cup Depth: ~1026 points
Breakout Level: 3414 (multi-touch resistance).
Golden Cross Confirmation: 50 EMA crossed above 200 EMA (bullish long-term momentum shift).
Volume & Price Confirmation:
- Entry Trigger: Close above 3414 with a strong green candle + above-average volume (min. 1.5x 20-day avg volume).
- False Breakout Filter: Volume must surge to validate breakout.
🎯 Trade Strategy:
Entry Zone: 3415–3430 (after confirmed breakout).
Stop Loss: 3169 (swing low of the handle, below key support).
Target 1: 3750
Target 2: 4170
Final Target: 4455 (cup depth projected from breakout: *3414 + 1026 = 4440–4455*).
The trade targets 4455, but reaching this level will take time—patience is key as price works through resistance at 3750 and 4170.
📉 Price Action Mantra:
“Price absorbs all noise! Trade the CHART, not the news.”
📊 Why This Works:
1. Golden Cross Amplifies Momentum: Post-crossover, rallies average +25% in trending stocks.
2. Cup & Handle Statistics: 85% success rate when volume confirms breakout.
3. Volume Divergence: Declining volume in handle + surge on breakout = institutional accumulation.
⚠️ Risk Management:
Position Size: Risk ≤1% capital per trade.
Trailing SL: Move SL to 3300 after Target 1 (3750) hit.
Partial Exit: Book 50% at 3750, 25% at 4170, hold 25% for 4455.
🧠 Psychology & Market Structure:
Resistance Levels to Watch:
3750: Profit-taking zone.
4170: Key options barrier (break = accelerated FOMO).
Support Floor: 3200–3169 (must hold to preserve structure).
Set alerts, follow volume, and let price lead the way!
📌 Disclaimer:
This is not financial advice. Past performance ≠ future results. Conduct your own due diligence. Technical analysis has limitations and may not account for black swan events. Manage risk aggressively.

Styrenix Performance Materials Ltd - Breakout Setup, Move is ON.#STYRENIX trading above Resistance of 2485
Next Resistance is at 3295
Support is at 1675
Here are previous charts:
Chart is self explanatory. Levels of breakout, possible up-moves (where stock may find resistances) and support (close below which, setup will be invalidated) are clearly defined.
Disclaimer: This is for demonstration and educational purpose only. This is not buying or selling recommendations. I am not SEBI registered. Please consult your financial advisor before taking any trade.

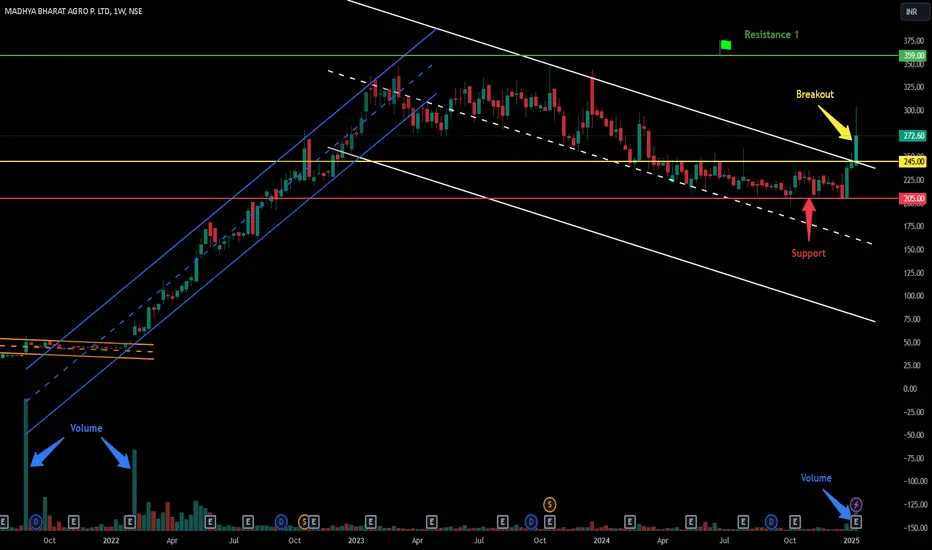
Breakout in Madhya Bharat Agro Products Ltd...Chart is self explanatory. Levels of breakout, possible up-moves (where stock may find resistances) and support (close below which, setup will be invalidated) are clearly defined.
Disclaimer: This is for demonstration and educational purpose only. This is not buying or selling recommendations. I am not SEBI registered. Please consult your financial advisor before taking any trade.
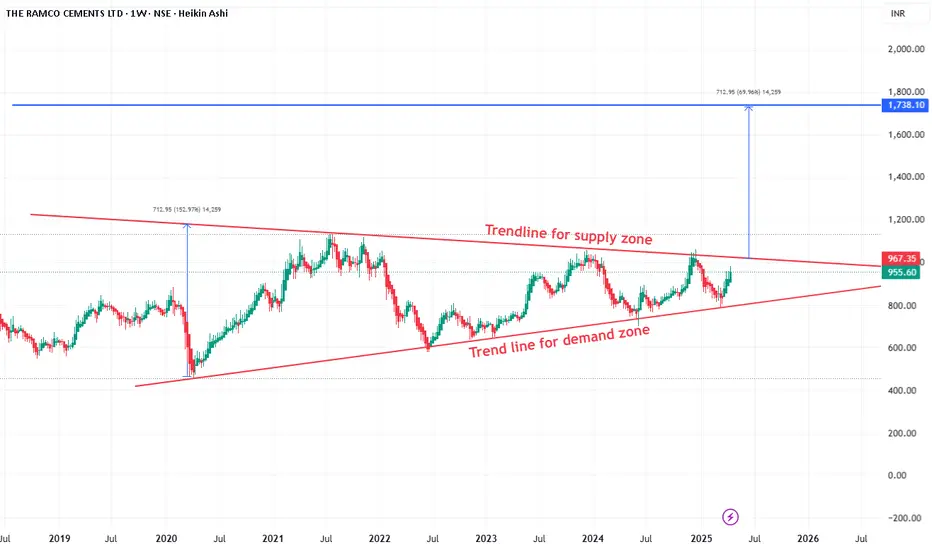
Ramco Cement may give break out of triangle pattern soon.Ramco Cement as per chart is trading on triangle pattern. As per indicator stock is bullish and ready for breakout. Major supply zone is 1010. After crossing this level, it may give massive move for considerable gain. It can accumulate here add more after breakout.
Advanced Institutions Option Trading - Part 7Time Decay (Theta) Strategies
Options lose value over time due to Theta Decay.
Strategies to Take Advantage of Theta:
Selling options (Covered Calls, Naked Puts)
Calendar Spreads
Iron Butterflies
Caution:
Theta decay accelerates as expiry nears. Option sellers must hedge their deltas to stay safe.
Risk Management in Options
Institutions and pro traders always focus on capital protection.
🔐 Techniques:
Position sizing (no more than 2-3% risk per trade)
Hedging with opposite legs or underlying
Stop-loss on premium or delta exposure
Use of Greeks for real-time adjustment
Risk management > Strategy in the long run.

Bulish Breakout in HUBTOWNIn upcomming Few Days we ll see a bulish breakout in HUBTOWN
as price is going to retrace the level then it will break the level 136.6 and there is a possible upcomming move in HUBTOWN

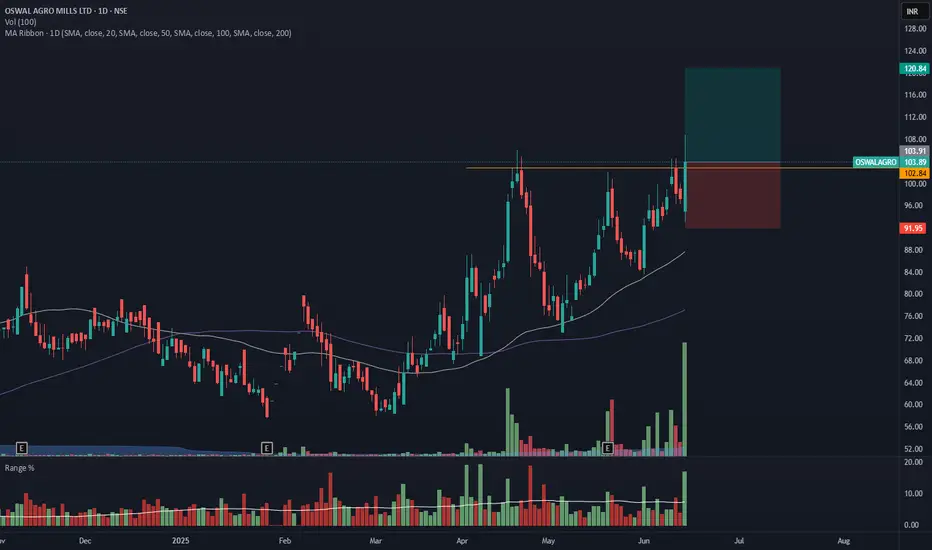
OSWALAGRO - Breakout from DTFOSWALAGRO has resistance weakening on the Daily charts and has given a breakout with good volume.
The target of this pattern signals an upside potential of 15% from the current price level in the medium term.
The stock is trading above its 50- and 100-day exponential moving averages (EMAs). The range is more than >2X, and the Volume is also >10X the average.
CMP- Rs. 104
Est. Entry price ~ 108
Target Price- Rs120 ( 15% upside)
SL -92
Note- The candle closed isn't very promising, so we have to wait for a stronger move.
Disclaimer: This is not a buy/sell recommendation. For educational purpose only. Kindly consult your financial advisor before entering a trade.
ROTOROTO is showing good strength and currently trading above previous resistance line. It is in to consolidation phase. It seems like accumulation has been observed in recent sessions. Now as long as it is closing above 279 then ROTO is very strong and available at very good risk-reward. One may expect 12% to 21% in next rally once it comes from consolidation phase.

Bullish Breakout in HCL TechStock breaks above key resistance zone of ₹1770
Strong bullish candle formation on the daily chart
Breakout supported by above-average volume, confirming strength
Price broke out from ascending triangle pattern — a classic bullish continuation signal
📢 Fundamental Trigger:
HCL Tech remains strong in cloud, AI, and digital transformation services
Recent deal wins and strong Q4 results supporting bullish sentiment
Attractive valuation compared to peers like TCS & Infosys

Bullish Breakout in VIP Industries 🔍 Chart Overview:
Breakout above resistance zone at ₹420
Strong volume spike confirming buying interest
Price action broke out of a consolidation channel
Formed a bullish flag/pennant pattern before breakout
🔧 Technical Indicators:
RSI moving above 60 → bullish momentum building
MACD crossover near zero line → fresh upward signal
50 EMA support intact, stock trading above all major EMAs

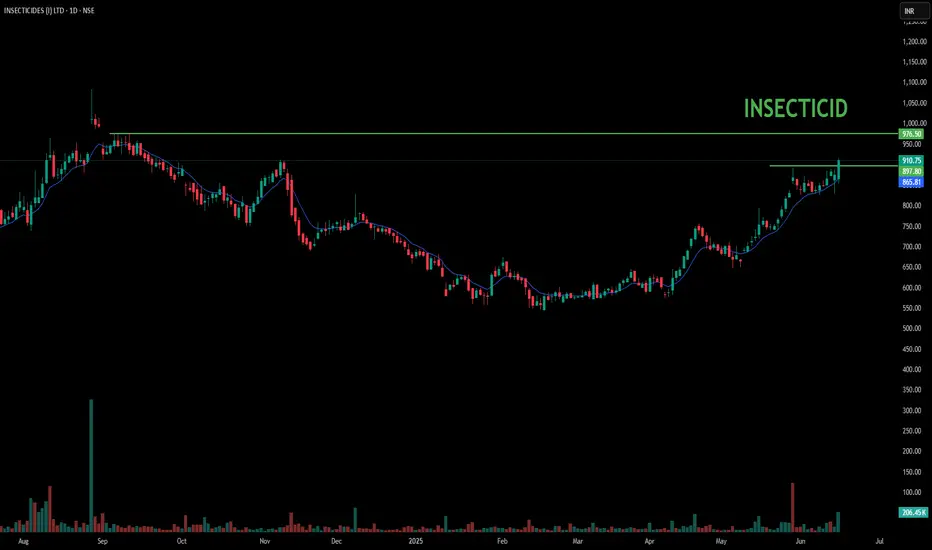
INSECTICIDES - BREAKOUT STOCK📈 Insecticides (India) Ltd – Breakout Stock on the Radar
Insecticides India is currently exhibiting strong technical momentum, supported by high volumes and a confirmed breakout on the charts. The stock has surpassed key resistance levels, indicating potential for short- to medium-term upside. Traders and investors should keep this stock on their watchlist for further price action confirmation.
🔍 Key Observations
Breakout from a consolidation zone
Rising volumes supporting the move
Technical indicators signaling bullish momentum
📌 This update is purely for informational and educational purposes only and not a recommendation to buy or sell any securities. Please do your own research or consult a SEBI-registered advisor before making any investment decisions.
Buy Voltamp for 61% upside moveTake entry at cmp 8844
Strong Daily closing basis SL of 8225( Exit if closing below 8225)
Target 14271
Zero debt counter with more than 20% FII DII holding
10 year profit growth 31% and Sales growth 14%

JUBILANT INGREVIA (LONG)Price has given a long tern consolidated range breakout with multiple cofluences
Point to look at -
- All Ema Lined Up (Bullish)
- High Volume Spurt
-14-15 % Move Possiblity
- Big Bar Candle Breakout
Retest Level - 756-760 Area
Upside Level - 870
Invalid Below -690 CB
Till Then, Stay Focused, Keep Following Markets

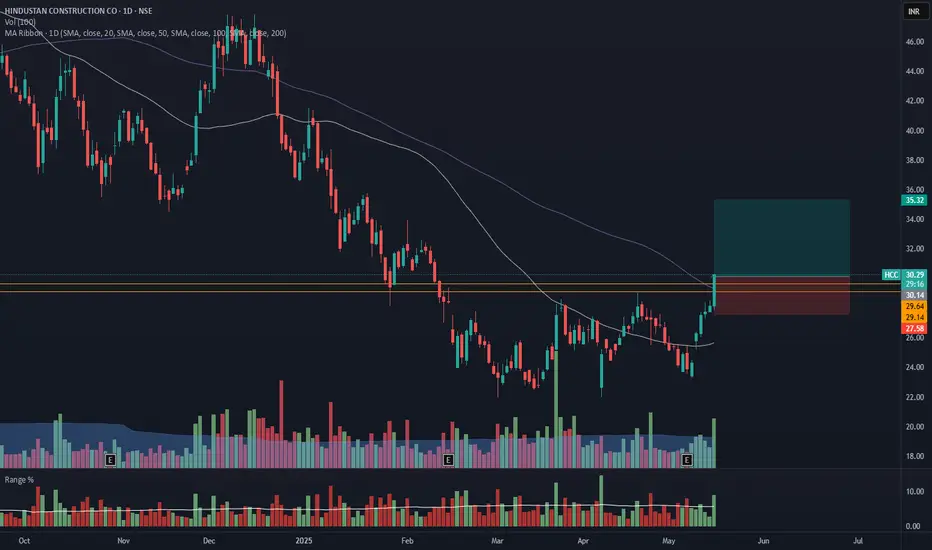
HCC - Breakout from DTFHCC has resistance weakening on the Daily charts and has given a breakout with good volume.
The target of this pattern signals an upside potential of 17% from the current price level in the medium term.
The stock is trading above its 50- and 100-day exponential moving averages (EMAs). The range is more than 1.5X, and the Volume is also 1.5X the average.
CMP- Rs. 30
Target Price- Rs35 ( 17% upside)
SL - 27.5
Disclaimer: This is not a buy/sell recommendation. For educational purpose only. Kindly consult your financial advisor before entering a trade.
Glenmark Pharma for Big profitTake entry at 1468Rs
Strong SL of 1426 Rs
Target will be 1774
We will have almost 3% SL and 20% of terget so it will be best deal acc to risk rewards ratio.
Counter is ready to give its downtrendline breakout and we will make entry at 1426 because it will be its retest level.....

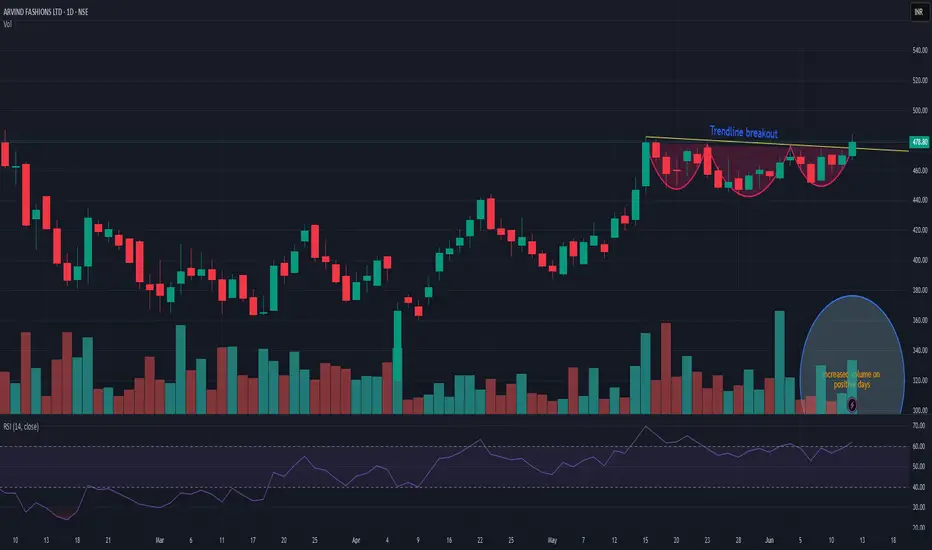
ARVINDFASNARVINDFASN showing very good strength on this negative days as well and currently trying to coming out of consolidation. As long as it is closing above 440 then dips are good to accumulate. Positive momentum may fetch the stock up to 600 in near term. And next trigger level can b above 485. Wait for the perfect entry point.
Karnataka Bank Long Idea#KTKBANK Broke out now. Need to wait for Friday closing to confirm.
It has done Long term breakout retest in Monthly Chart.
I have attached Weekly Chart for breakout as image.
Risk Reward is good. Tarde as per risk management.

ADANIGREENADANIGREEN has given resistance breakout with decent volume. Resistance on upper side is around 1250 and support is nr 980-90. Today traction in ADANI group has been observed and this may push fresh momentum in upcoming days. Keep it on radar

SIEMENS LTD - Bullish Flag & Pole Breakout (Daily T/F)Trade Setup
📌 Stock: SIEMENS LTD ( NSE:SIEMENS )
📌 Trend: Strong Bullish Momentum
📌 Risk-Reward Ratio: 1:3 (Favorable)
🎯 Entry Zone: ₹3383.00 (Breakout Confirmation)
🛑 Stop Loss: ₹3208.00 (Daily Closing Basis) (-5 % Risk)
🎯 Target Levels:
₹3484.50
₹3589.10
₹3696.80
₹3807.70
₹3922.00 (Final Target)
Technical Rationale
✅ Bullish Flag & Pole Breakout - Classic bullish pattern confirming uptrend continuation
✅ Strong Momentum - Daily RSI >69 , Weekly RSI >59 & Monthly RSI >59 (Bullish zone)
✅ Volume Confirmation - Breakout volume 15.52M vs previous day's 4.27M (Nearly 4x surge)
✅ Multi-Timeframe Alignment - Daily and weekly charts showing strength
Key Observations
• The breakout comes with significantly higher volume, validating strength
• Well-defined pattern with clear price & volume breakout
• Conservative stop loss at recent swing low
Trade Management Strategy
• Consider partial profit booking at each target level
• Move stop loss to breakeven after Target 1 is achieved
• Trail stop loss to protect profits as price progresses
Disclaimer ⚠️
This analysis is strictly for educational purposes and should not be construed as financial advice. Trading in equities involves substantial risk of capital loss. Past performance is not indicative of future results. Always conduct your own research, consider your risk appetite, and consult a financial advisor before making any investment decisions. The author assumes no responsibility for any trading outcomes based on this information.
What do you think? Are you watching NSE:SIEMENS for this breakout opportunity? Share your views in the comments!

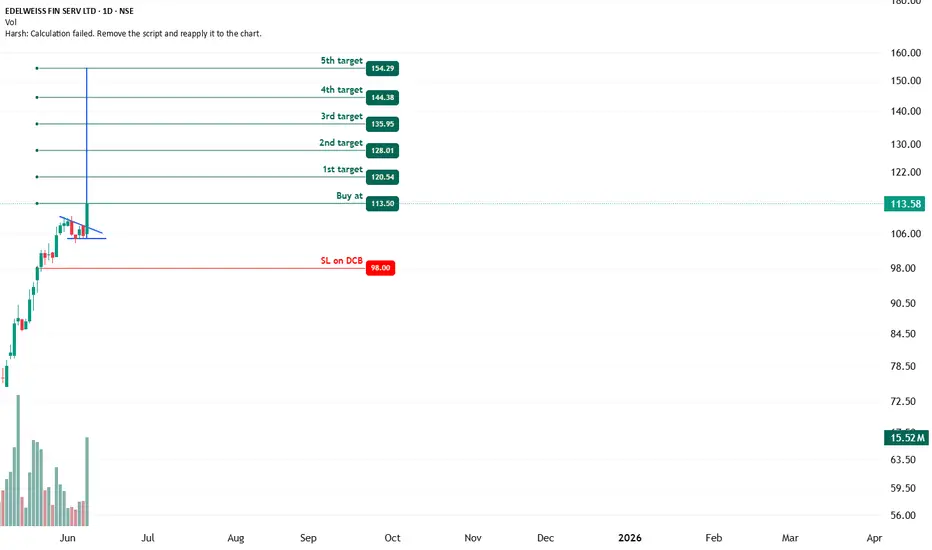
EDELWEISS FIN SERV - Bullish Flag & Pole Breakout (Daily T/F)Trade Setup
📌 Stock: EDELWEISS FIN SERV LTD ( NSE:EDELWEISS )
📌 Trend: Strong Bullish Momentum
📌 Risk-Reward Ratio: 1:3 (Favorable)
🎯 Entry Zone: ₹113.50 (Breakout Confirmation)
🛑 Stop Loss: ₹98.00 (Daily Closing Basis) (-14 % Risk)
🎯 Target Levels:
₹120.54
₹128.01
₹135.95
₹144.38
₹154.29 (Final Target)
Technical Rationale
✅ Bullish Flag & Pole Breakout - Classic bullish pattern confirming uptrend continuation
✅ Strong Momentum - Daily RSI >60 , Weekly RSI >56 & Monthly RSI >59 (Bullish zone)
✅ Volume Confirmation - Breakout volume 15.52M vs previous day's 4.27M (Nearly 4x surge)
✅ Multi-Timeframe Alignment - Daily and weekly charts showing strength
Key Observations
• The breakout comes with significantly higher volume, validating strength
• Well-defined pattern with clear price & volume breakout
• Conservative stop loss at recent swing low
Trade Management Strategy
• Consider partial profit booking at each target level
• Move stop loss to breakeven after Target 1 is achieved
• Trail stop loss to protect profits as price progresses
Disclaimer ⚠️
This analysis is strictly for educational purposes and should not be construed as financial advice. Trading in equities involves substantial risk of capital loss. Past performance is not indicative of future results. Always conduct your own research, consider your risk appetite, and consult a financial advisor before making any investment decisions. The author assumes no responsibility for any trading outcomes based on this information.
What do you think? Are you watching NSE:EDELWEISS for this breakout opportunity? Share your views in the comments!