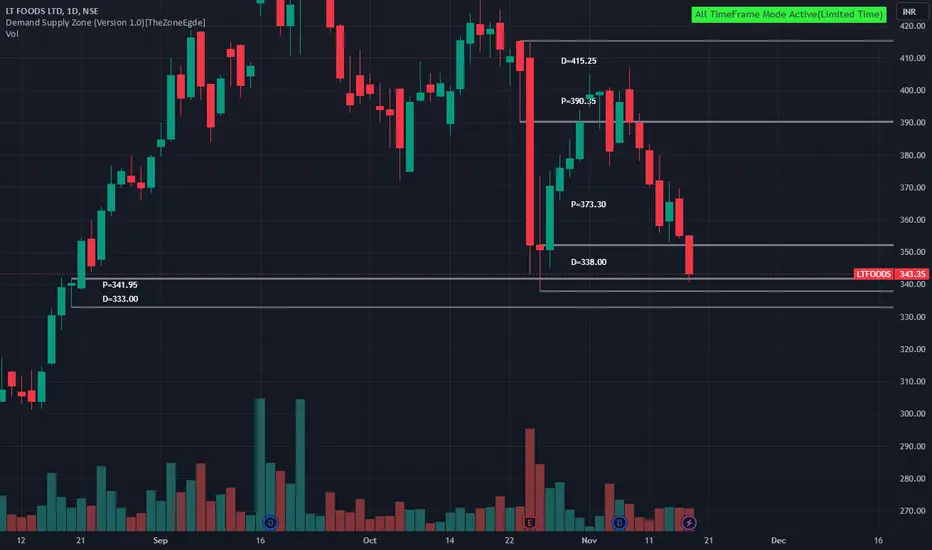
LTFOODS Trading Within Tested Demand ZoneLTFOODS is currently trading at ₹343.35, positioned within its tested demand zone between ₹341.95 and ₹333, identified on 21st August 2024. This zone has previously demonstrated support, suggesting continued buying interest around these levels. Investors may look for potential accumulation in this r
Next report date
—
Report period
—
EPS estimate
—
Revenue estimate
—
17.30 INR
5.93 B INR
77.40 B INR
133.80 M
About LT FOODS LTD
Sector
Industry
CEO
Ashwani Kumar Arora
Website
Headquarters
Gurgaon
Founded
1950
ISIN
INE818H01020
FIGI
BBG000MCTBN7
LT Foods Ltd. operates as a holding company, which engages in the manufacture and storage of rice products. The firm's brands include Daawat, Royal, Daawat Brown Rice, Ecolife, Devaaya and Kari Kari. Its rice product portfolio comprises of brown rice, white rice, steamed rice, parboiled rice, organic rice, quick cooking rice, value added rice, and flavored rice in the ready to cook segment. The company was founded by Raghunath Arora in 1990 and is headquartered in Gurgaon, India.
LT FOODS - Health BO w/ 40% upside possibility!Overview & Observation:
1. Strong breakout
2. RRR is favourable
3. Moving with weekly demand
4. Momentum is strong.
Trade Plan:
Entry = 248
SL = 215
TP = 280, 300, 350++
- Stay tuned for further insights, updates and trade safely!
- If you liked the analysis, don't forget to leave a comment and

LT Foods : Cup & Handle BreakoutLT Foods ::
Cup and Handle Breakout
Stay Long above 250 with immediate support at 233

LT foods weekly candlethis stock has given breakout of trendline on weekly chart.
stock has faced resistance 4 times and now has closed above the trendline.

LT foods ready for a potential upsideSurpassed BO level with good buying volumes.
A potential upside of 25% TO 45%

Cup and Handle pattern breakoutGood volume build up in daily and weekly timeframe.
Price forming cup and handle pattern , breakout with good volume.
PSI also conforming breakout.
Smallcap !!!!!!
NOTE: I do my analysis, do yours before trade.

ltfoodsL T Foods is breaking its all time high a big candle close to its new ATH stocks is looking good in near future as FMCG sector is always in demand can go for the target of 280 or 20% gain from LTP

Breakout in LT FOODSCup & Handle Breakout
RSI above 65 and rising
Trading above EMA50
Volume spurt
6 months of consolidation
Disc: for study, not a recommendation

Cup and handle breakoutLtfoods will. Move good this year supported by growing demand and good monsoon season this year

upmove in LTFOODSnice base setup. cup-handle formation also found. upside 20% possible on the basis of technicals

See all ideas
An aggregate view of professional's ratings.
Displays a symbol's price movements over previous years to identify recurring trends.
Frequently Asked Questions
The current price of LTFOODS is 427.25 INR — it has decreased by −2.39% in the past 24 hours. Watch LT FOODS LTD stock price performance more closely on the chart.
Depending on the exchange, the stock ticker may vary. For instance, on NSE exchange LT FOODS LTD stocks are traded under the ticker LTFOODS.
LTFOODS stock has risen by 3.03% compared to the previous week, the month change is a 12.45% rise, over the last year LT FOODS LTD has showed a 97.80% increase.
We've gathered analysts' opinions on LT FOODS LTD future price: according to them, LTFOODS price has a max estimate of 520.00 INR and a min estimate of 322.00 INR. Watch LTFOODS chart and read a more detailed LT FOODS LTD stock forecast: see what analysts think of LT FOODS LTD and suggest that you do with its stocks.
LTFOODS reached its all-time high on Sep 17, 2024 with the price of 447.95 INR, and its all-time low was 2.55 INR and was reached on Mar 13, 2009. View more price dynamics on LTFOODS chart.
See other stocks reaching their highest and lowest prices.
See other stocks reaching their highest and lowest prices.
LTFOODS stock is 3.94% volatile and has beta coefficient of 1.50. Track LT FOODS LTD stock price on the chart and check out the list of the most volatile stocks — is LT FOODS LTD there?
Today LT FOODS LTD has the market capitalization of 152.67 B, it has increased by 6.50% over the last week.
Yes, you can track LT FOODS LTD financials in yearly and quarterly reports right on TradingView.
LT FOODS LTD is going to release the next earnings report on Feb 5, 2025. Keep track of upcoming events with our Earnings Calendar.
LTFOODS net income for the last quarter is 1.48 B INR, while the quarter before that showed 1.53 B INR of net income which accounts for −3.12% change. Track more LT FOODS LTD financial stats to get the full picture.
LT FOODS LTD dividend yield was 0.80% in 2023, and payout ratio reached 8.78%. The year before the numbers were 1.03% and 8.00% correspondingly. See high-dividend stocks and find more opportunities for your portfolio.
As of Dec 11, 2024, the company has 1.19 K employees. See our rating of the largest employees — is LT FOODS LTD on this list?
EBITDA measures a company's operating performance, its growth signifies an improvement in the efficiency of a company. LT FOODS LTD EBITDA is 9.54 B INR, and current EBITDA margin is 11.88%. See more stats in LT FOODS LTD financial statements.
Like other stocks, LTFOODS shares are traded on stock exchanges, e.g. Nasdaq, Nyse, Euronext, and the easiest way to buy them is through an online stock broker. To do this, you need to open an account and follow a broker's procedures, then start trading. You can trade LT FOODS LTD stock right from TradingView charts — choose your broker and connect to your account.
Investing in stocks requires a comprehensive research: you should carefully study all the available data, e.g. company's financials, related news, and its technical analysis. So LT FOODS LTD technincal analysis shows the buy rating today, and its 1 week rating is buy. Since market conditions are prone to changes, it's worth looking a bit further into the future — according to the 1 month rating LT FOODS LTD stock shows the buy signal. See more of LT FOODS LTD technicals for a more comprehensive analysis.
If you're still not sure, try looking for inspiration in our curated watchlists.
If you're still not sure, try looking for inspiration in our curated watchlists.