BUY TODAY SELL TOMORROW for 5%DON’T HAVE TIME TO MANAGE YOUR TRADES?
- Take BTST trades at 3:25 pm every day
- Try to exit by taking 4-7% profit of each trade
- SL can also be maintained as closing below the low of the breakout candle
Now, why do I prefer BTST over swing trades? The primary reason is that I have observed that 90% of the stocks give most of the movement in just 1-2 days and the rest of the time they either consolidate or fall
Round Bottom & Retested Breakout in
HEMIPROP
BUY TODAY SELL TOMORROW for 5%
Breakouttrading

BUY TODAY SELL TOMORROW for 5%DON’T HAVE TIME TO MANAGE YOUR TRADES?
- Take BTST trades at 3:25 pm every day
- Try to exit by taking 4-7% profit of each trade
- SL can also be maintained as closing below the low of the breakout candle
Now, why do I prefer BTST over swing trades? The primary reason is that I have observed that 90% of the stocks give most of the movement in just 1-2 days and the rest of the time they either consolidate or fall
Round Bottom Breakout in PAUSHAKLTD
BUY TODAY SELL TOMORROW for 5%

Shalimar paint Today stock given break correction start candle break out
,
Mostly after big volume 80/90% consolidation or mostly fall
But here after selling pressure absorption happens look like.
Delivery % 18-19 Sept (24% & 30%)
30 sept delivery % 51.9%
Looklike earning buying after results post price showing reaction

Bank Of BarodaHello & welcome to this analysis
After giving a breakout with strong volume followed by a pullback to the breakout level it appears to be ready for further upside till 270 - 300
This view would be invalid below 247
All the best

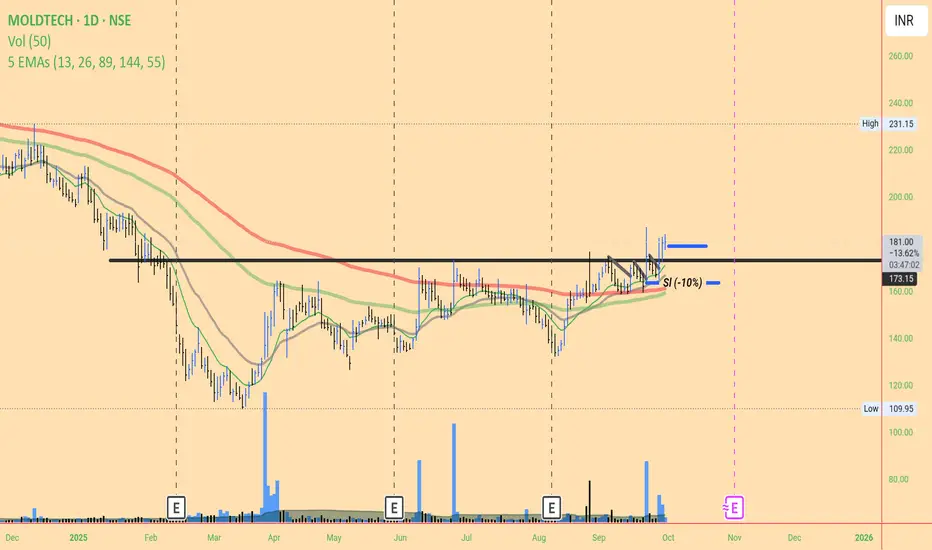
Mold-Tech #technicalanalysis
pattern look like vcp from left to right move price became narrow.
High volume after absorption ,
* Now price break 1st correction candle above trade. Entry point
* Sl -10% , from entry point 179 current price,
Reason below high volume after selling zone absorption area below that.
BUY TODAY SELL TOMORROW for 5%DON’T HAVE TIME TO MANAGE YOUR TRADES?
- Take BTST trades at 3:25 pm every day
- Try to exit by taking 4-7% profit of each trade
- SL can also be maintained as closing below the low of the breakout candle
Now, why do I prefer BTST over swing trades? The primary reason is that I have observed that 90% of the stocks give most of the movement in just 1-2 days and the rest of the time they either consolidate or fall
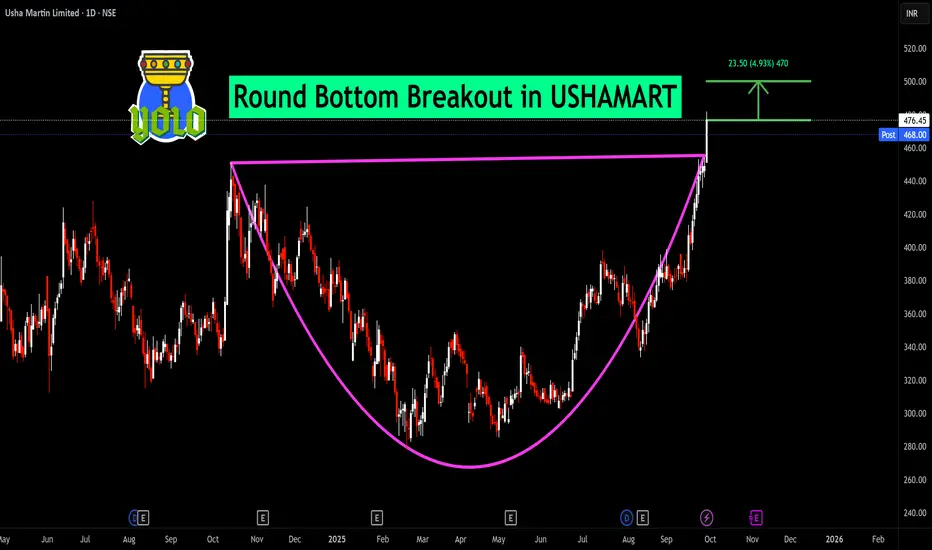
Round Bottom Breakout in USHAMART
BUY TODAY SELL TOMORROW for 5%
Godawari Power And Ispat Limited - Breakout Setup, Move is ON...#GPIL trading above Resistance of 793
Next Resistance is at 1270
Support is at 497
Here is previous chart:
Chart is self explanatory. Levels of breakout, possible up-moves (where stock may find resistances) and support (close below which, setup will be invalidated) are clearly defined.
Disclaimer: This is for demonstration and educational purpose only. This is not buying or selling recommendations. I am not SEBI registered. Please consult your financial advisor before taking any trade.

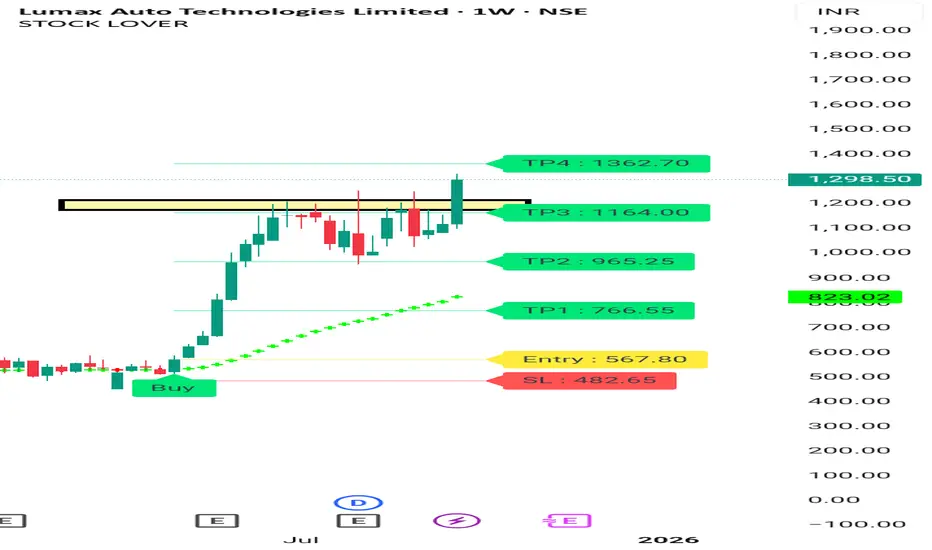
Lumax Tech Breakout On Weekly Chart Full auto Ancillary Sector is on. Breakout. Lumax Tech also Give Breakout.
It's good bet for Medium to long term with a StopLoss.
Tgt 1500 -1800
Keep SL of 10%
Consult your financial advisor before making any position.
For more information visit my profile on Tradingview.
Silver Bullish Breakout on Monthly & Weekly CharPattern Formed: Symmetrical Triangle (Long-Term Consolidation)
Breakout Type: Bullish Breakout on Monthly & Weekly Chart
Volume Confirmation: Strength in breakout with price expansion
Measured Move Target: ~$44 (based on triangle height projection)
Immediate Resistance Zone: $44.11 (Historical supply zone)
Support Levels Post-Breakout:
Immediate Support: $34.78
Strong Support: $33.28

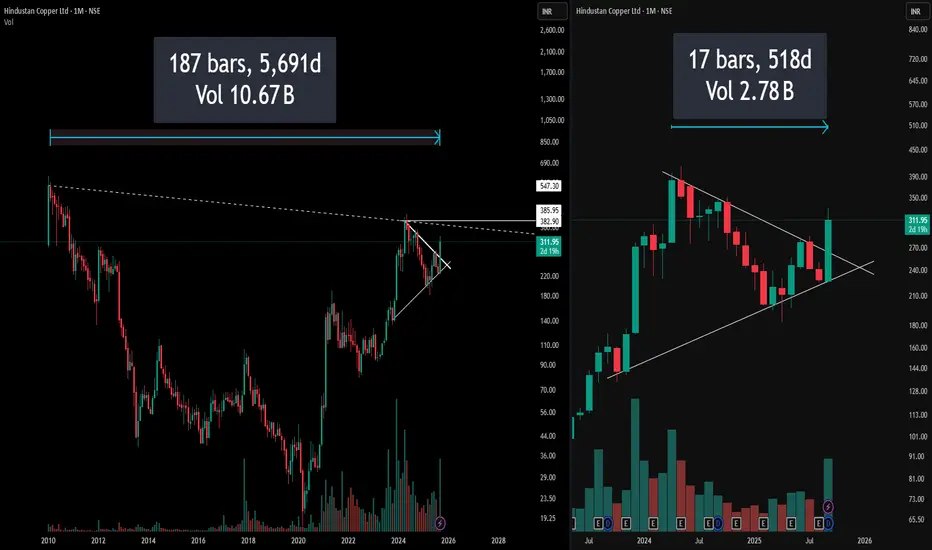
5000 Days vs 500 Days of Data : Which is better ?Most traders jump straight into attractive chart patterns and impulsively take trades, ignoring the bigger picture. Here’s a powerful case study
Left Side: Full Monthly Chart with Hidden Resistance
On the left, the chart captures over a decade of price action, immediately drawing attention to a long-standing downward-sloping resistance stretching from all-time highs. This hidden resistance line is not visible on the usual zoomed-in view, yet it presents a formidable barrier that traders often neglect.
(Pro Insight: Always extend trendlines and resistance zones till the inception of the instrument for real swing perspective)
(Risk Reminder: What looks like a clear breakout on a recent timeframe may actually be approaching a multi-year resistance trap)
Right Side: Symmetrical Triangle – The Pattern Focus
The right segment restricts focus to the last few years, zooming in on a visually perfect symmetrical triangle. While the setup looks neat and promising—indicating contraction and likely expansion ahead—this trimmed view risks obscuring the bigger, hidden resistance directly overhead.
Disclaimer: This post reflects technical views for educational purposes only, not investment advice. Always perform your own due diligence before trading.
BUY TODAY SELL TOMORROW for 5%DON’T HAVE TIME TO MANAGE YOUR TRADES?
- Take BTST trades at 3:25 pm every day
- Try to exit by taking 4-7% profit of each trade
- SL can also be maintained as closing below the low of the breakout candle
Now, why do I prefer BTST over swing trades? The primary reason is that I have observed that 90% of the stocks give most of the movement in just 1-2 days and the rest of the time they either consolidate or fall
Resistance Breakout in MTARTECH
BUY TODAY SELL TOMORROW for 5%

BUY TODAY SELL TOMORROW for 5%DON’T HAVE TIME TO MANAGE YOUR TRADES?
- Take BTST trades at 3:25 pm every day
- Try to exit by taking 4-7% profit of each trade
- SL can also be maintained as closing below the low of the breakout candle
Now, why do I prefer BTST over swing trades? The primary reason is that I have observed that 90% of the stocks give most of the movement in just 1-2 days and the rest of the time they either consolidate or fall
Cup and Handle Breakout in RICOAUTO
BUY TODAY SELL TOMORROW for 5%

BUY TODAY SELL TOMORROW for 5%DON’T HAVE TIME TO MANAGE YOUR TRADES?
- Take BTST trades at 3:25 pm every day
- Try to exit by taking 4-7% profit of each trade
- SL can also be maintained as closing below the low of the breakout candle
Now, why do I prefer BTST over swing trades? The primary reason is that I have observed that 90% of the stocks give most of the movement in just 1-2 days and the rest of the time they either consolidate or fall
Resistance Breakout in SJS
BUY TODAY SELL TOMORROW for 5%

BUY TODAY SELL TOMORROW for 5%DON’T HAVE TIME TO MANAGE YOUR TRADES?
- Take BTST trades at 3:25 pm every day
- Try to exit by taking 4-7% profit of each trade
- SL can also be maintained as closing below the low of the breakout candle
Now, why do I prefer BTST over swing trades? The primary reason is that I have observed that 90% of the stocks give most of the movement in just 1-2 days and the rest of the time they either consolidate or fall
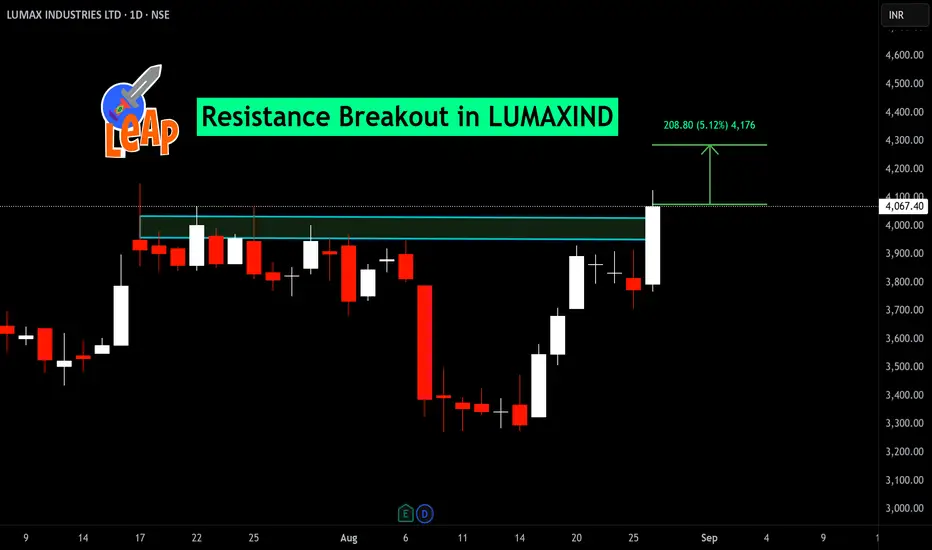
Resistance Breakout in LUMAXIND
BUY TODAY SELL TOMORROW for 5%
BUY TODAY SELL TOMORROW for 5%DON’T HAVE TIME TO MANAGE YOUR TRADES?
- Take BTST trades at 3:25 pm every day
- Try to exit by taking 4-7% profit of each trade
- SL can also be maintained as closing below the low of the breakout candle
Now, why do I prefer BTST over swing trades? The primary reason is that I have observed that 90% of the stocks give most of the movement in just 1-2 days and the rest of the time they either consolidate or fall
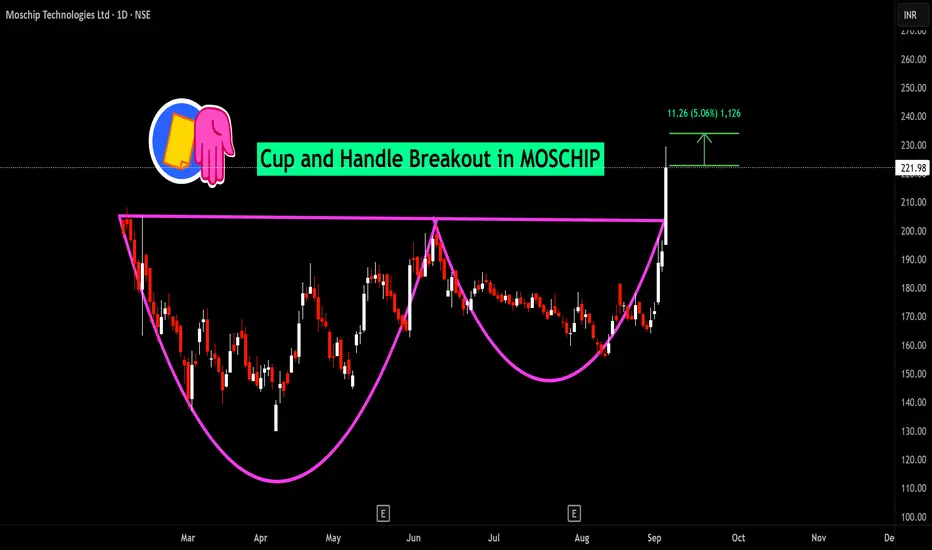
Cup and Handle Breakout in MOSCHIP
BUY TODAY SELL TOMORROW for 5%
BUY TODAY SELL TOMORROW for 5%DON’T HAVE TIME TO MANAGE YOUR TRADES?
- Take BTST trades at 3:25 pm every day
- Try to exit by taking 4-7% profit of each trade
- SL can also be maintained as closing below the low of the breakout candle
Now, why do I prefer BTST over swing trades? The primary reason is that I have observed that 90% of the stocks give most of the movement in just 1-2 days and the rest of the time they either consolidate or fall
Trendline Breakout in GMDCLTD
BUY TODAY SELL TOMORROW for 5%

BUY TODAY SELL TOMORROW for 5%DON’T HAVE TIME TO MANAGE YOUR TRADES?
- Take BTST trades at 3:25 pm every day
- Try to exit by taking 4-7% profit of each trade
- SL can also be maintained as closing below the low of the breakout candle
Now, why do I prefer BTST over swing trades? The primary reason is that I have observed that 90% of the stocks give most of the movement in just 1-2 days and the rest of the time they either consolidate or fall
Trendline Breakout in FLUOROCHEM
BUY TODAY SELL TOMORROW for 5%

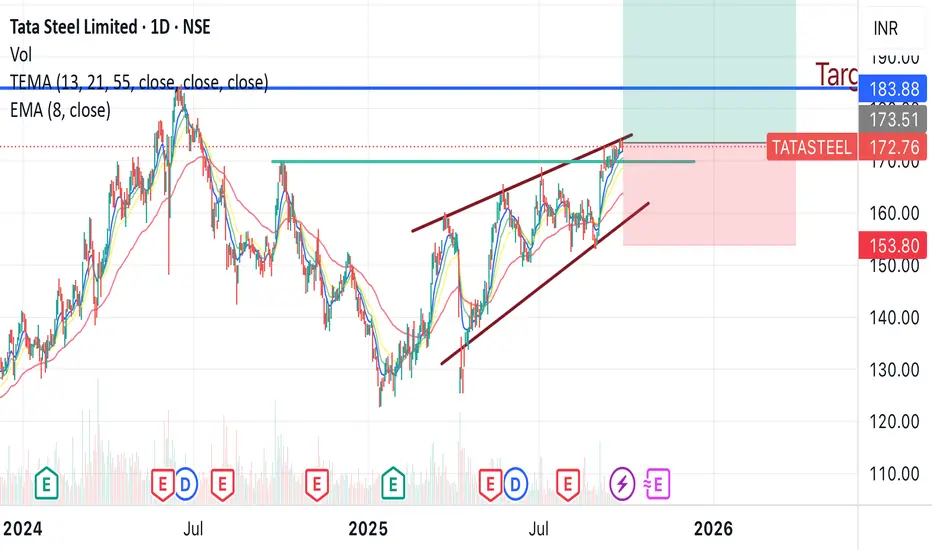
Tata Steel trend line and 1 year resistance breakout Tata steel is gonna give a breakout soon, as it has been in a continuous up trend, reaching 1 year resistance and broken it, it can give from 10-20 % profit from here in short term .
Buy around - 172- 173
Target - 207
Duration - 2-3 months
BTC LONG SETUPBTC/USDT – 1H Long Setup Analysis
🔹 Current Price: 111,653 USDT (Bitget Perpetual)
🔹 Trend: After a sharp drop from recent highs, BTC is showing signs of forming a base with a possible rebound setup.
⸻
Key Observations:
1. Support Zone:
• Strong support is visible around 110,744 – 110,747 USDT, marked by previous demand and horizontal structure.
• Below that, deeper support lies near 109,383 – 108,534 USDT.
2. Resistance Levels / Targets:
• TP1: ~115,078 – 115,980 USDT
• TP2: ~117,340 – 118,165 USDT
• Higher extension target: ~119,810 USDT
3. Trend Structure:
• Price broke a rising channel but has bounced back after a correction.
• Current pullback is retesting demand, indicating potential continuation to the upside if bulls defend the base.
4. Indicators:
• EMA 9 (blue) is currently under pressure, suggesting short-term weakness, but if reclaimed, momentum could shift bullish.
• Volume shows increased activity at recent lows, hinting at accumulation.
⸻
Long Trade Plan (Swing Bias):
✅ Entry Zone: Between 111,000 – 111,700 USDT (current price zone, near support)
✅ Stop-Loss: Below 110,744 USDT (to avoid fakeouts)
✅ Take Profit Targets:
• TP1 → 115,078 – 115,980 USDT
• TP2 → 117,340 – 118,165 USDT
• Extended TP → 119,810 USDT
📊 Risk-Reward Ratio: Favorable (approx. 1:3+ if targeting TP2).
⸻
Summary:
BTC is consolidating above a strong support base. If bulls hold the 111K–110.7K zone, upside targets remain valid towards 115K–118K. A break below 110.7K would invalidate this setup and could push price toward 109K or lower.

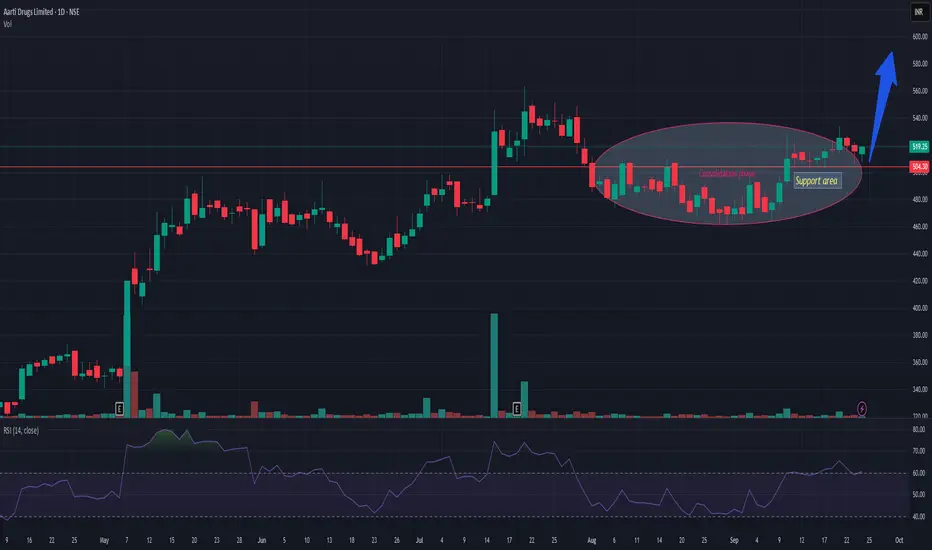
AARTIDRUGSAARTIDRUGS is trading in long consolidation zone with dried volume. Support zone is near 495-500. Currently trading near 515-17. Once it gets market participation then the probability of resuming continuation of uptrend is very high. Risk reward is quite in favor. Keep it in your watch list.
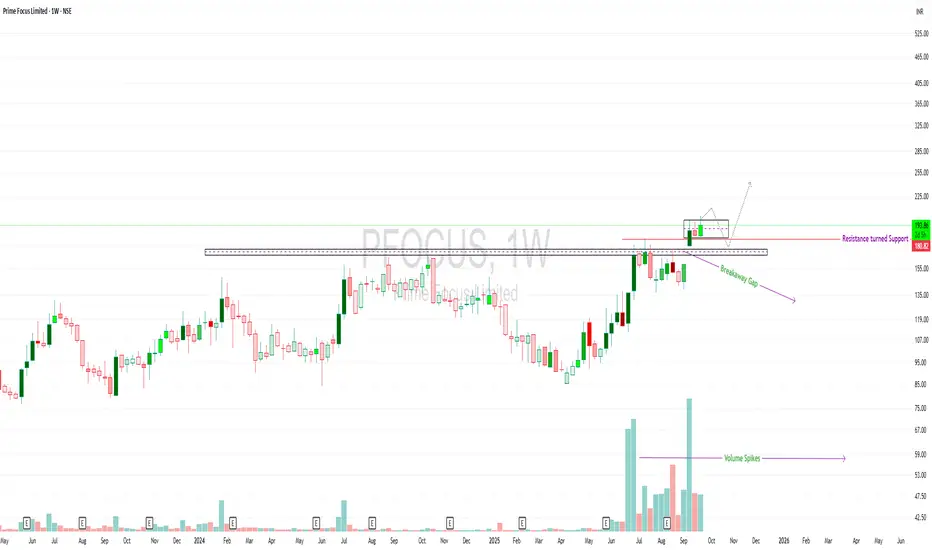
Prime Focus Ltd – Weekly Analysis
Breakaway gap seen above the resistance zone.
Strong volume confirmation supports the breakout.
Previous resistance ~₹180 has flipped into support.
Currently consolidating above the breakout zone.Retest possibility remains, but structure suggests strength as long as ₹180 holds.
🔎 Classic example of a resistance-turned-support with volume validation. Useful for those studying breakout structures.Observation only, not a trade call. Educational use.
⚠️ Disclaimer: This chart is shared purely for educational and informational purposes. It is not a buy/sell recommendation or financial advice. Please do your own research or consult a SEBI-registered advisor before making any investment decisions.
Gold’s Medium-Term Play: From Momentum Peaks to Reload Zones!!Gold’s rally has been relentless, breaking out of ranges and pressing higher into the 3750s. That strength reflects the macro backdrop where the Fed is walking a fine line: inflation is sticky, growth signals are uneven, and market expectations are already pricing a deeper rate-cut cycle. Yields have softened, the dollar has lost some shine, and capital continues to flow into safe-haven trades. All of this leaves gold well supported in the medium term, though the path forward will not be a straight line.
Target Zone (3827–3840):
The immediate stretch for bulls sits higher around 3827–3840. This is where the rally could stall as momentum traders lock in profits. A clean break and hold above this zone would open the door to new all-time highs, but the market could just as easily treat it as a ceiling before pulling back.
Hidden Bounce Zone (3720–3680):
Sitting just under the current price is a pocket that often acts as a liquidity trap. Markets can bounce sharply from here or slice through with equal speed. For active trades this zone will give the first clue whether momentum is running out of steam.
High-volume Zone (3630):
This level is the backbone of the current structure. Holding above it keeps the broader trend intact. A decisive break below, however, signals that the correction phase has started and the market is hunting for deeper liquidity.
Correction Band (3600–3560):
If gold slips into this range, expect chop and sideways action as weak longs get flushed out and new buyers gradually step in. This zone isn’t where the story ends, but where the market catches its breath.
Medium-Term Reload Zone (3440–3480):
This is the level that matters for swing trades. If a deeper washout comes, this area offers the opportunity to reload positions for the next major leg up. The medium-term backdrop still favors higher prices, with rate cuts, a weaker dollar, and central bank demand forming a strong tailwind.
Macro Picture
Fed Outlook: Committee members are split, but the overall tone is tilting toward easing as growth cracks widen. Powell may sound careful, yet markets are already betting on more cuts ahead.
Dollar and Yields: The dollar index remains pressured while U.S. yields edge lower, creating a supportive base for gold.
Global Flows: Central banks remain steady buyers, and geopolitical tensions continue to underpin safe-haven demand.
In short, gold has room to push into the 3827–3840 zone, but trades should prepare for corrective phases along the way. The hidden bounce pocket and HVZ will decide the near-term path. Should the market wash down into the 3440–3480 reload zone, it should be seen not as weakness, but as a prime setup to load into the medium-term bullish story. Trade safe!

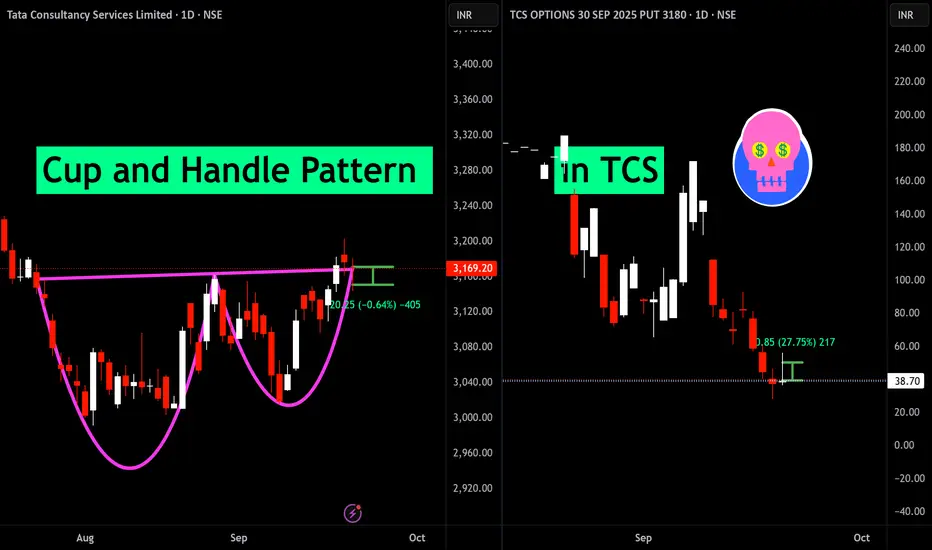
Cup and Handle Pattern failed in TCSThe cup and handle pattern has formed, but the anticipated breakout has not materialized. This failed breakout may indicate the potential for further downside movement in the stock