TanlaNorges Bank, managing Norway's sovereign wealth fund, bought 8.79 lakh (0.879 million) shares of Tanla Platforms at ₹745.10 each, totaling ₹65.51 crore, in a bulk deal on September 21, 2025. This large purchase likely boosted the stock's recent upward movement.
Q1 FY26 Results (Jun 2025):
Net sales up 3.84% YoY to ₹1,040.66 Cr, but net profit down 16.15% to ₹118.41 Cr due to higher costs.
In August 2025, Tanla repurchased 20 lakh (2 million) shares at ₹875 each, totaling ₹175 crore, which reduced the company's total equity by 1.49%.
Highlight -
Tanla has launched an AI-based anti-spam platform, powered by NVIDIA, in partnership with Indosat to protect over 100 million users, aligning with the Telecom Regulatory Authority of India (TRAI) guidelines on SMS scams.
New product launches , supply & demand recently buyback & institute buying match according CANSLIM criteria.
Breakouttrading
BUY TODAY SELL TOMORROW for 5%DON’T HAVE TIME TO MANAGE YOUR TRADES?
- Take BTST trades at 3:25 pm every day
- Try to exit by taking 4-7% profit of each trade
- SL can also be maintained as closing below the low of the breakout candle
Now, why do I prefer BTST over swing trades? The primary reason is that I have observed that 90% of the stocks give most of the movement in just 1-2 days and the rest of the time they either consolidate or fall
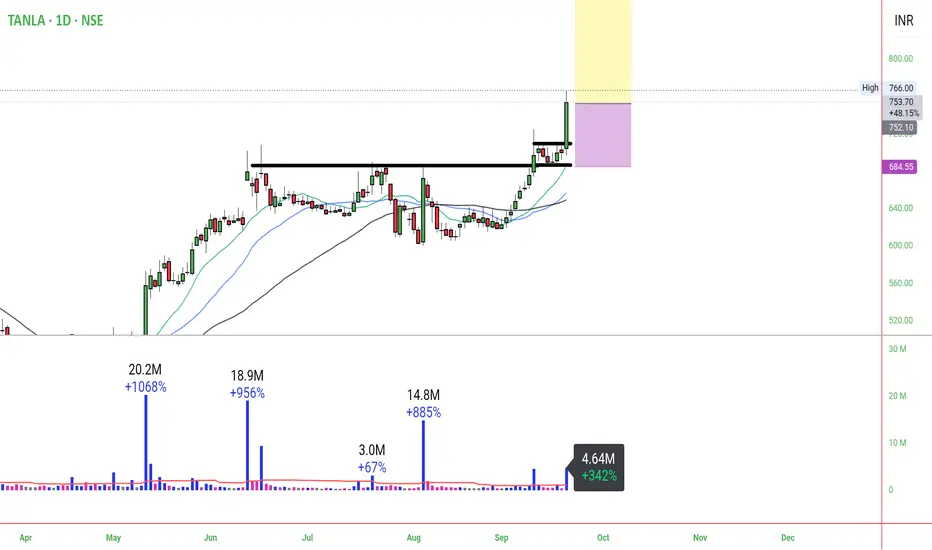
Cup & Handle Breakout in TANLA
BUY TODAY SELL TOMORROW for 5%

#AJMERA - VCP BreakOut in Daily Time Frame Script: AJMERA
Key highlights: 💡⚡
📈 VCP BreakOut in Daily Time Frame
📈 Volume spike during Breakout
📈 MACD Crossover
📈 Can go for a swing trade
BUY ONLY ABOVE 1055 DCB
⏱️ C.M.P 📑💰- 1052
🟢 Target 🎯🏆 – 15%
⚠️ Stoploss ☠️🚫 – 7.50%
⚠️ Important: Market conditions are Okish, Position size 50% per Trade. Protect Capital Always
⚠️ Important: Always Exit the trade before any Event.
⚠️ Important: Always maintain your Risk:Reward Ratio as 1:2, with this RR, you only need a 33% win rate to Breakeven.
✅Like and follow to never miss a new idea!✅
Disclaimer: I am not SEBI Registered Advisor. My posts are purely for training and educational purposes.
Eat🍜 Sleep😴 TradingView📈 Repeat 🔁
Happy learning with MMT. Cheers!🥂
CENTURYPLY : Swing Pick#CENTURYPLY #swingtrade #swingtrading #trendingstock
CENTURYPLY : Swing trade
>> Breakout Soon
>> Trending Stock
>> Good Strength & Volumes
>> Low Risk Setup
Swing Traders can lock profit at 10% and keep Trailing
Please Boost, comment and follow us for more Learnings.
Disc : Charts shared are for learning purpose only, not a Trade recommendation. Do your own research and consult your financial advisor before taking any position.

BUY TODAY SELL TOMORROW for 5%DON’T HAVE TIME TO MANAGE YOUR TRADES?
- Take BTST trades at 3:25 pm every day
- Try to exit by taking 4-7% profit of each trade
- SL can also be maintained as closing below the low of the breakout candle
Now, why do I prefer BTST over swing trades? The primary reason is that I have observed that 90% of the stocks give most of the movement in just 1-2 days and the rest of the time they either consolidate or fall
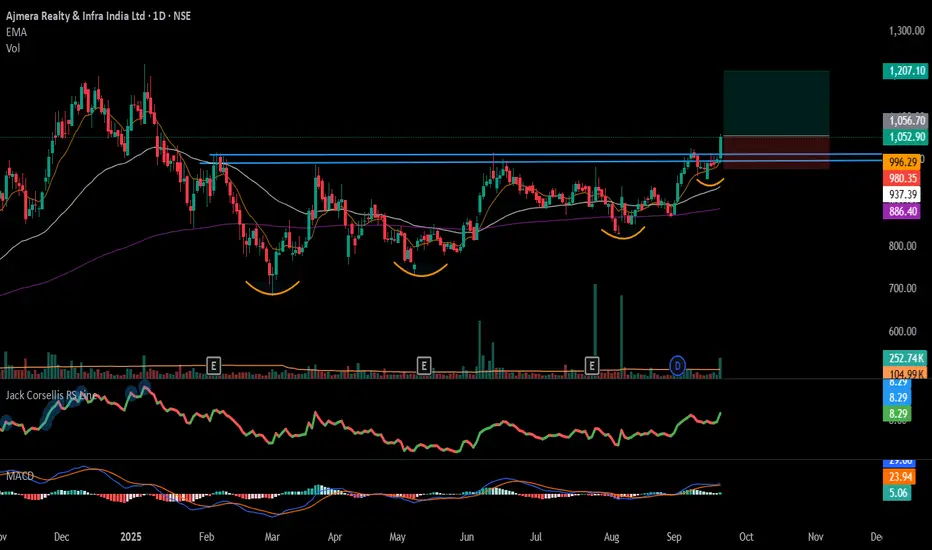
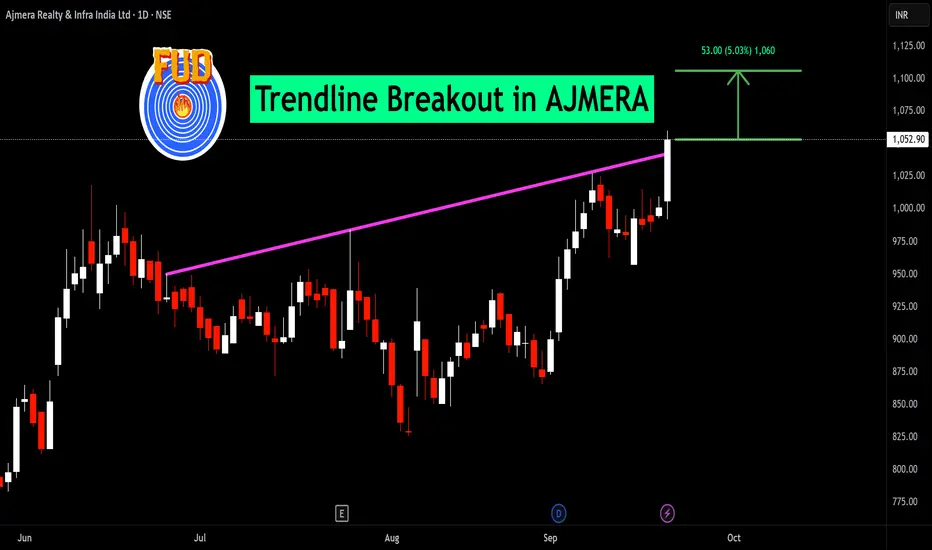
Trendline Breakout in AJMERA
BUY TODAY SELL TOMORROW for 5%
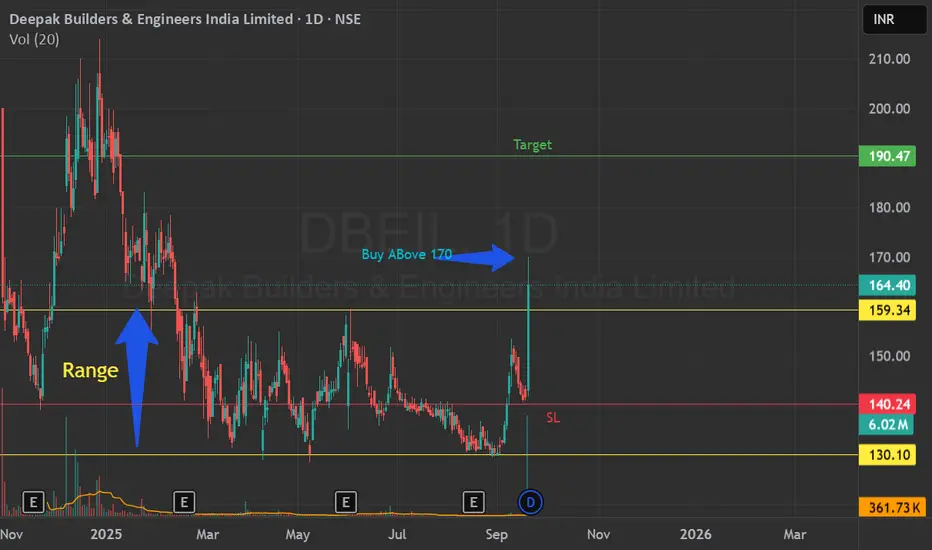
Range breakout, Partial entry as not a good Risk reward ratioRange breakout
Only partial entry now
Can average if price gets any retracement before reaching the target
The target was as equal as the range movement
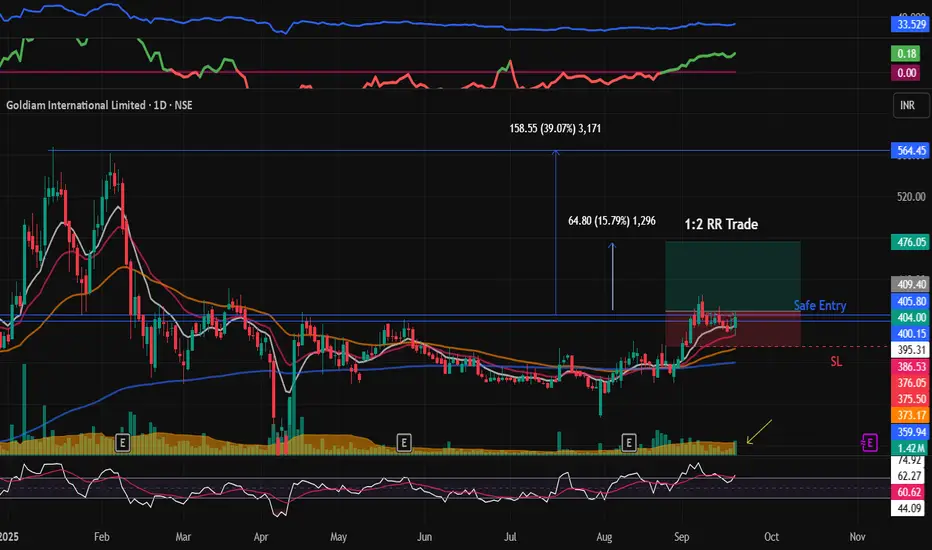
GOLDIAM : Breakout Stock#GOLDIAM #breakoutstock #trendingstock #lowRiskHighRewardTrade
GOLDIAM : Swing Trade / Short term
>> Breakout Trading
>> Breakout with Volume
>> Trending stock
>> Strength building up
>> Low Risk High Reward Trade
Swing Traders can look for 1:2 RR Trade, While Short term Traders can hold patiently for higher Targets
Swing Traders can lock profit at 10% and keep Trailing
Please Boost, comment and follow us for more Learnings.
Disc : Charts shared are for learning purpose only, not a Trade recommendation. Do your own research and consult your financial advisor before taking any position.
BUY TODAY SELL TOMORROW for 5%DON’T HAVE TIME TO MANAGE YOUR TRADES?
- Take BTST trades at 3:25 pm every day
- Try to exit by taking 4-7% profit of each trade
- SL can also be maintained as closing below the low of the breakout candle
Now, why do I prefer BTST over swing trades? The primary reason is that I have observed that 90% of the stocks give most of the movement in just 1-2 days and the rest of the time they either consolidate or fall
Cup and Handle Breakout in BAJAJCON
BUY TODAY SELL TOMORROW for 5%

LAURUSLABS : Breakout Stock#LAURUSLABS #vcppattern #vcpbreakout #breakoutstock #trendingstock
LAURUSLABS : Swing Trade / Short Term
>> Rally - Base - now ready for RAlly
>> Base = Beautiful Vcp pattern
>> VCP pattern Breakout with Volumes
>> Trending stock in Momentum
>> Good Strength & Volumes
Swing Traders can lock profit at 10% and keep Trailing
Please Boost, comment and follow us for more Learnings.
Disc : Charts shared are for learning purpose only, not a Trade recommendation. Do your own research and consult your financial advisor before taking any position.

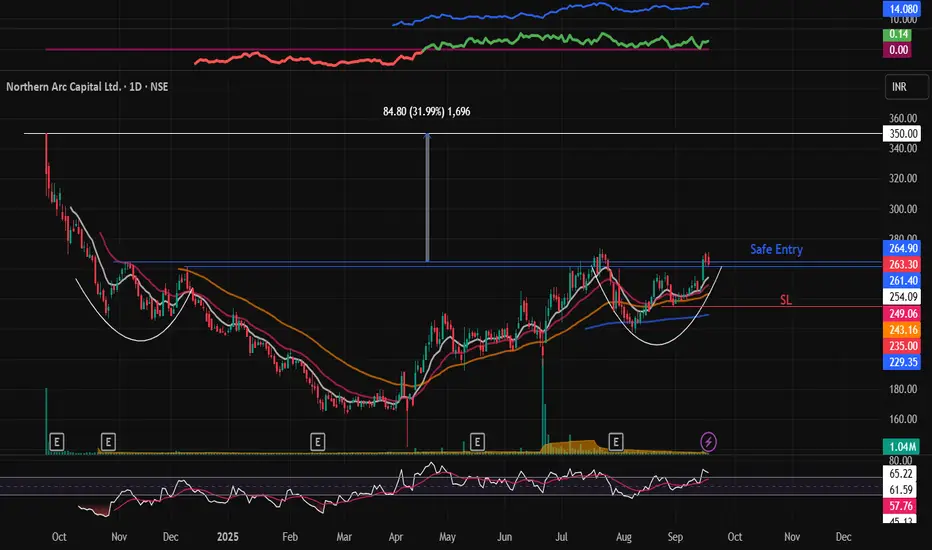
NORTHARC : Swing pick#NORTHARC #patterntrading #chartpattern #inverseheadandshoulder #breakoutstock #swingtrade #trendingstock
NORTHARC :
>> Low PE Stock
>> Chart pattern Trading
>> Inverse Head & Shoulder pattern
>> Volumes Building up
>> Stock showing strength
Swing Traders can lock profit at 10% and keep Trailing
Please Boost, comment and follow us for more Learnings.
Disc : Charts shared are for learning purpose only, not a Trade recommendation. Do your own research and consult your financial advisor before taking any position.
HYUNDAI : Breakout stock (Swing pick)#HYUNDAI #swingtrade #momentumtrade #breakoutstock #trendingstock
HYUNDAI : Swing trade
>> Breakout with Volume
>> Trending Stock
>> Momentum Trade
>> Volatility contraction seen
>> Good Strength in Stock
Swing Traders can lock profit at 10% and keep Trailing
Please Boost, comment and follow us for more Learnings.
Disc : Charts shared are for learning purpose only, not a Trade recommendation. Do your own research and consult your financial advisor before taking any position.

BUY TODAY SELL TOMORROW for 5%DON’T HAVE TIME TO MANAGE YOUR TRADES?
- Take BTST trades at 3:25 pm every day
- Try to exit by taking 4-7% profit of each trade
- SL can also be maintained as closing below the low of the breakout candle
Now, why do I prefer BTST over swing trades? The primary reason is that I have observed that 90% of the stocks give most of the movement in just 1-2 days and the rest of the time they either consolidate or fall
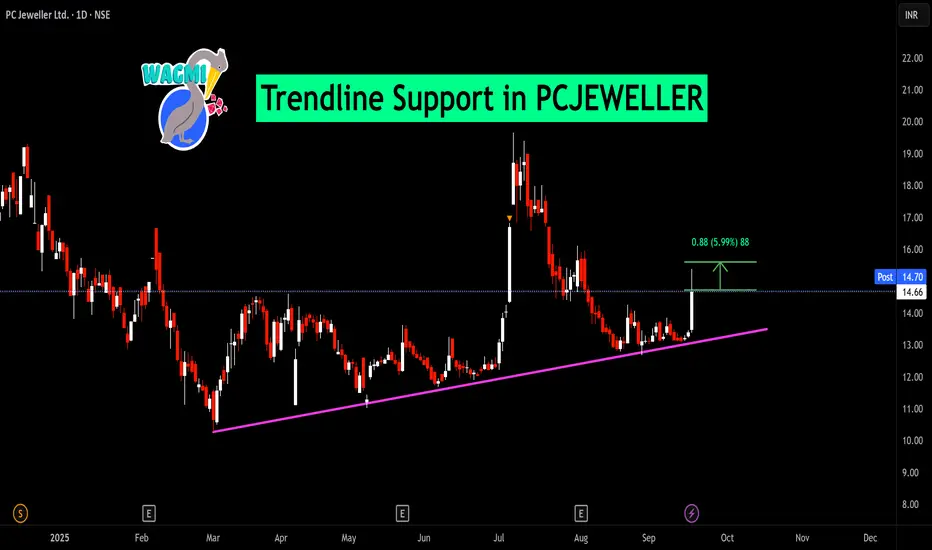
Trendline Support in PCJEWELLER
BUY TODAY SELL TOMORROW for 5%
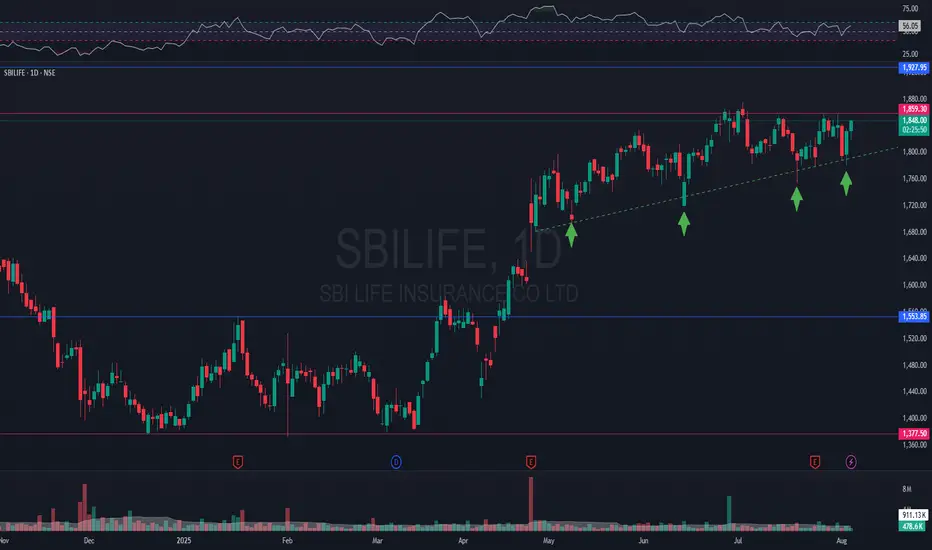
Ascending Triangle Breakout on #SBILIFE#SBILIFE is showing clear signs of a strong breakout from current levels.
The ascending trendline has supported the price since 09MAY25. The price continued to hold near the levels of 1855, with every red candle bought in.
Yesterday, i.e. 04AUG15 was a good day to initiate accumulation. In our view, price is expected to move sharply once the daily/weekly candle closes above 1860 with supporting volumes.
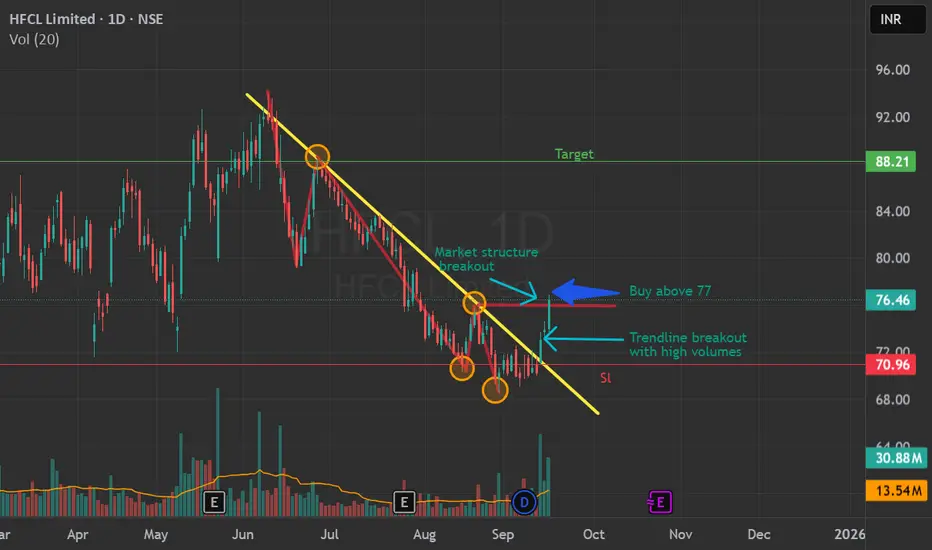
Trendline Breakout and Markt Strctr BreakoutA clear trendline has broken with huge volumes
Market structure of lower lows and lower highs was broken
Price can touch the high of the trendline
Follow with strict target and stoploss
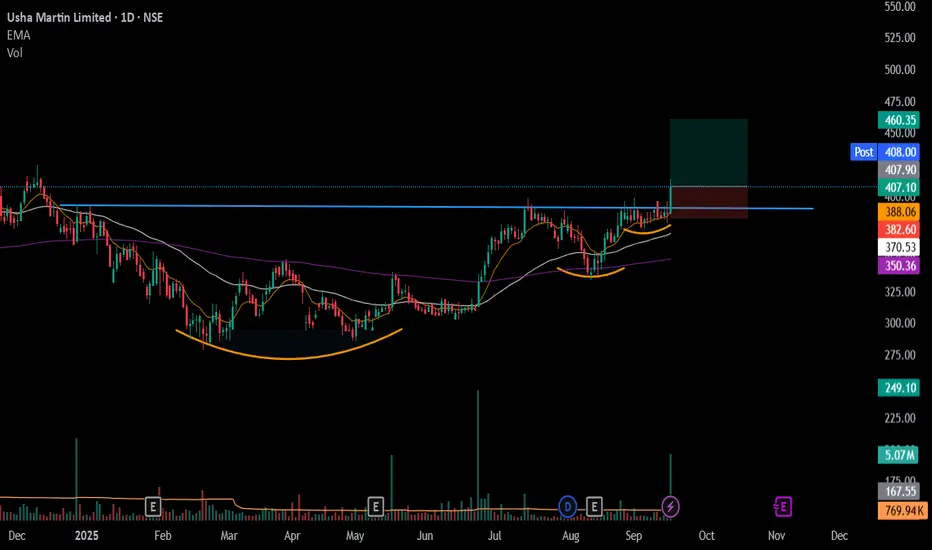
#USHAMART - VCP BreakOut in Daily Time Frame Script: USHAMART
Key highlights: 💡⚡
📈 VCP BreakOut in Daily Time Frame
📈 Price consolidated near Resistance before BO
📈 Volume spike during Breakout
📈 MACD Crossover
📈 Stock is near ATH
📈 Can go for a swing trade
BUY ONLY ABOVE 410 DCB
⏱️ C.M.P 📑💰- 407
🟢 Target 🎯🏆 – 12.90%
⚠️ Stoploss ☠️🚫 – 6.20%
⚠️ Important: Market conditions are Okish, Position size 50% per Trade. Protect Capital Always
⚠️ Important: Always Exit the trade before any Event.
⚠️ Important: Always maintain your Risk:Reward Ratio as 1:2, with this RR, you only need a 33% win rate to Breakeven.
✅Like and follow to never miss a new idea!✅
Disclaimer: I am not SEBI Registered Advisor. My posts are purely for training and educational purposes.
Eat🍜 Sleep😴 TradingView📈 Repeat 🔁
Happy learning with MMT. Cheers!🥂
Bajaj Housing finance trendline breakout soonBajaj Housing fin, gonna give a breakout soon, it is around it’s support and is suppose to give a long trend line breakout with 10% upside in short term
Buy around - 115-117
Target - 128
Duration - 1-2 months

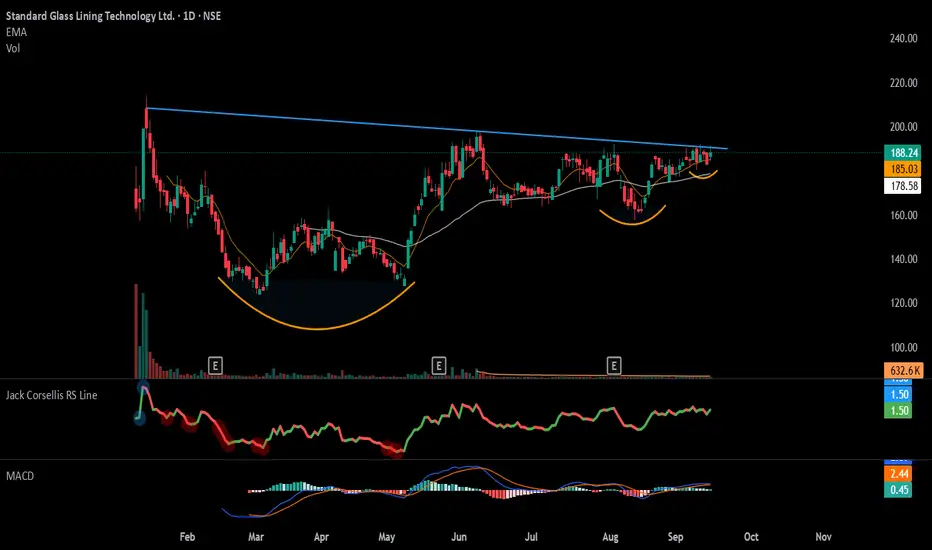
#SGLTL - IPO Base / VCP Set up in DTF Script: SGLTL
Key highlights: 💡⚡
📈 IPO Base set up in Daily Time Frame
📈 Wait for Volume spike during Breakout
📈 VCP Set up in DTF also
📈 Can go for a swing trade
BUY ONLY ABOVE 196 DCB
⏱️ C.M.P 📑💰- 185
🟢 Target 🎯🏆 – NA%
⚠️ Stoploss ☠️🚫 – NA%
⚠️ Important: Market conditions are Okish, Position size 50% per Trade. Protect Capital Always
⚠️ Important: Always Exit the trade before any Event.
⚠️ Important: Always maintain your Risk:Reward Ratio as 1:2, with this RR, you only need a 33% win rate to Breakeven.
✅Like and follow to never miss a new idea!✅
Disclaimer: I am not SEBI Registered Advisor. My posts are purely for training and educational purposes.
Eat🍜 Sleep😴 TradingView📈 Repeat 🔁
Happy learning with MMT. Cheers!🥂
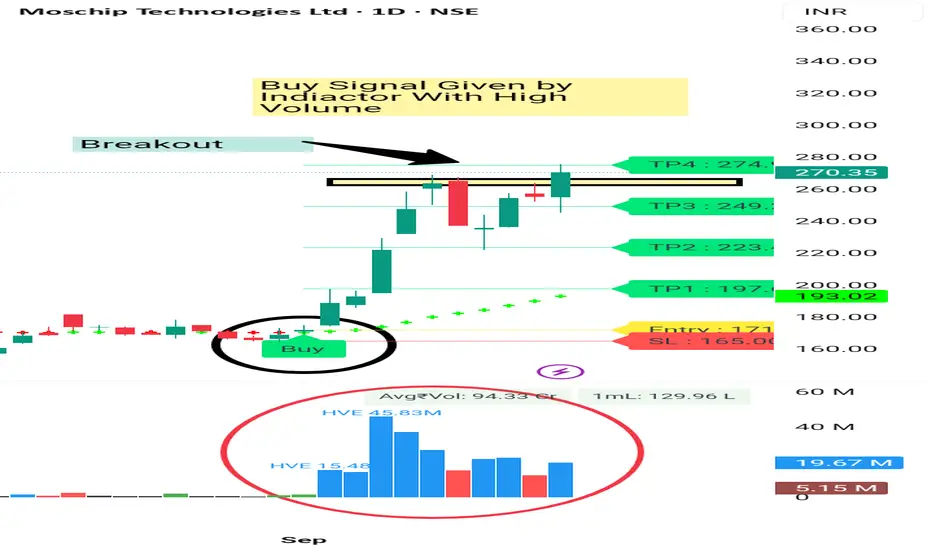
MOSCHIP BREAKOUT with Heavy Volume moschip is Given Decent Movement in past with High Volume. And now it's given good Breakout with Bullish Englulfing Candle. It's a Clear Breakout and it can give 5 -8% Quick movement from here . Keep SL 5%
Consult your financial advisor before making any position in stock market.
For More information. Visit my Tradingview Profile.
Always Trade with Stoploss.
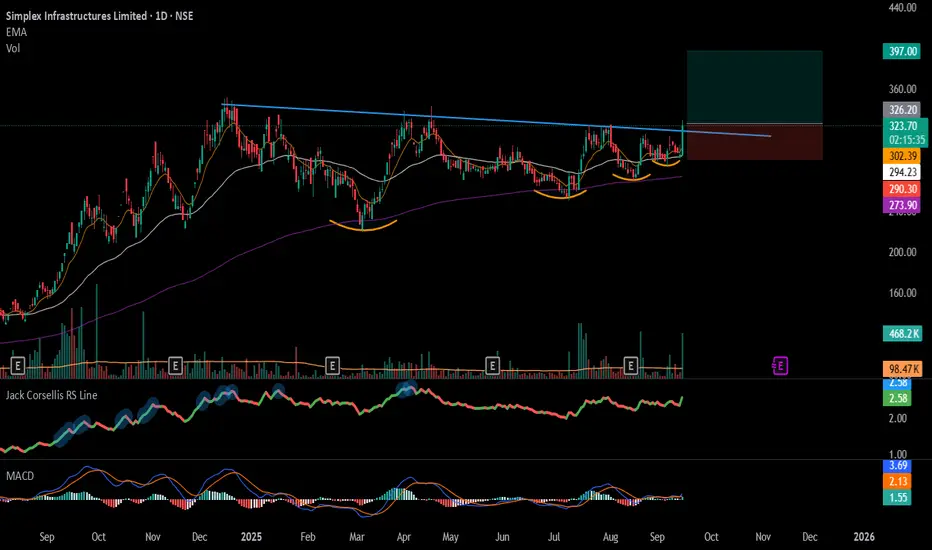
#SIMPLEXINF - TrendLine Breakout in Daily Time FrameScript: SIMPLEXINF
Key highlights: 💡⚡
📈 TrendLine Breakout in Daily Time Frame
📈 Volume spike during Breakout
📈 MACD Bounce
📈 Can go for a swing trade
BUY ONLY ABOVE 325 DCB
⏱️ C.M.P 📑💰- 322.25
🟢 Target 🎯🏆 – 22%
⚠️ Stoploss ☠️🚫 – 11%
⚠️ Important: Market conditions are Okish, Position size 50% per Trade. Protect Capital Always
⚠️ Important: Always Exit the trade before any Event.
⚠️ Important: Always maintain your Risk:Reward Ratio as 1:2, with this RR, you only need a 33% win rate to Breakeven.
✅Like and follow to never miss a new idea!✅
Disclaimer: I am not SEBI Registered Advisor. My posts are purely for training and educational purposes.
Eat🍜 Sleep😴 TradingView📈 Repeat 🔁
Happy learning with MMT. Cheers!🥂
BUY TODAY SELL TOMORROW for 5%DON’T HAVE TIME TO MANAGE YOUR TRADES?
- Take BTST trades at 3:25 pm every day
- Try to exit by taking 4-7% profit of each trade
- SL can also be maintained as closing below the low of the breakout candle
Now, why do I prefer BTST over swing trades? The primary reason is that I have observed that 90% of the stocks give most of the movement in just 1-2 days and the rest of the time they either consolidate or fall
Resistance Breakout in BEML
BUY TODAY SELL TOMORROW for 5%

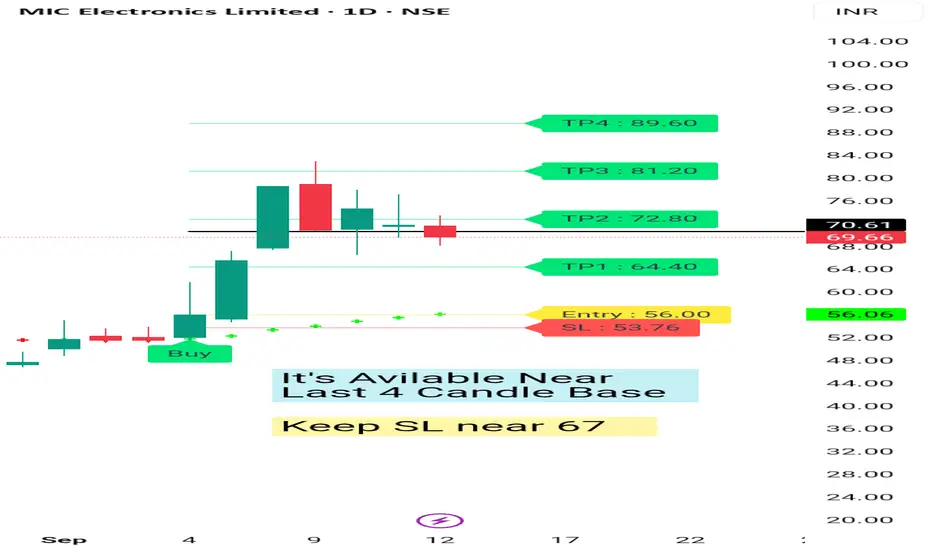
Mic Electronic Ready For Move After Retracement Mic Electronic given Buy Signal near 56 . Then it's moved to 82 .
Now again It's avilable near base level of last 4 days candle .
Keep SL 67 -66
We can Expect level of 80 , 85 -90 in next 1 -3 months max .
For more information visit my Tradingview Profile.
Consult your financial advisor before making any position in stock market. My views are for educational purposes only. Thanks 👍
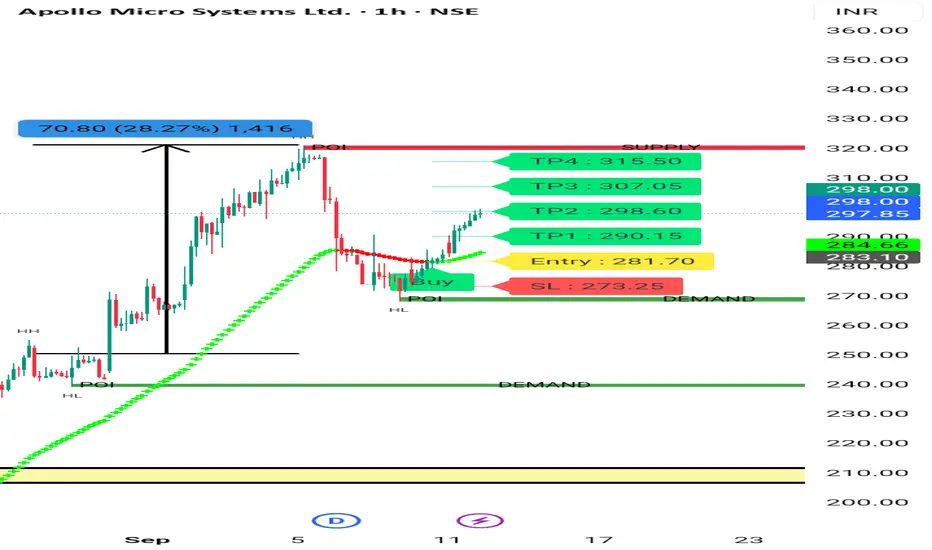
Apollo Micro System Again Upmove Apollo Micro Systems Earlier given near 250. Now Gain it's going Up after Taking Retracement. It's good sign. We can Enter at Cmp With 3 -5 % Stoploss.
It's in High Momentum.
Want to Learn more - how to Catch Such Stocks. Visit my Tradingview Profile .
Entry near 300 tgt 320 - 330 - 350 .
SL 5%
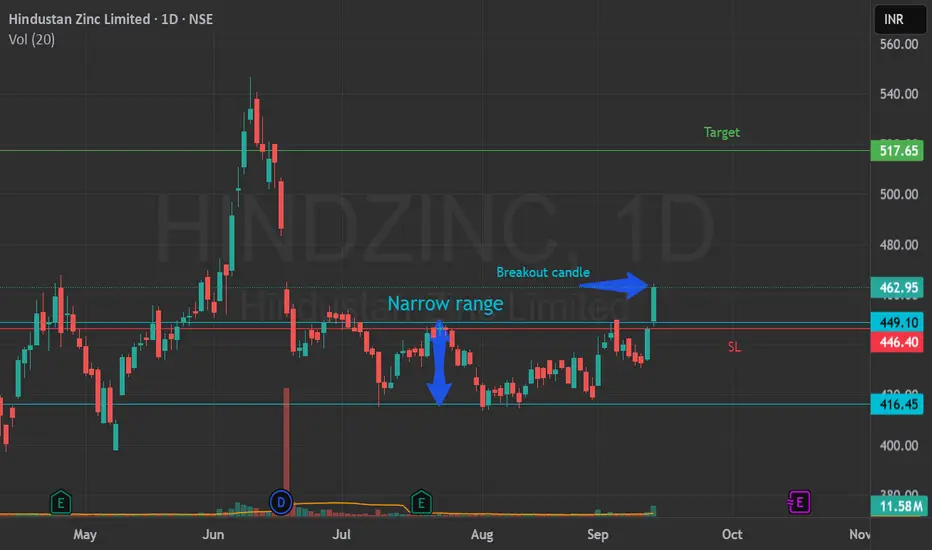
Narrow range breakout .Buy above 465A good breakout candle with high volume from narrow range could draw the price up.Follow with strict SL and target. Only for education purpose*.