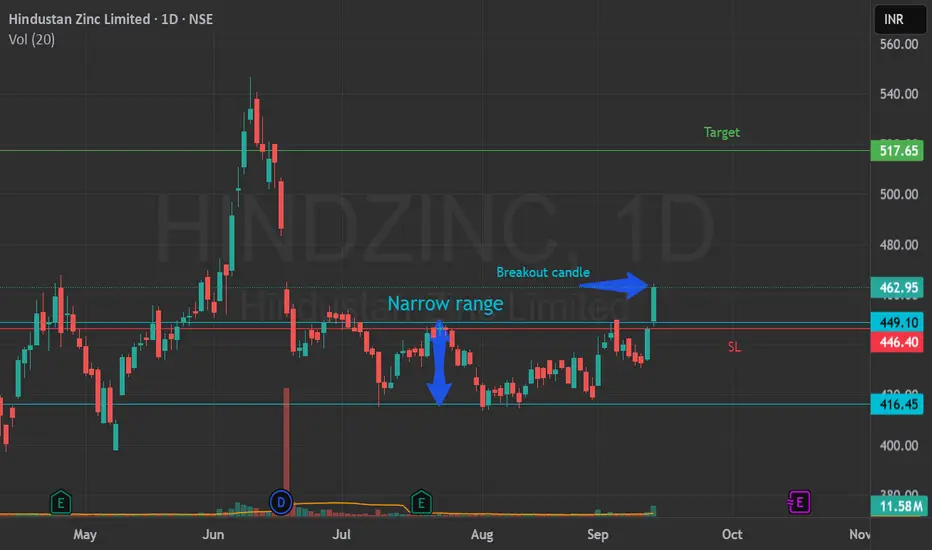
Narrow range breakout .Buy above 465A good breakout candle with high volume from narrow range could draw the price up.Follow with strict SL and target. Only for education purpose*.
Breakouttrading
Indian Metals & Ferro Alloys Ltd - Breakout Setup, Move is ON...#IMFA trading above Resistance of 640
Next Resistance is at 1008
Support is at 463
Here are previous charts:
Chart is self explanatory. Levels of breakout, possible up-moves (where stock may find resistances) and support (close below which, setup will be invalidated) are clearly defined.
Disclaimer: This is for demonstration and educational purpose only. This is not buying or selling recommendations. I am not SEBI registered. Please consult your financial advisor before taking any trade.

BUY TODAY SELL TOMORROW for 5%DON’T HAVE TIME TO MANAGE YOUR TRADES?
- Take BTST trades at 3:25 pm every day
- Try to exit by taking 4-7% profit of each trade
- SL can also be maintained as closing below the low of the breakout candle
Now, why do I prefer BTST over swing trades? The primary reason is that I have observed that 90% of the stocks give most of the movement in just 1-2 days and the rest of the time they either consolidate or fall
Resistance Breakout in STOVEKRAFT
BUY TODAY SELL TOMORROW for 5%

BUY TODAY SELL TOMORROW for 5%DON’T HAVE TIME TO MANAGE YOUR TRADES?
- Take BTST trades at 3:25 pm every day
- Try to exit by taking 4-7% profit of each trade
- SL can also be maintained as closing below the low of the breakout candle
Now, why do I prefer BTST over swing trades? The primary reason is that I have observed that 90% of the stocks give most of the movement in just 1-2 days and the rest of the time they either consolidate or fall
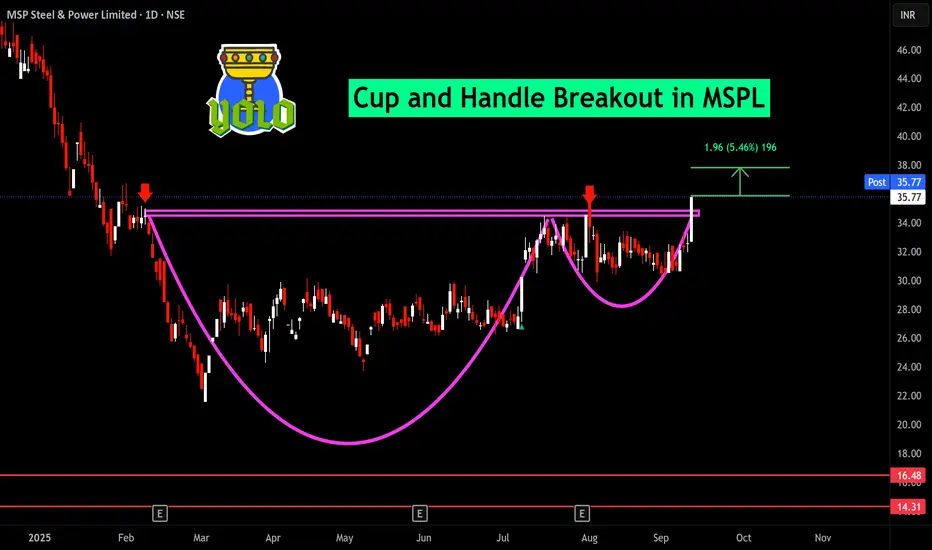
Cup and Handle Breakout in MSPL
BUY TODAY SELL TOMORROW for 5%
BUY TODAY SELL TOMORROW for 5%DON’T HAVE TIME TO MANAGE YOUR TRADES?
- Take BTST trades at 3:25 pm every day
- Try to exit by taking 4-7% profit of each trade
- SL can also be maintained as closing below the low of the breakout candle
Now, why do I prefer BTST over swing trades? The primary reason is that I have observed that 90% of the stocks give most of the movement in just 1-2 days and the rest of the time they either consolidate or fall
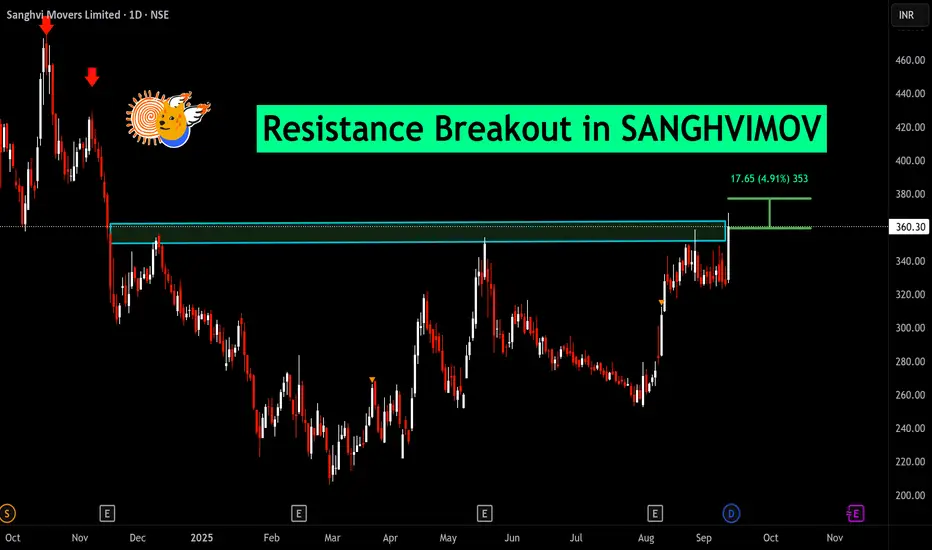
Resistance Breakout in SANGHVIMOV
BUY TODAY SELL TOMORROW for 5%
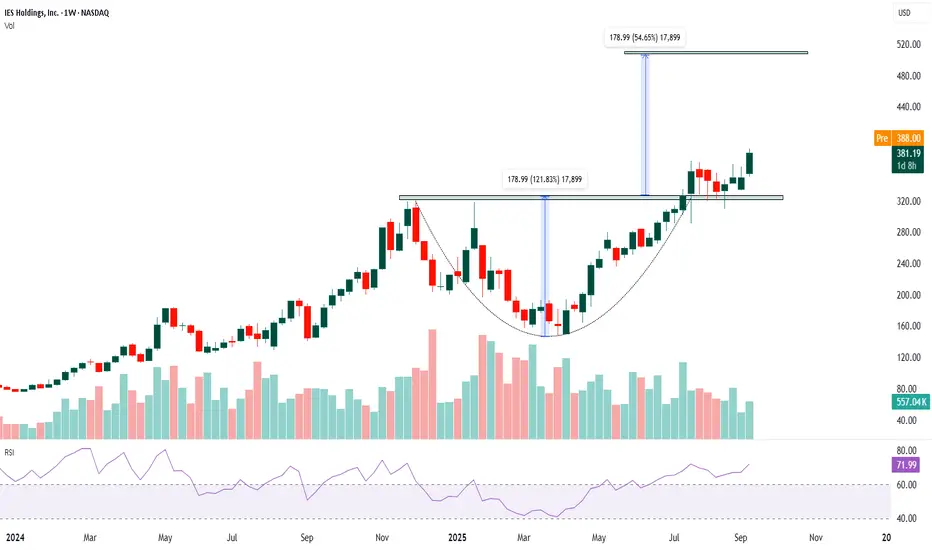
IESC- Long The chart shows a clear uptrend over the past year.
Price formed a rounded bottom (cup-shaped base) and has broken above the neckline near $320–$330, confirming a bullish continuation pattern. Current price around $381 indicates sustained bullish strength.
Volume rose meaningfully during the breakout above $330, confirming the validity of the breakout. Prior to the breakout, volume was lower during consolidation, which is typical before a strong move.
Cup and Handle breakout confirmed above $330 neckline.
Current breakout is clean, backed by momentum and volume.
The stock is in a confirmed uptrend, backed by strong momentum and volume. Best strategy: Buy on dips near $340–$350 or add above $390–$400 with confirmation. Targets: $450 short-term, $500–$520 long-term. Maintain disciplined stop-loss placement to manage risk.
BUY TODAY SELL TOMORROW for 5%DON’T HAVE TIME TO MANAGE YOUR TRADES?
- Take BTST trades at 3:25 pm every day
- Try to exit by taking 4-7% profit of each trade
- SL can also be maintained as closing below the low of the breakout candle
Now, why do I prefer BTST over swing trades? The primary reason is that I have observed that 90% of the stocks give most of the movement in just 1-2 days and the rest of the time they either consolidate or fall
Trendline Breakout in SMSPHARMA
BUY TODAY SELL TOMORROW for 5%

GMDC Breakout GMDC BREAKOUT on 45 min and 1 hrs. Gmdc is in good Momentum. It's can give another 4 -5% movement easily. It can be achieve 580 tgt easily. It's already moved good.
Now keep trial SL and Enjoy Journey.
Buy was given near 426.
Tgt 580 - 600
Consult your financial advisor before making any position in stock market. My all views are for educational purposes only.
Visit my profile for more information

BUY TODAY SELL TOMORROW for 5%DON’T HAVE TIME TO MANAGE YOUR TRADES?
- Take BTST trades at 3:25 pm every day
- Try to exit by taking 4-7% profit of each trade
- SL can also be maintained as closing below the low of the breakout candle
Now, why do I prefer BTST over swing trades? The primary reason is that I have observed that 90% of the stocks give most of the movement in just 1-2 days and the rest of the time they either consolidate or fall
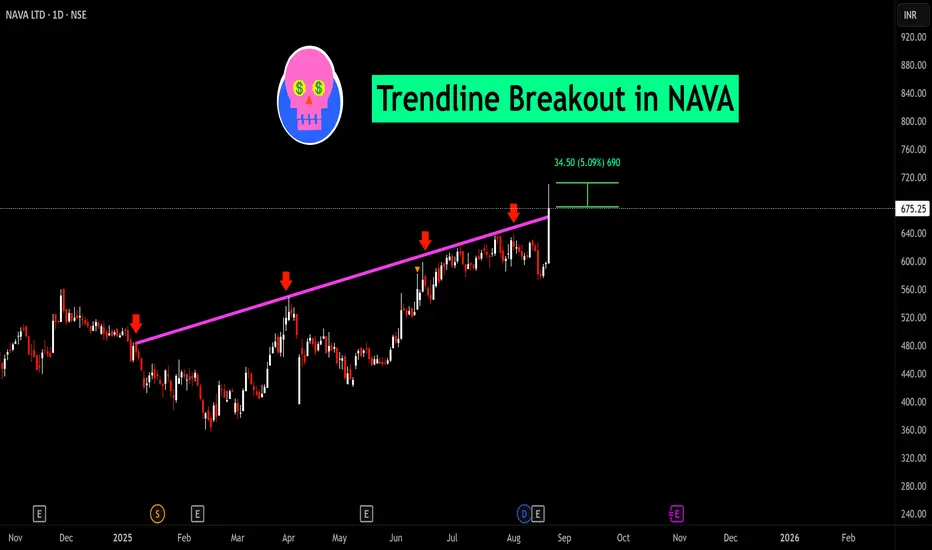
Trendline Breakout in NAVA
BUY TODAY SELL TOMORROW for 5%
BUY TODAY SELL TOMORROW for 5%DON’T HAVE TIME TO MANAGE YOUR TRADES?
- Take BTST trades at 3:25 pm every day
- Try to exit by taking 4-7% profit of each trade
- SL can also be maintained as closing below the low of the breakout candle
Now, why do I prefer BTST over swing trades? The primary reason is that I have observed that 90% of the stocks give most of the movement in just 1-2 days and the rest of the time they either consolidate or fall
Trendline support in APOLLO
BUY TODAY SELL TOMORROW for 5%

BUY TODAY SELL TOMORROW for 5%DON’T HAVE TIME TO MANAGE YOUR TRADES?
- Take BTST trades at 3:25 pm every day
- Try to exit by taking 4-7% profit of each trade
- SL can also be maintained as closing below the low of the breakout candle
Now, why do I prefer BTST over swing trades? The primary reason is that I have observed that 90% of the stocks give most of the movement in just 1-2 days and the rest of the time they either consolidate or fall
Trendline Breakout in JTEKTINDIA
BUY TODAY SELL TOMORROW for 5%

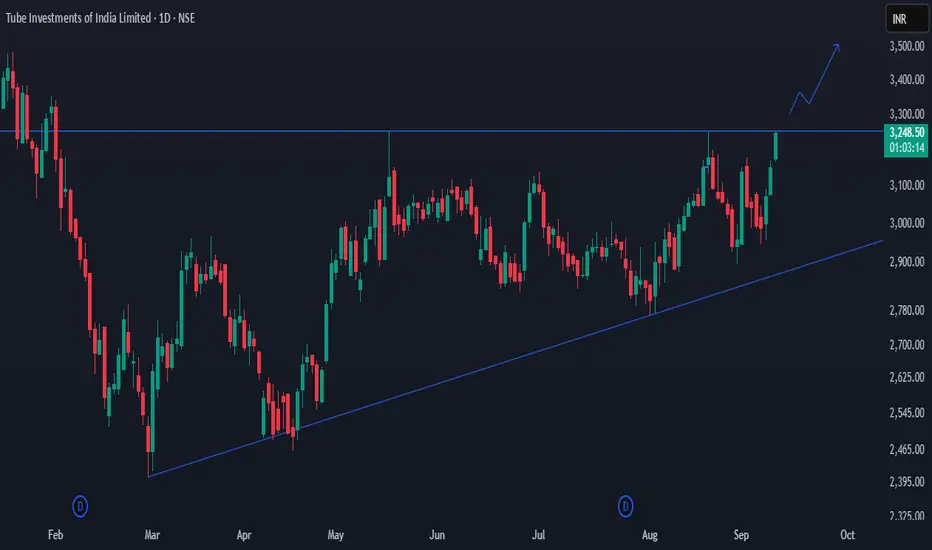
Breakout ready stock - TIINDIATube Investments of India is pressing against a flat resistance near 3,250–3,270 while making higher lows since March–April, forming a classic ascending triangle; a strong daily close above 3,270–3,300 with good volume would confirm the breakout, after which a conservative upside looks toward 3,450–3,500, then 3,800–3,850, and a full measured move can stretch to 3,950–4,000, whereas on the downside a healthy retest can dip to 3,150–3,170, with the pattern staying valid as long as the rising trendline/3,030 area holds and turning weak only on a decisive break below 2,900.
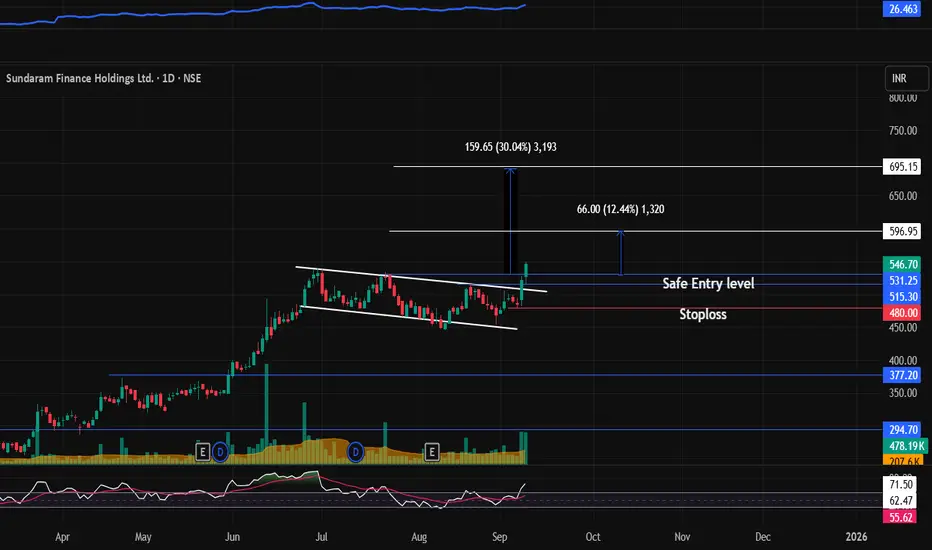
SUNDARMHLD : Breakout stock (Swing pick)#SUNDARMHLD #flagbreakout #breakoutstock #channelbreakout #swingtrading #momentumtrading
SUNDARMHLD : Swing / Short term (1-3 months)
>> Flag Breakout or Channel Breakout
>> Good Strength in stock
>> Volumes picking up
>> Low PE Stock
>> Swing Traders can Look for 10-12% Levels & Short term traders can go for Higher Levels
>> Enter at Retracement
Swing Traders can lock profit at 10% and keep Trailing
Please Boost, comment and follow us for more Learnings
Disc : Charts shared are for learning purpose only, not a Trade recommendation. Do your own research and consult your financial advisor before taking any position.
BUY TODAY SELL TOMORROW for 5%DON’T HAVE TIME TO MANAGE YOUR TRADES?
- Take BTST trades at 3:25 pm every day
- Try to exit by taking 4-7% profit of each trade
- SL can also be maintained as closing below the low of the breakout candle
Now, why do I prefer BTST over swing trades? The primary reason is that I have observed that 90% of the stocks give most of the movement in just 1-2 days and the rest of the time they either consolidate or fall
Resistance Breakout in ZOTA
BUY TODAY SELL TOMORROW for 5%

BUY TODAY SELL TOMORROW for 5%DON’T HAVE TIME TO MANAGE YOUR TRADES?
- Take BTST trades at 3:25 pm every day
- Try to exit by taking 4-7% profit of each trade
- SL can also be maintained as closing below the low of the breakout candle
Now, why do I prefer BTST over swing trades? The primary reason is that I have observed that 90% of the stocks give most of the movement in just 1-2 days and the rest of the time they either consolidate or fall
Resistance Breakout in STYLAMIND
BUY TODAY SELL TOMORROW for 5%

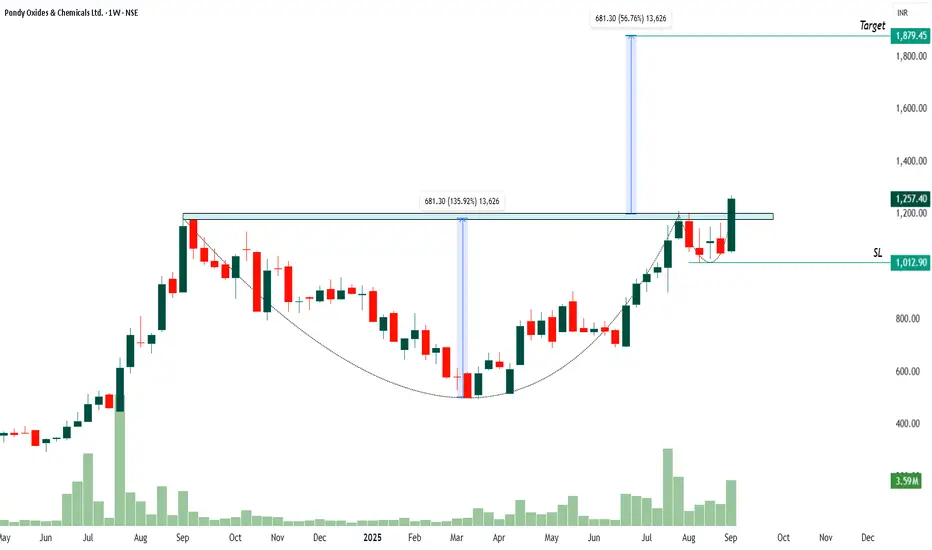
POCL - Cup and Handle - LongThe price has formed a classic “cup and handle” pattern, breaking above the resistance zone near ₹1,050–₹1,200, which previously acted as a ceiling for over a year. This breakout is confirmed by strong volume, indicating robust buying interest.
The level of ₹1,012.90 is marked as support and potential stop loss (SL). A close below this level would invalidate the breakout, making it a logical point for risk management.
Based on the height of the cup and handle pattern (approx. ₹680 from base to breakout), the projected target is around ₹1,879.45, suggesting a potential 50%+ upside from the current breakout level.
Notice the rising volume bars during the breakout, which give confidence that this move is backed by real market strength, not just price manipulation.
Above ₹1,200, the setup favors long positions toward ₹1,870, following the classic chart breakout principles. Strict stop loss (SL) at ₹1,013 is advised to protect capital in case the breakout fails.
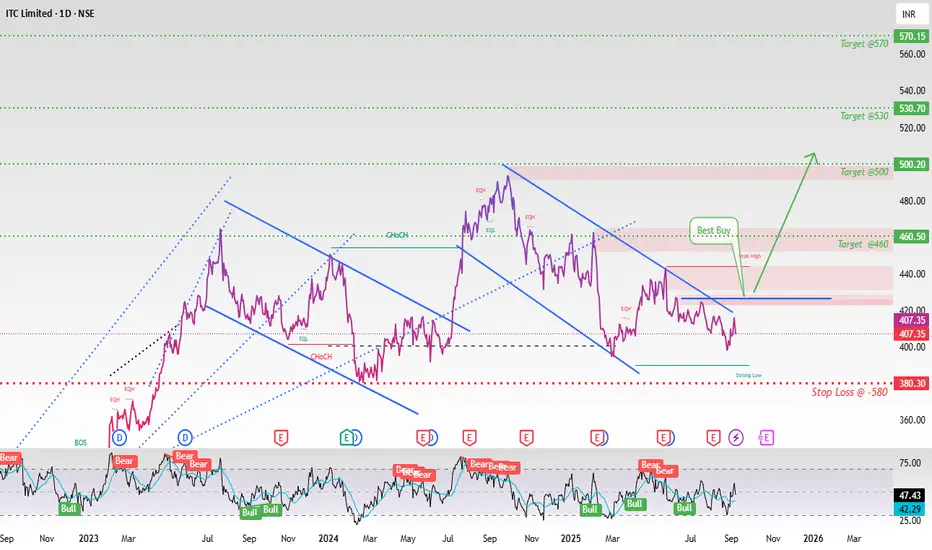
ITC Ltd – Trade IdeaNSE:ITC
ITC Ltd – Trade Idea
Recommendation : BUY
Entry Level : Above ₹425+
Stop Loss : Below support zone of **₹480**
Target Levels : ₹460 / ₹500 / ₹530 / ₹570
---
**Technical Rationale* *
* ITC is forming a **Flag & Pole pattern**, a bullish continuation setup indicating potential for further upside once the consolidation ends.
* Sustaining above ₹425 will likely confirm the breakout, opening room for higher targets.
* Support is well-placed near ₹480; holding this level keeps the bullish momentum intact.
---
**Fundamental Snapshot**
* **P/E Ratio**: \~14.92 – attractive compared to FMCG peers, suggesting reasonable valuation.
* Diversified business model across Cigarettes, FMCG, Hotels, Paper & Agri.
* Strong balance sheet with robust cash flows and healthy dividend payout.
---
**Outlook**
The confluence of **bullish technical structure (flag & pole)** and **comfortable valuations** makes ITC a favorable candidate for **swing to positional trades**.
Risk is well-defined with support near ₹480, while upside potential remains strong toward ₹570 levels.
---
Thanks & Happy Trading
Disclaimer:
This idea is only for educational purposes,
Please Trade at your own RISK''
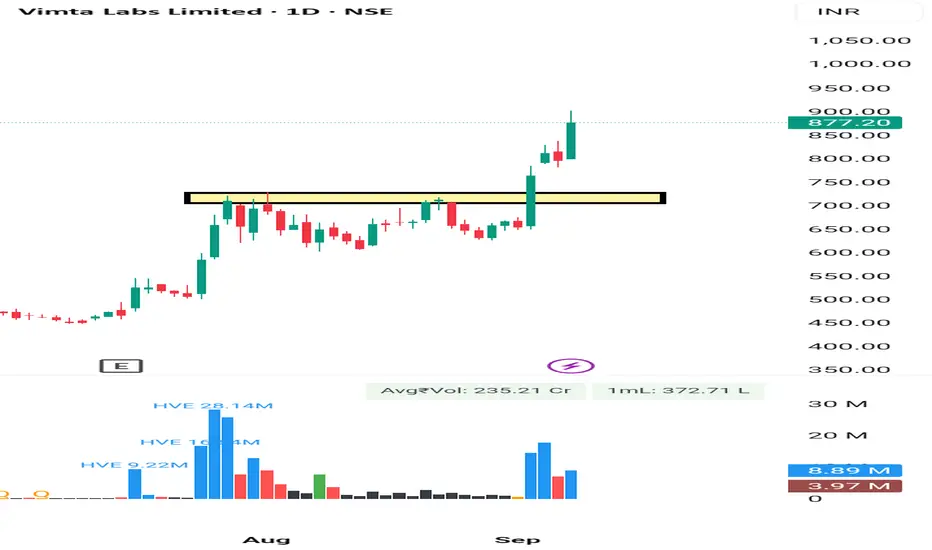
Vimta Lab Rounding Pattern Breakout Vimta Lab given Rounding Pattern Breakout on 1 Day as well as on 1 Week . It's a good movement after a good consolidation phase of 1 Month Approx . It may move 10 -15% Easily .
Entry Was Near 730
SL 5%
Tgt - Trial Basis . No body knows . Kitna Up jayega. So. Trail SL.
Consult your financial advisor before making any position in stock market.
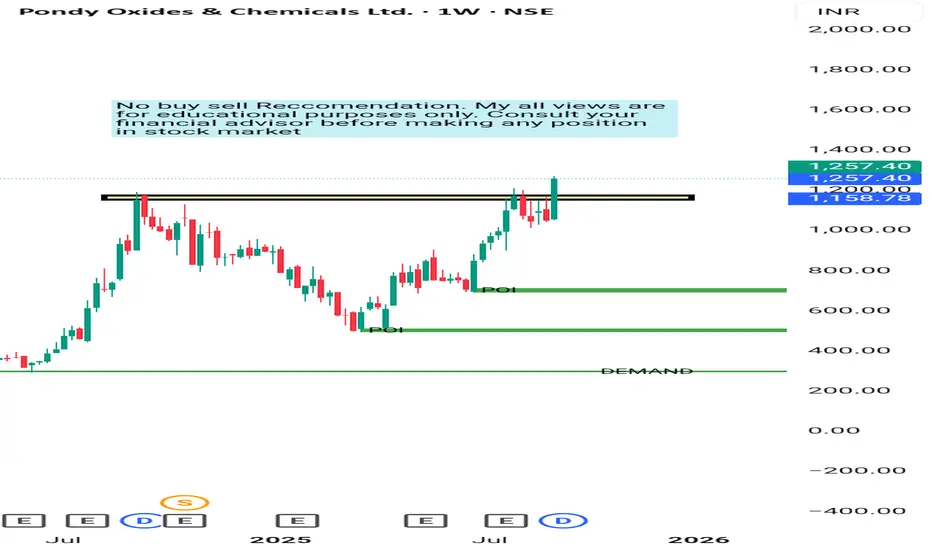
POCL Weekly BREAKOUT For More information Visit my Tradingview Profile .
POCL Given a Rounding Bottom Pattern Breakout on weekly as well as on 1 day chart with good volumes . Company belongs to metal sector and metal sector in uptrend. So we can see 5 -10% good movement from here also in swing trading/holding for some days . 10 - 30 days . Keep Stoploss 5 -6% .
Incorporated in 1995, Pondy Oxides and Chemicals Ltd manufactures Lead Metal and Alloys and other Non-ferrous metals
Key Points
Business Overview:
POCL is in the metallic and non-metallic recycling industry as India’s largest secondary Lead manufacturer in Lead Alloys. Its core product, lead and lead alloys, is mainly used in making lead-acid batteries. Company converts scraps of various forms of Lead, Aluminium, and Copper into Lead Metal, Aluminium Metal, Copper, and its Alloys. It carries out smelting of Lead Battery scrap to produce secondary lead metal, which is further transformed into Pure lead and Specific Lead Alloys. Further, company also manufactures Zinc metal and Zinc Oxide.
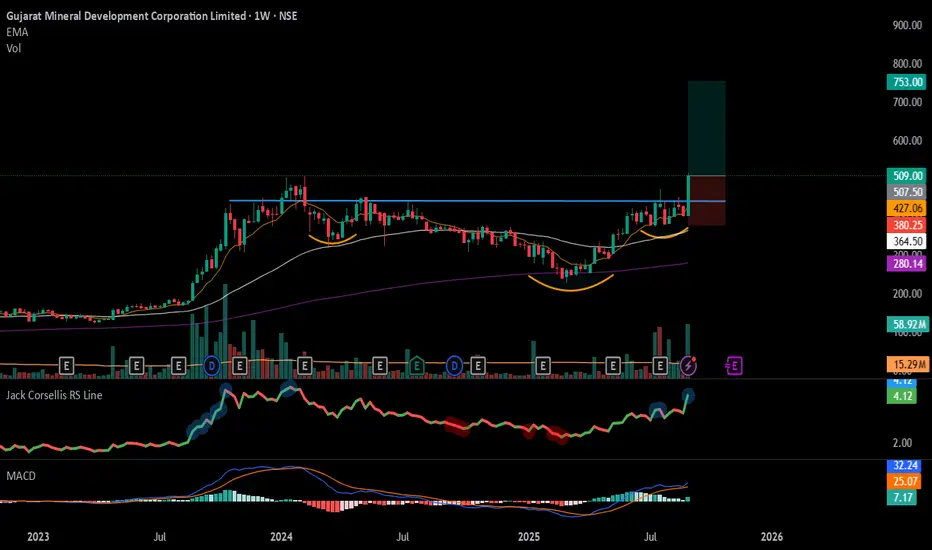
#GMDCLTD - Inverse H&S Breakout in Weekly Time Frame Script: GMDCLTD
Key highlights: 💡⚡
📈 Inverse Head & Shoulders Breakout in Weekly Time Frame
📈 Volume spike during Breakout
📈 MACD Bounce
📈 Can go for a swing trade
BUY ONLY ABOVE 507 DCB
⏱️ C.M.P 📑💰- 509
🟢 Target 🎯🏆 – 50%
⚠️ Stoploss ☠️🚫 – 25%
⚠️ Important: Market conditions are Okish, Position size 50% per Trade. Protect Capital Always
⚠️ Important: Always Exit the trade before any Event.
⚠️ Important: Always maintain your Risk:Reward Ratio as 1:2, with this RR, you only need a 33% win rate to Breakeven.
✅Like and follow to never miss a new idea!✅
Disclaimer: I am not SEBI Registered Advisor. My posts are purely for training and educational purposes.
Eat🍜 Sleep😴 TradingView📈 Repeat 🔁
Happy learning with MMT. Cheers!🥂
SAGAR CEMENT BULLISH CHART DON'T HAVE TIME TO MANAGE YOUR TRADES?
Sagar Cement given good breakout. Its given breakout after good consolidation. It's given breakout after rounding pattern . We can see 5 -6% Upmove easily.
Take BTST trades at 3:25 pm every day
Try to exit by taking 4-7% profit of each trade
SL can also be maintained as closing below the low of the breakout candle
Now, why do I prefer BTST over swing trades? The primary reason is that I have observed that 90% of the stocks give most of the movement in just 1-2 days and the rest of the time they either consolidate or fall
Trendline Breakout in SAGCEM
BUY TODAY SELL TOMORROW for 5%

BUY TODAY SELL TOMORROW for 5%DON’T HAVE TIME TO MANAGE YOUR TRADES?
- Take BTST trades at 3:25 pm every day
- Try to exit by taking 4-7% profit of each trade
- SL can also be maintained as closing below the low of the breakout candle
Now, why do I prefer BTST over swing trades? The primary reason is that I have observed that 90% of the stocks give most of the movement in just 1-2 days and the rest of the time they either consolidate or fall
Resistance Breakout in ZYDUSWELL
BUY TODAY SELL TOMORROW for 5%
