BRITANNIA - Falling Wedge + Bullish Engulfing Combo💹 Britannia Industries Ltd (NSE: BRITANNIA)
Sector: FMCG | CMP: ₹5,892.50 | View: Falling Wedge + Bullish Engulfing Reversal Setup
📊 Price Action:
Britannia is currently displaying a strong confluence setup where both a chart pattern and a candlestick pattern align perfectly to signal a potential trend reversal.
After weeks of consolidation within a downward-sloping structure, the stock has formed a Falling Wedge pattern — a classic bullish reversal formation.
Adding strength to this structure, a Bullish Engulfing Candle on 4 Nov 2025 emerged from the wedge’s lower boundary, confirming buyer dominance and hinting at a near-term trend reversal.
📉 Chart Pattern Analysis – Falling Wedge (Bullish Setup):
The Falling Wedge pattern is marked by two converging downward trendlines, each connecting a series of lower highs and lower lows.
This structure reflects seller exhaustion and early buying interest.
Britannia’s wedge formation is now reaching its apex, where breakout probability is highest.
Volume contraction throughout the wedge also supports the notion that supply is drying up, preparing for a breakout above the upper trendline.
📈 Candlestick Pattern – Bullish Engulfing Confirmation:
The Bullish Engulfing Candle formed on 4 Nov 2025 precisely at the lower support line of the wedge, validating the pattern with strong timing. It represents a shift in control from sellers to buyers, with the green candle completely engulfing the prior red body. Volume expansion on that session further confirmed active participation by institutions ahead of the upcoming news catalysts. This one-day reversal candle acts as the first technical confirmation, while a breakout above the upper trendline will serve as the structural confirmation for the wedge pattern.
📏 Fibonacci Analysis:
From swing low ₹5,298 to swing high ₹5,930:
78.6% retracement @ ₹5,795 → Key reversal level defended.
61.8% retracement @ ₹5,888 → Currently reclaimed zone.
100% extension @ ₹5,930 → Short-term breakout threshold.
The Fibonacci structure aligns beautifully with the wedge’s geometry, implying that the reversal zone is complete and buyers are regaining momentum.
🧭 STWP Support & Resistance:
Resistances: ₹5,940 | ₹5,987 | ₹6,055
Supports: ₹5,825 | ₹5,775 | ₹5,710
The ₹5,775–₹5,825 range is acting as a high-confidence accumulation base, while ₹6,090–₹6,150 represents the key breakout trigger zone.
📊 STWP Volume & Technical Setup:
Volume on 4 Nov surged to 363.4K vs 248.7K average, confirming institutional interest at lower levels. VWAP recovery and improving RSI (47→52+) show that momentum is gradually returning.
MACD is approaching a bullish crossover, while Stochastic and CCI have both turned upward — all aligning with a reversal confirmation setup.
Trend Direction: UPTREND (Transitioning) | Volume Confirmation: Possible Accumulation in Progress
🧩 STWP Summary View:
Final Outlook:
Momentum: Strengthening | Pattern: Falling Wedge + Bullish Engulfing | Risk: Moderate | Volume: Increasing
Britannia’s technical structure now showcases dual confirmation — a chart pattern (Falling Wedge) supported by a candlestick reversal (Bullish Engulfing).
This confluence enhances the reliability of the reversal signal and increases the probability of an upside breakout. As long as the price holds above ₹5,825, the bias remains bullish with potential continuation toward ₹6,150–₹6,250.
⚠️ Disclosure & Disclaimer – Please Read Carefully
This analysis is for educational purposes only and should not be treated as financial or investment advice.
I am not a SEBI-registered investment adviser. All views are based on technical observations and publicly available information.
Trading involves risk; please assess your financial suitability, position size, and stop-loss levels before entering any trade.
Always consult a SEBI-registered financial adviser for personalized guidance.
Position Status: No active position in (BRITANNIA) at the time of this analysis.
Data Source: TradingView & NSE India
💬 Found this useful?
🔼 Give this post a Boost if you value clean technical confluence studies.
💭 Comment your thoughts — does this wedge-breakout setup look convincing to you?
🔁 Share this post to help others understand pattern + candlestick synergy.
👉 Follow for more institutional-style technical breakdowns built on clarity and patience.
🚀 Stay Calm. Stay Clean. Trade With Patience.
Trade Smart | Learn Zones | Be Self-Reliant 📊
BRITANNIA

Britannia - Smart Money Accumulation | Falling Channel Breakout________________________________________
🍪 BRITANNIA INDUSTRIES LTD
Ticker: NSE: BRITANNIA | Sector: FMCG | CMP: 6,025.50 | Rating: ⚡️ Bullish Bias Emerging
________________________________________
🧭 Chart Summary
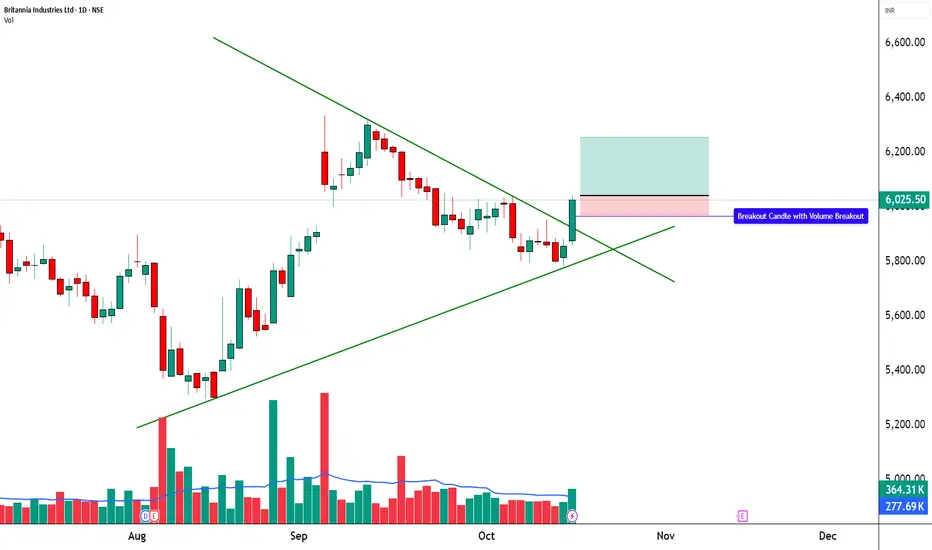
This chart of Britannia Industries Ltd (NSE) highlights a bullish breakout from a falling channel pattern after a prolonged period of controlled decline and consolidation.
The stock closed near 6,025.50, up +2.87%, forming a strong green candle backed by solid volume, signalling renewed buying strength.
The breakout above the channel’s upper trendline suggests a potential reversal of the short-term downtrend and the beginning of a new upward leg.
________________________________________
🟡 Technical Indicators Summary
The chart highlights bullish momentum supported by a strong bullish candle, indicating renewed buying interest.
A clear RSI breakout confirms strengthening momentum, while the Bollinger Band Squeeze-On Compression suggests volatility had tightened — often a precursor to a sharp directional move.
The recent liquidity sweep below key support appears to have trapped weak hands, fuelling this sharp rebound. Altogether, this setup reflects a bullish breakout zone where multiple indicators align in favour of buyers.
________________________________________
📊 Multi-Timeframe Trend View
The trend matrix shows 5m, 15m, 1H, 1W, and 1M all turning green (uptrend).
The daily is the only timeframe yet to flip, suggesting momentum is building and a daily trend alignment could soon confirm a broader upmove.
________________________________________
📈 Indicator Overview
RSI (56.9): Indicates moderate bullish strength — momentum is picking up.
MACD (-11.07): Still slightly negative but flattening, hinting at an upcoming bullish crossover.
CCI (27.3): Recovering from oversold territory, confirming a trend shift attempt.
Stochastic (94.2): Overbought zone — reflects strong short-term momentum, though minor pauses may occur.
________________________________________
🧩 Market Context
This pattern represents accumulation under resistance, commonly seen before strong breakouts in large-cap defensive stocks.
Given Britannia’s FMCG positioning, the move may also tie into a sector rotation play, as investors gravitate toward defensive sectors amid volatility in the broader markets.
________________________________________
💹 STWP Trade Analysis
Bullish Breakout Level: 6,041
Support Structure:
Intraday Support: 5,970 → Minor retest zone
Swing Support: 5,852 → Major trend-defining level
Intermediate Support: 5,776 → Key positional base
Key Levels (Subject to Daily Change):
Support: 5,909 / 5,792 / 5,726
Resistance: 6,091 / 6,157 / 6,274
________________________________________
🎓 STWP Learning
A falling channel breakout often signals that selling pressure has gradually weakened and smart money has started accumulating at lower levels.
When this pattern combines with rising volume and momentum indicators turning positive, it reflects a shift from distribution to accumulation.
Traders should note that confirmation above the breakout zone — ideally supported by volume — adds conviction to the move and reduces the risk of a false breakout.
________________________________________
⚠️ Disclosure & Disclaimer (SEBI-Compliant)
This content is created solely for educational and informational purposes to help readers understand technical analysis and market structure.
It does not constitute investment advice, research recommendation, or a solicitation to buy or sell any security.
The author is not a SEBI-registered investment adviser or research analyst.
All charts, patterns, and levels are based on personal study and historical data available from public sources such as TradingView and NSE India.
Position Status: No active position in BRITANNIA at the time of publication.
Trading and investing involve risk. Market movements can be unpredictable, and losses may exceed invested capital.
Readers are strongly advised to consult a SEBI-registered investment adviser before making any trading or investment decisions.
By engaging with this post, you acknowledge that you take full responsibility for your own trades, decisions, and outcomes.
________________________________________
💬 Found this useful?
🔼 Boost this post to support structured learning content.
✍️ Share your thoughts, questions, or observations — let’s grow together!
🔁 Share with learners and traders to promote responsible market education.
👉 “If you liked this breakdown, follow for more disciplined, educational trade setups.”
🚀 Stay Calm. Stay Clean. Trade With Patience.
Trade Smart | Learn Zones | Be Self-Reliant 📊
LT 1D Time frameCurrent Snapshot
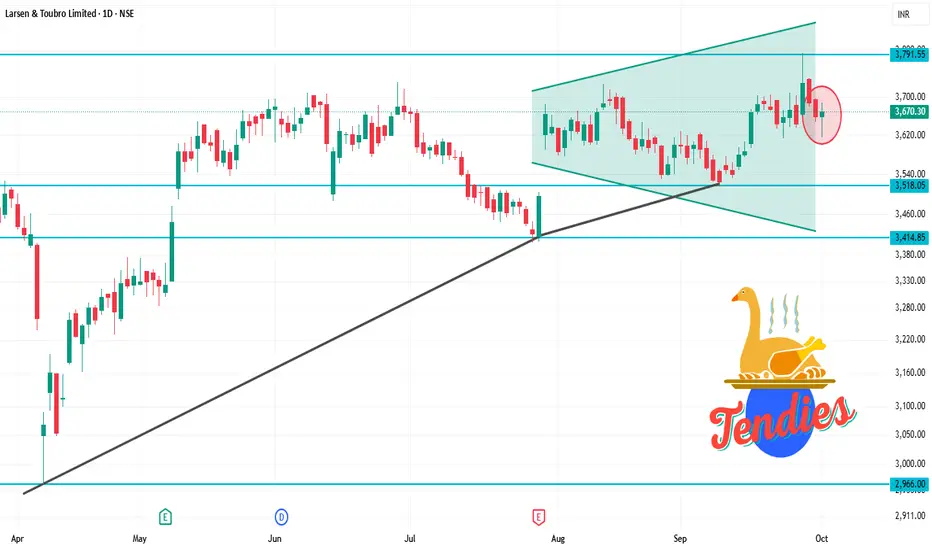
Current Price: ₹3,670.30
52-Week High: ₹3,963.50
52-Week Low: ₹2,965.30
Strategy & Outlook
Bullish Bias: The stock is in a short-term uptrend with positive momentum indicators.
Buying Opportunity: Consider entering near support zones (₹3,600–₹3,650) with a target towards ₹3,700–₹3,750.
Risk Management: Place stop-loss orders below the support levels to manage potential downside risks.
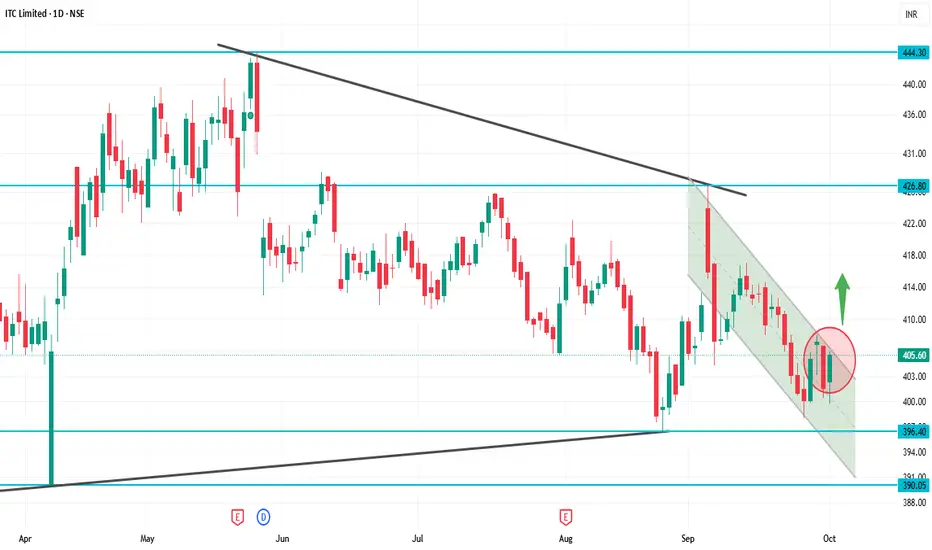
ITC 1D Time frameCurrent Price: ₹405.60
52-Week High: ₹524.35
52-Week Low: ₹390.15
Trend: Downward — trading below 5, 20, 50, 100, 200-day moving averages
Daily Chart Insights
Price below moving averages → bearish trend.
RSI & MACD → weak momentum, signaling short-term selling pressure.
Support zone at ₹390–₹400 → critical; a break below can push price down to ₹370–₹380.
Resistance at ₹420–₹430 → a strong close above may signal trend reversal.
Strategy / Outlook
Bearish Bias: Short-term trend is downward.
Buying Opportunity: Near support zones (₹390–₹400) if it holds.
Bullish Trigger: Close above ₹430 with strong volume indicates potential reversal.
Risk Management: Use stop-loss below critical support zones.
AXISBANK 1D Time frame📊 Daily Snapshot
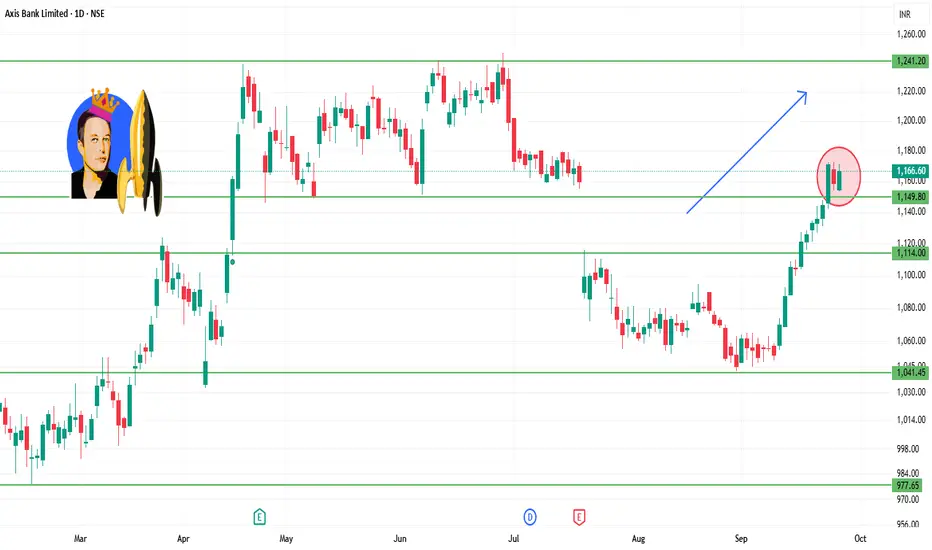
Closing Price: ₹1,166.10
Day’s Range: ₹1,153.40 – ₹1,171.80
Previous Close: ₹1,158.80
Change: Up +0.28%
52-Week Range: ₹933.50 – ₹1,281.65
Market Cap: ₹3.59 lakh crore
P/E Ratio: 12.9
Dividend Yield: 1.2%
EPS (TTM): ₹90.00
Beta: 1.1 (moderate volatility)
🔑 Key Technical Levels
Immediate Support: ₹1,153.33
Immediate Resistance: ₹1,153.33
Weekly Outlook: Immediate support at ₹1,109.23; major support at ₹1,082.57; immediate resistance at ₹1,153.33; major resistance at ₹1,170.77.
📈 Analyst Insights
Intrinsic Value: Estimated at ₹1,511.77 based on median valuation models, suggesting the stock is trading below its fair value.
📈 Strategy (1D Timeframe)
1. Bullish Scenario
Entry: Above ₹1,153.33
Stop-Loss: ₹1,109.23
Target: ₹1,170.77 → ₹1,200.00
2. Bearish Scenario
Entry: Below ₹1,109.23
Stop-Loss: ₹1,153.33
Target: ₹1,082.57 → ₹1,050.00
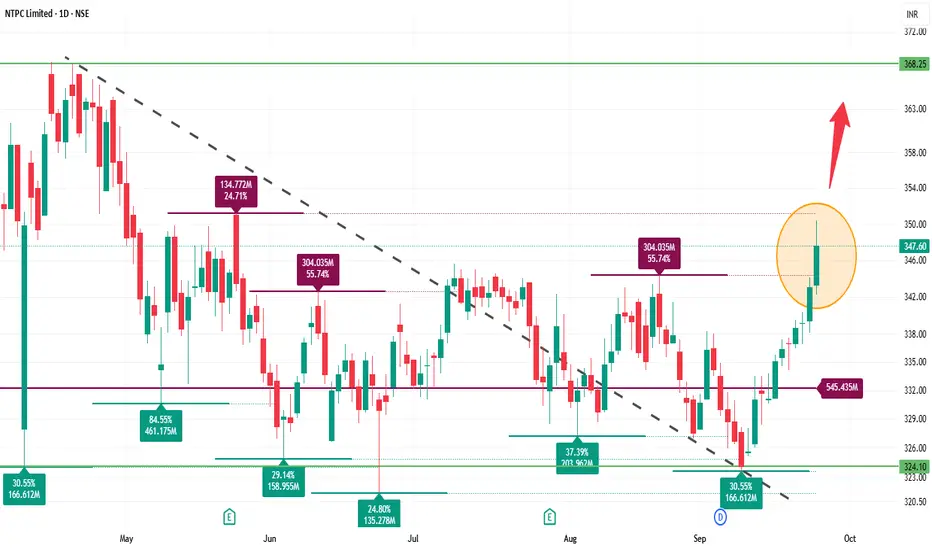
NTPC 1D Time frame📊 Today's Performance
Closing Price: ₹347.55
Day’s Range: ₹342.25 – ₹350.40
Previous Close: ₹343.00
Change: Up +1.33%
52‑Week Range: ₹292.80 – ₹448.45
Market Cap: ₹3.37 lakh crore
P/E Ratio: 14.07
Dividend Yield: 2.40%
EPS (TTM): ₹24.71
Beta: 1.06 (moderate volatility)
🔑 Key Technical Levels
Support Zone: ₹335.00 – ₹336.00
Resistance Zone: ₹350.00 – ₹355.00
All-Time High: ₹448.45
📈 Strategy (1D Timeframe)
1. Bullish Scenario
Entry: Above ₹350.00
Stop-Loss: ₹342.00
Target: ₹355.00 → ₹360.00
2. Bearish Scenario
Entry: Below ₹335.00
Stop-Loss: ₹342.00
Target: ₹325.00 → ₹320.00
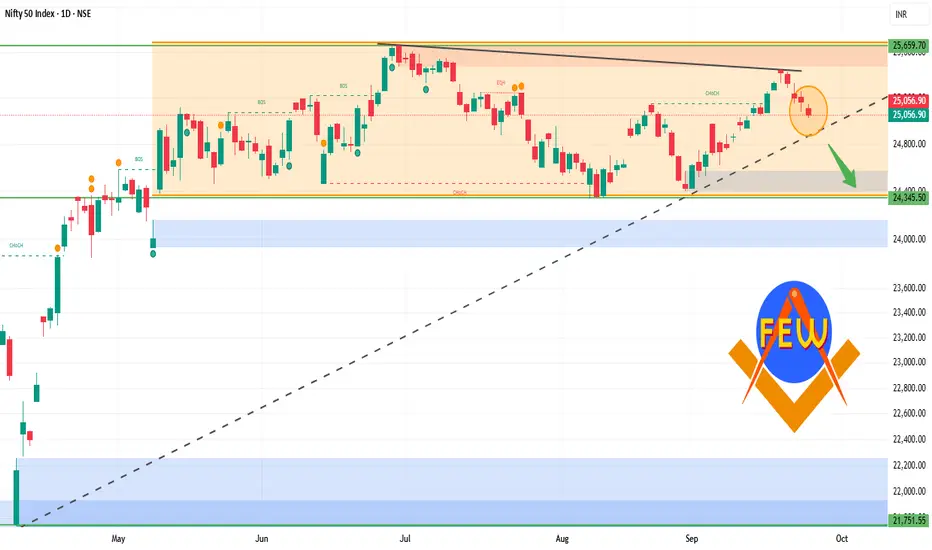
NIFTY 1D Time frame📊 Today’s Nifty Performance
Opening: Around 25,109
Closing: Around 25,057
Result: Market slipped about –52 points (–0.45%)
Range: High near 25,150, Low near 25,027
👉 If you were long (buy side) from the open and held till close → small loss (~52 points).
👉 If you were short (sell side) from the open and held till close → small profit (~52 points).
🎯 Key Levels
Support Zone: 25,000 – 25,020
Resistance Zone: 25,130 – 25,150
📝 Strategy
For Intraday Traders
Sell near resistance (25,130–25,150) with stop-loss just above 25,160.
Buy near support (25,000–25,020) with stop-loss just below 24,980.
For Swing Traders (2–3 days)
If Nifty sustains above 25,150, expect bounce toward 25,250+.
If Nifty breaks below 25,000, expect fall toward 24,900.
Risk Management
Use stop-loss always.
Don’t risk more than 1% of your capital on one trade.
Trail stop-loss if trade goes in your favor.
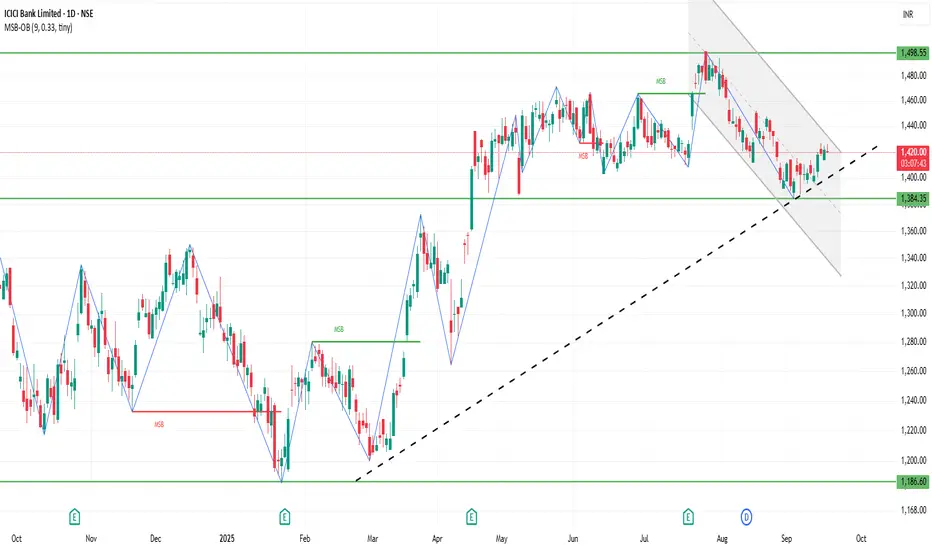
ICICIBANK 1D Time frame📍 Today’s Expected Range (Intraday Approximation)
Expected High: ₹1,403–₹1,410
Expected Low: ₹1,391–₹1,385
These are approximate intraday levels. Actual prices may fluctuate slightly due to market volatility.
🔍 Key Points
Current price: ₹1,400–₹1,401, close to resistance.
If price breaks above ₹1,410 with strong volume → bullish momentum likely.
If price drops below ₹1,385 → short-term correction or pullback possible.
📊 Suggested Trading Strategy
Bullish Scenario
If ICICI Bank breaks ₹1,403–₹1,410, you can buy, targeting ₹1,420–₹1,430.
Stop-loss: ₹1,395
Bearish Scenario
If ICICI Bank drops below ₹1,385, you can sell/short, targeting ₹1,375–₹1,370.
Stop-loss: ₹1,390
Range-Bound / Sideways
If price trades between ₹1,385–₹1,403, it’s better to wait and avoid trading until a clear breakout occurs.
💡 Summary
Resistance Zone: ₹1,403–₹1,410
Support Zone: ₹1,385–₹1,391
Strategy: Trade in the direction of the breakout, and always use stop-loss to manage risk.
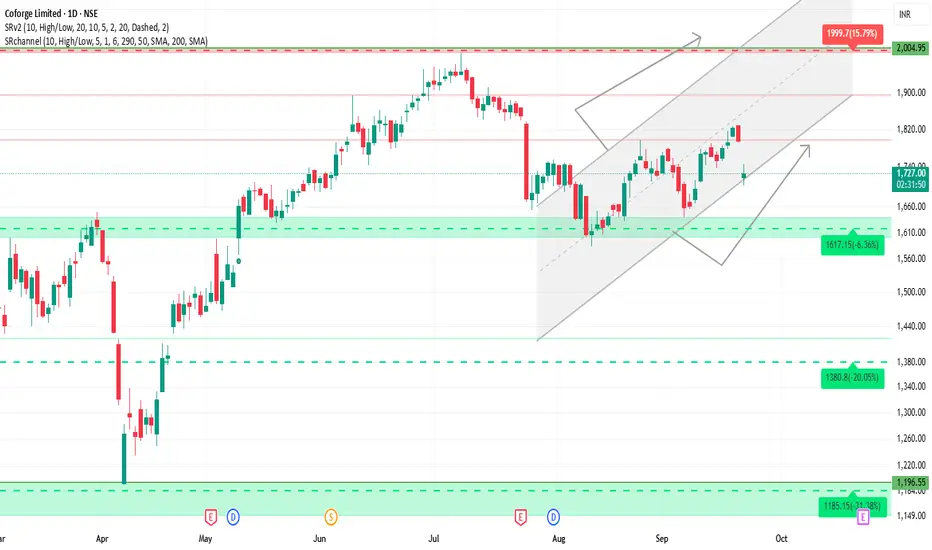
COFORGE 1D Time frame🔍 Current Price
Trading around ₹1,720 – ₹1,740
📊 Technical Indicators
Trend: Bearish — price trading below short and medium-term moving averages.
RSI (14): Around 26–27, showing oversold zone.
MACD: Negative, indicating bearish momentum.
ADX: Strong, meaning the downtrend has solid strength.
⚙️ Key Levels
Immediate Resistance 1: ₹1,780
Resistance 2: ₹1,820 – ₹1,840
Immediate Support 1: ₹1,700
Support 2: ₹1,650
Deeper Support: ₹1,620
🧮 Base Strategy
Long Setup:
Entry: Near ₹1,700 if reversal signals appear
Stop Loss: Below ₹1,650
Targets: ₹1,780 first, then ₹1,820+
Short Setup (Reversal):
If price fails near ₹1,780 zone
Targets: ₹1,700, then ₹1,650
Breakout Setup:
If price sustains above ₹1,820 – ₹1,840 with volume
Upside can extend toward higher levels
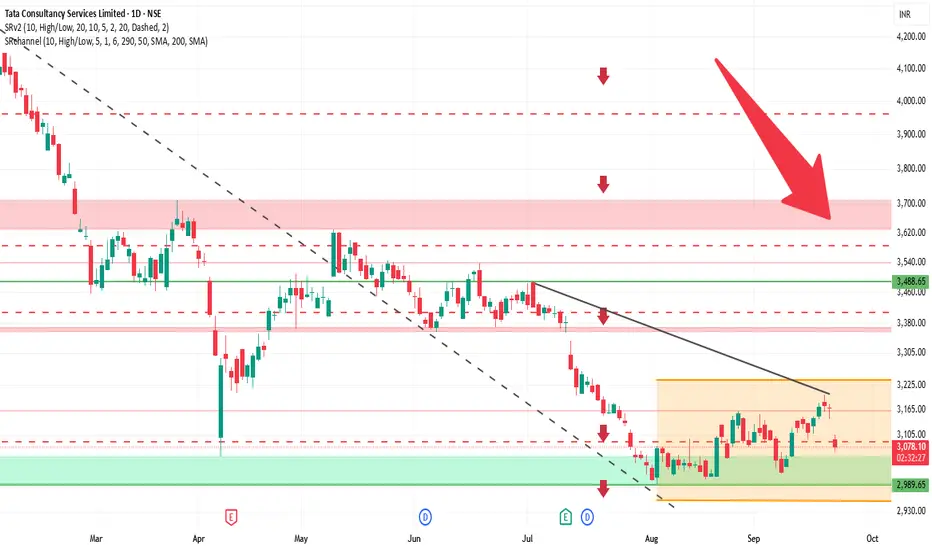
TCS 1D Time frame🔍 Current Price & Context
Trading around ₹3,089
Day’s range: ₹3,065 – ₹3,107
Previous close: ₹3,171
Market sentiment: Bearish, influenced by external factors affecting IT stocks.
📊 Technical Indicators
Moving Averages: Short-term averages are slightly above current price, acting as resistance.
RSI (14): ~30, indicating oversold conditions.
MACD: Negative, showing bearish momentum.
Stochastic Oscillator: Oversold, may suggest a short-term reversal.
CCI (20): Below zero, confirming bearish trend.
ROC (20): Negative, indicating declining momentum.
🧮 Strategy / Trade Ideas
Long Setup:
Entry near support (~3,050) if bullish reversal appears
Stop Loss: Below 3,000
Targets: 3,100 first, then 3,150
Short / Pullback Setup:
Entry if price fails near resistance (~3,100)
Stop Loss: Above 3,150
Targets: 3,050 first, then 3,000
✅ Summary
TCS on daily chart is bearish but oversold. Watch immediate support (~3,050) for potential reversal, and resistance (~3,100 – 3,120) for pullback risk. A breakout above resistance could target 3,150+, while failure of support may lead toward 3,000.
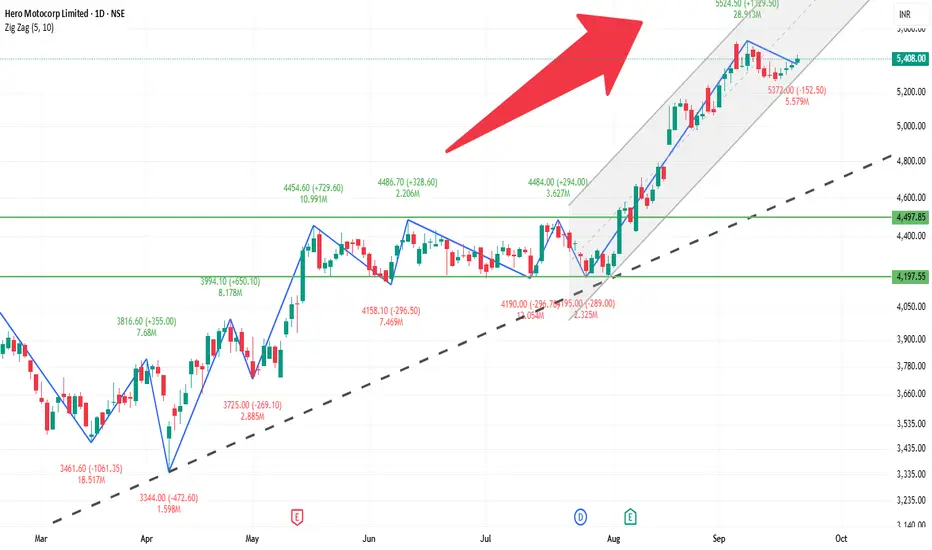
HEROMOTOCO 1D Time frameCurrent Price: 5,408 (near recent highs).
Current Trend: Strong bullish momentum; stock is trading above key resistances.
Support Zone: Immediate support at 5,300 – 5,350. If this holds, uptrend remains intact.
Resistance Zone: Next resistance is around 5,500 – 5,550. A breakout above this can push toward 5,650+.
Indicators: Daily candle structure is bullish, showing higher highs and strong buying interest.
Outlook:
Above 5,500 → continuation of bullish rally.
Below 5,300 → minor weakness; may slip toward 5,200.
👉 In short (with 5,408 price):
Bullish tone.
Range to watch: 5,300 – 5,550.
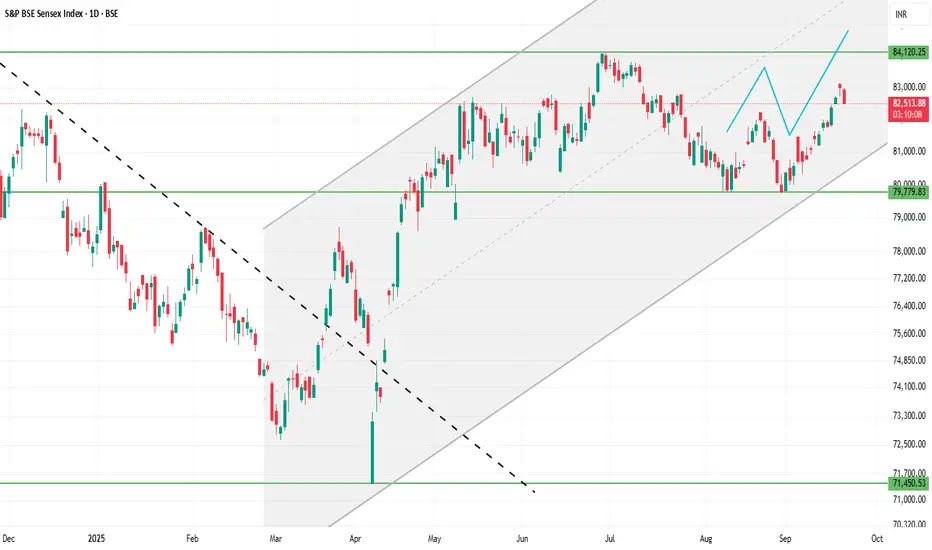
SENSEX 1D Time frameCurrent Facts
Current Level: 82,590.45 - 82,616.13
Trend: Mildly bullish; trading above short-term moving averages (20-day & 50-day EMA).
Momentum Indicators:
RSI (14-day): ~60 → bullish but not overbought.
MACD: Positive → supporting the uptrend.
Price Action: Daily candles show small upper wicks → minor profit-taking near resistance.
⚙️ Outlook
Bullish Scenario:
Holding above 82,450 → retest 82,650–82,700 and possibly 82,850–82,900.
Range / Consolidation:
Price oscillates between 82,400 – 82,650 → sideways trading likely.
Bearish Scenario:
Close below 82,400 → downside risk toward 82,250–82,300 or lower.
⚠️ Key Facts
82,500–82,600 acts as a short-term pivot: above it favors bulls, below it favors bears.
Resistance at 82,650–82,700 is key; breakout here may trigger further upside.
Support at 82,400–82,450 is critical; failing to hold may lead to short-term correction.
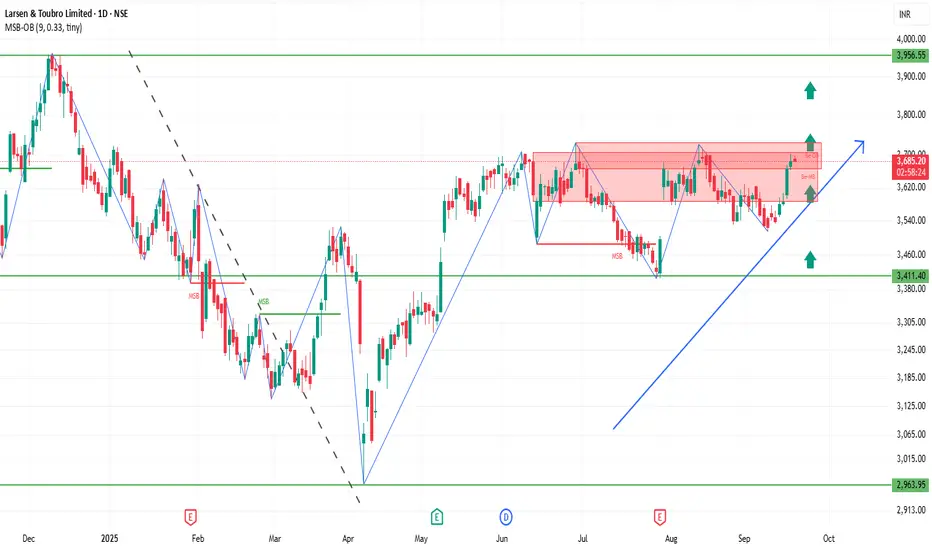
LT 1D Time frameCurrent Snapshot
Price: ₹3,695 (slightly higher than yesterday’s level).
Stock is holding near resistance but still above strong supports.
Trend is bullish to sideways.
📌 Key Levels
Immediate Resistance: ₹3,740 – ₹3,800.
Immediate Support: ₹3,650 – ₹3,670.
Stronger Support: ₹3,600, and deeper support near ₹3,100 on longer timeframe.
✅ Outlook
If LT sustains above ₹3,670, bulls remain strong and a breakout above ₹3,740 could push toward ₹3,800+.
If it falls below ₹3,650, then short-term weakness may test ₹3,600.
As long as it stays above ₹3,600, the larger trend remains intact.
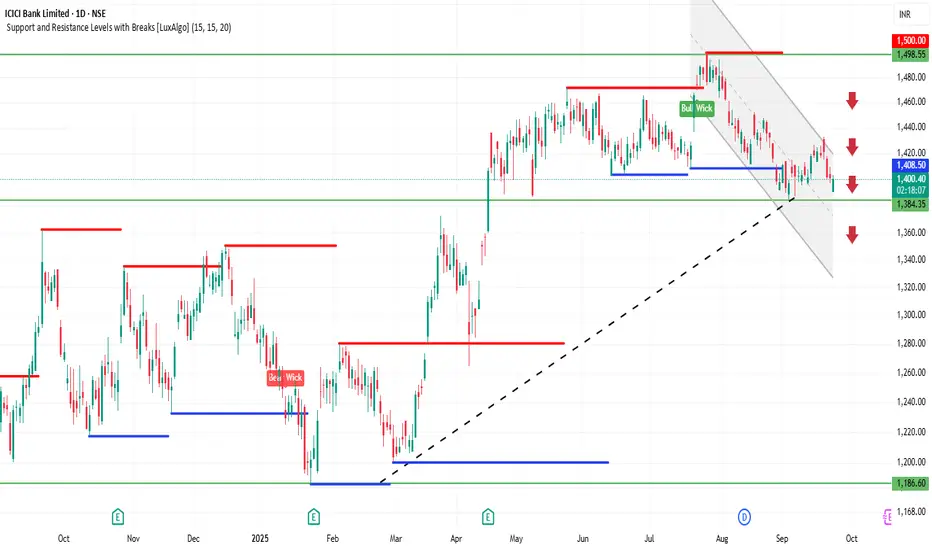
ICICIBANK 1D Time frameCurrent Stock Price
Current Price: ₹1,421.60
Day’s Range: ₹1,420.00 – ₹1,426.10
52-Week Range: ₹1,186.00 – ₹1,500.00
Market Cap: ₹10.17 lakh crore
P/E Ratio (TTM): 18.01
EPS (TTM): ₹74.05
Dividend Yield: 0.77%
Book Value: ₹436.67
📈 Trend & Outlook
Short-Term Trend: Bullish; the stock is trading near its 52-week high, indicating strong investor confidence.
Resistance Levels: ₹1,426.10 (day’s high), ₹1,500.00 (52-week high).
Support Levels: ₹1,420.00 (day’s low), ₹1,400.00 (psychological support).
Investor Sentiment: Positive, with strong institutional interest and favorable analyst outlooks.
🧭 Analyst Insights
Valuation: The stock is trading at a P/E ratio of 18.01, which is slightly below the sector average of 19.82, suggesting potential value.
Growth Prospects: The bank's strong earnings growth and robust capital position support its premium valuation.
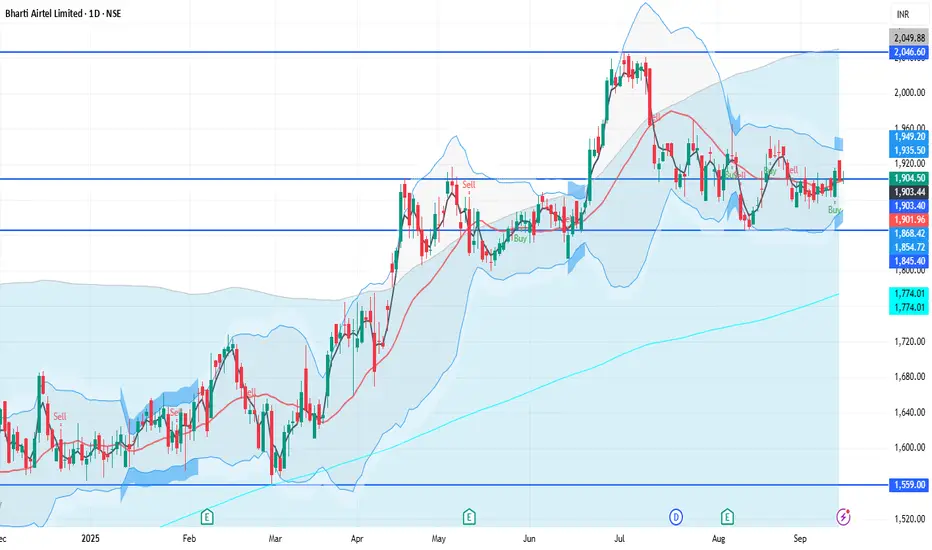
BHARTIARTL 1D Time frameUpdated Snapshot
Current Price: ₹1,903 – ₹1,906
Day’s Range: ₹1,901.60 – ₹1,925
Previous Close: ₹1,902.60
🔹 Support & Resistance
Support 1: ₹1,900 – ₹1,895
Support 2: ₹1,880 – ₹1,870
Resistance 1: ₹1,920 – ₹1,925
Resistance 2: ₹1,950 – ₹1,960
ANGELONE 1D Time frameCurrent Price: ₹2,238 – ₹2,240
Day’s Range: ₹2,212.60 – ₹2,274
Previous Close: ₹2,222.30
🔹 Support & Resistance
Support 1: ₹2,220 – ₹2,215
Support 2: ₹2,200 – ₹2,180
Resistance 1: ₹2,250 – ₹2,260
Resistance 2: ₹2,270 – ₹2,280

BTCUSD📍 BTCUSD – 1H Key Levels
🔹 Support Zones
$55,200 – $55,500 → Immediate intraday support
$54,500 – $54,800 → Strong support zone, buyers likely to defend here
$53,800 – $54,000 → Major support, breakdown here could trigger deeper correction
🔹 Resistance Zones
$56,800 – $57,000 → Immediate 1H resistance
$57,800 – $58,200 → Strong resistance, breakout can fuel further upside
$59,000 – $59,500 → Major resistance, likely to act as a supply zone
⚖️ Quick Summary
As long as BTCUSD trades above $55,500, short-term bias remains bullish.
Breakout above $57,000 may push price towards $58,200 – $59,500.
Breakdown below $54,800 may drag price back towards $54,000 – $53,800.
Current 1H bias: Range-bound to bullish, waiting for a breakout from $55,500 – $57,000 zone.

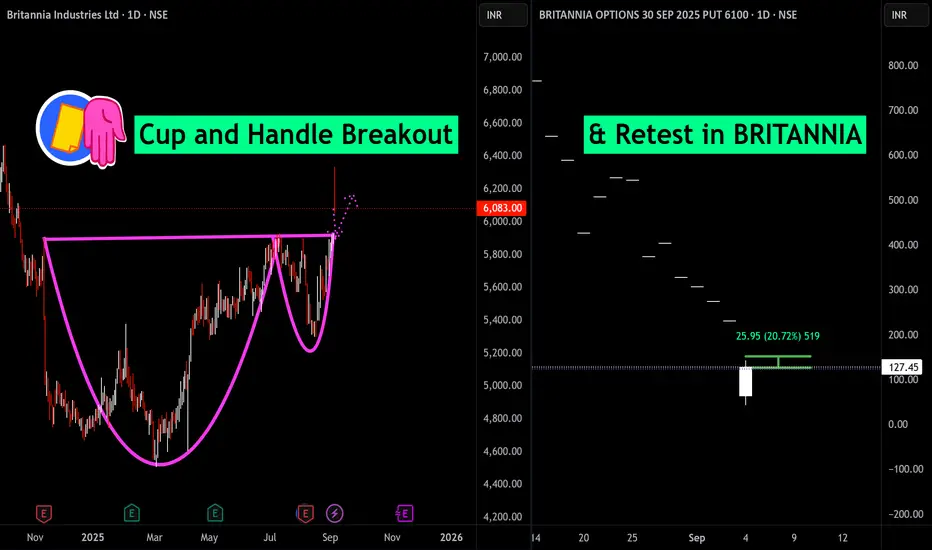
Cup and Handle Breakout & Retest in BRITANNIABritannia Industries has delivered a textbook Cup and Handle breakout on its daily chart, signaling renewed bullish momentum and the potential for higher highs ahead. After months of base-building, the stock surged above the key resistance level near ₹6,083, confirming the breakout with strong volume and a sharp price spike. This technical pattern often foreshadows continued upward movement, as buyers regain control following consolidation.
On the right, the Britannia 6100 September PUT option chart highlights a significant retest, with the PUT price dropping over 44% today, indicating strong bullish sentiment in the underlying stock. The sharp drop in the PUT’s value reinforces the breakout’s validity, since a falling PUT price typically aligns with rising equity prices.
Overall, Britannia’s decisive close above resistance and the synchronized retreat in bearish option premiums underscore an emerging uptrend. Traders may watch for continuation above ₹6,083 while managing risk near the breakout level.
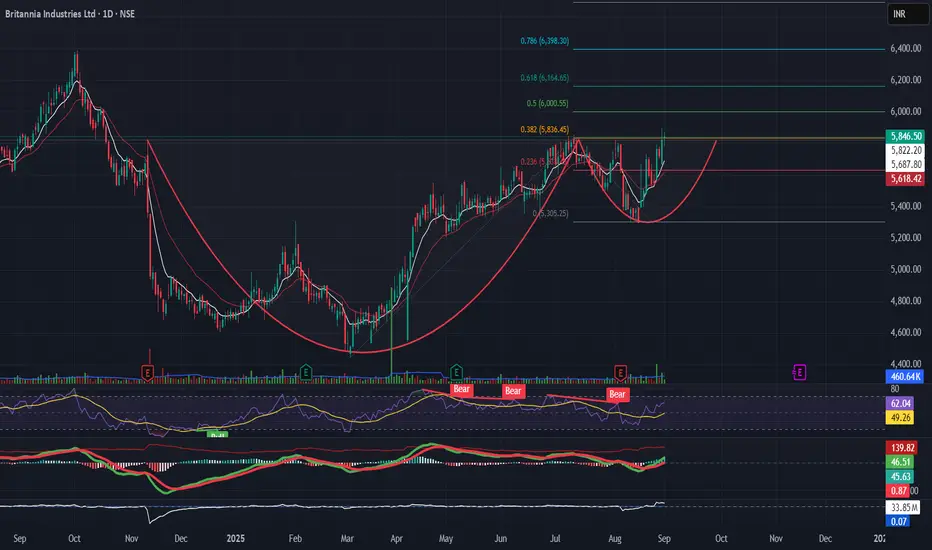
Cup and Handle pattern in Britannia Britannia is ready to breakout from cup and handle pattern
" Right now Britannia is at critical ₹5,836 resistance.
A breakout above this level can extend the rally toward ₹6,000–₹6,165.
Support at ₹5,680.
📊 Sector: FMCG (aligned with consumption strength)"
Britannia is retesting the ₹5,836 Fib resistance (0.382) after forming a cup-like base. Momentum indicators (RSI > 60, MACD improving) support potential breakout.
Options OI Trade Outlook — Bullish Setups Only________________________________________
📊 Options OI Trade Outlook — Bullish Setups Only
“This analysis is shared purely for educational purposes and market awareness — not a trading recommendation.”
(Educational Purpose | Not Financial Advice | SEBI Compliant)
Hello Traders 👋,
Here are today’s 7 Bullish Option Setups based on OI + Price Action + IV + Greeks study.
This is strictly for learning and educational purposes only.
________________________________________
🟢 1. ITC 410 CALL
LTP: 7.25
Sentiment: Bullish | Trend: Up | Strength: 5/5 (Strong)
IV: 13.3 | Delta: 0.55 | Theta: -0.20 | Vega: 0.46
Buildup: Long Build-up
Why?
410 CE shows a strong Long Build-up with price ↑ 70.6% and OI ↑ 31.2%.
Volume jumped +305.9%, confirming active participation.
Low IV makes premiums attractive. Delta 0.55 indicates higher ITM probability.
________________________________________
🟢 2. CGPOWER 700 CALL
LTP: 23.5
Sentiment: Bullish | Trend: Up | Strength: 5/5 (Strong)
IV: 30.9 | Delta: 0.52 | Theta: -0.65 | Vega: 0.79
Buildup: Long Build-up
Why?
700 CE surged +127% in price with OI ↑ 216.5% — strong long confirmation.
Volume spiked +2962%, showing aggressive buying.
IV rising (+10.3%) supports premium expansion.
________________________________________
🟢 3. COLPAL 2340 CALL
LTP: 61.7
Sentiment: Bullish | Trend: Up | Strength: 5/5 (Strong)
IV: 22.4 | Delta: 0.53 | Theta: -1.52 | Vega: 2.64
Buildup: Long Build-up
Why?
2340 CE gained +89.8% in price with OI ↑ 146.9%.
Volume surged +2357%, indicating strong trader interest.
Moderate IV gives a balanced risk-reward setup.
________________________________________
🟢 4. LT 3600 CALL
LTP: 76.25
Sentiment: Bullish | Trend: Up | Strength: 5/5 (Strong)
IV: 15.9 | Delta: 0.55 | Theta: -2.34 | Vega: 4.06
Buildup: Long Build-up
Why?
3600 CE rose +29.2% with OI ↑ 3.6%.
Volume ↑ 71%, confirming active participation.
Delta 0.55 signals higher ITM chances with bullish momentum.
________________________________________
🟢 5. BRITANNIA 5800 CALL
LTP: 172
Sentiment: Bullish | Trend: Up | Strength: 5/5 (Strong)
IV: 21.6 | Delta: 0.57 | Theta: -3.46 | Vega: 6.52
Buildup: Long Build-up
Why?
5800 CE rallied +49.6% with OI ↑ 16.5%.
Volume jumped +566%, confirming buying momentum.
IV rising (+9.4%) shows strong premium expansion potential.
________________________________________
🟢 6. ASIANPAINT 2500 CALL
LTP: 77
Sentiment: Bullish | Trend: Up | Strength: 3.9/5 (Strong)
IV: 20.8 | Delta: 0.59 | Theta: -1.40 | Vega: 2.79
Buildup: Short Covering
Why?
2500 CE benefited from short covering — price ↑ 21% while OI ↓ 21.6%.
This indicates shorts exiting, fueling bullish momentum.
Volume dipped (-15.9%), so position sizing should be careful.
________________________________________
🟢 7. DMART 4800 CALL
LTP: 101
Sentiment: Bullish | Trend: Up | Strength: 5/5 (Strong)
IV: 20.2 | Delta: 0.50 | Theta: -3.53 | Vega: 5.40
Buildup: Long Build-up
Why?
4800 CE rose +12.1% with OI ↑ 17.5% — strong long confirmation.
Volume ↑ 159.9% adds conviction.
IV easing (-6.1%) ensures better fills with controlled risk.
________________________________________
⚠️ Disclaimer – Please Read Carefully
The information shared here is meant purely for learning and awareness.
It is not a buy or sell recommendation and should not be taken as investment advice.
📌 I am not a SEBI-registered investment advisor.
📌 All views expressed are based on personal study, chart patterns, and publicly available data.
📌 Trading in stocks or options carries risk. Markets can move unexpectedly. Losses can exceed capital.
📌 Past setups do not guarantee future outcomes.
👉 Beginners: Use this for study & paper trading only.
👉 Experienced traders: Apply your own risk management & strategy filters.
👉 Always consult a SEBI-registered financial advisor before real trades.
________________________________________
💬 Found this useful?
🔼 Boost this post to help more traders learn.
✍️ Share your thoughts/setups in comments — let’s grow together.
🔁 Share with fellow traders & learners.
👉 Follow for more clean, structured breakdowns with discipline at the core.
🚀 Stay Calm. Stay Clean. Trade With Patience.
Trade Smart | Learn Zones | Be Self-Reliant 📊
________________________________________

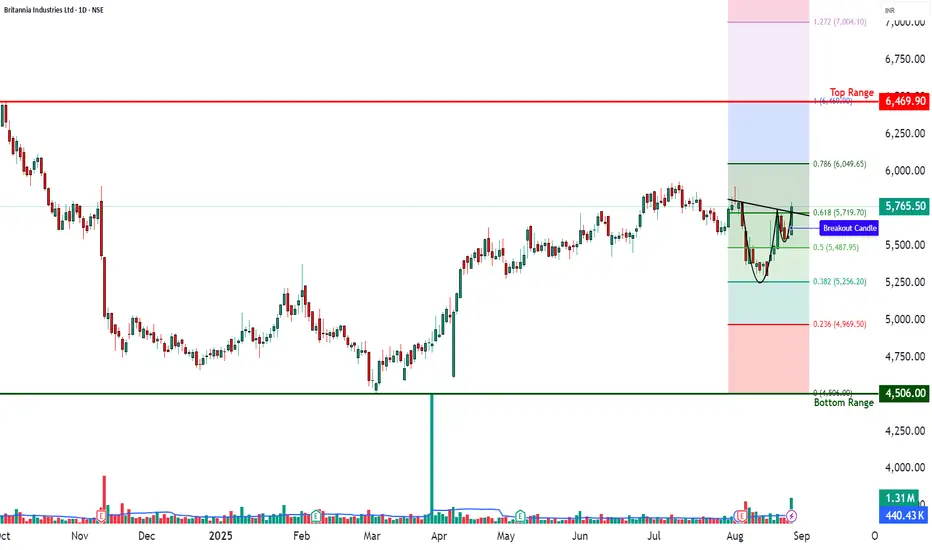
BRITANNIA - Cup & Handle Breakout Attempt📊 BRITANNIA – Technical & Fundamental Educational Snapshot
Ticker: NSE: BRITANNIA | Sector: FMCG – Packaged Foods & Biscuits
CMP: ₹5,765.50
Rating: ⭐⭐⭐⭐ (Bullish Setup – For Educational Purposes Only)
Pattern Observed: ☕📈 Cup & Handle Breakout Attempt
📊 Technical Observations
BRITANNIA (CMP: ₹5,765.5) is exhibiting a Cup & Handle breakout formation, confirmed by a strong bullish candle on heavy volumes. The stock has moved up from a recent bottom zone near ₹5,256–₹5,487 towards the neckline at ₹5,794, with key resistances placed at ₹5,848, ₹5,931, and ₹6,068, while supports are noted at ₹5,628, ₹5,491, and ₹5,408.
Technical indicators show RSI at 59 (breakout zone), a bullish MACD crossover, CCI at 76, and Stochastic at 94, highlighting strong upward momentum. The price action is supported by VWAP strength, and a Bollinger Band squeeze-off breakout, suggesting a possible trend continuation.
Volume surged to ~1.31M shares, significantly higher than the 20-day average of ~0.44M, indicating institutional participation. Based on the current momentum and technical structure, there is a strong possibility of breakout continuation; however, traders should carefully monitor the ₹5,628 and ₹5,518 levels as critical supports for risk management.
Britannia Industries has been in focus after analysts at PL Capital named it among their top stock picks, citing its strong positioning to benefit from India’s consumption revival. In its Q1 FY26 results, the company reported a consolidated net profit of ₹521 crore, up ~3% YoY, with revenues rising ~9% to ₹4,622 crore, though profitability fell short of street expectations due to higher input costs. Standalone performance was softer, with net profit down 0.8% YoY to ₹498 crore despite an 8.8% increase in revenue, reflecting margin pressure from raw material cost inflation. On the positive side, Britannia highlighted broad-based demand growth across both rural and urban markets and announced steps to boost the nutritional profile of its products by increasing whole grain content while reducing sugar and sodium, aligning with health-conscious consumer trends.
From a sentiment standpoint, the stock currently reflects a neutral to slightly positive bias. Bullish triggers include the ongoing consumption recovery, strong rural demand, analyst endorsements, product innovation, and sequential revenue growth. On the bearish side, rising input costs, weak standalone profitability, and rich valuations (P/E ~60) pose risks to near-term upside.
From an investment perspective, the outlook for Britannia remains mixed but constructive. On the bullish case, volume-led demand growth, health-focused innovation, and strong brand positioning could support further upside. On the bearish case, margin pressure and stretched valuations may limit near-term gains. In the short term (next few sessions), price action appears momentum-driven, supported by a bullish cup-and-handle breakout setup and strong institutional participation, making a continuation move possible in the next 1–2 days. Over the longer term (6–12 months), Britannia’s growth story remains intact provided cost pressures ease and the company sustains its demand momentum, aligning with PL Capital’s positive stance on the FMCG leader.
📊 STWP Trade Analysis – Under the STWP trade framework, one illustrative breakout scenario could involve a long entry near ₹5,794.50, with a protective stop at ₹5,518.40. In comparable past structures, price has tended to extend towards zones such as ₹5,848–₹5,880 (approx. 1:1 risk–reward), ₹5,931 (around 1:1.5 R:R), and ₹6,049–₹6,071 (approx. 1:2 R:R). If momentum accelerates, a stretch target may open towards ₹6,068 → ₹6,347.
An alternative, more conservative illustration could be a pullback entry in the ₹5,545–₹5,525 zone, with a tight invalidation stop at ₹5,518. A quick reaction pullback may also occur around the Fibonacci level of ₹5,719.70, before attempting a continuation higher. Upside zones remain aligned with the same resistance ladder (₹5,848–₹5,880 → ₹5,931 → ₹6,049–₹6,071 → ₹6,347).
Possible Demand Zone (Illustrative): ₹5,608.50 – ₹5,545
Stop Loss (tight): ₹5,537.90
Approximate Risk: ~₹70 per lot
⚠️ Risk Reminder:
Price momentum is strong but Stochastic readings are elevated, which may lead to volatility or shakeouts. Traders should trail stops actively (e.g., move SL to breakeven after T1, and under higher lows after T2). Market volatility, raw material cost changes, and broader FMCG index sentiment can influence outcomes. Past price behavior and backtests are illustrative only and do not guarantee future performance.
⚠️ Disclaimer – Please Read Carefully
The information shared here is meant purely for learning and awareness. It is not a buy or sell recommendation and should not be taken as investment advice. I am not a SEBI-registered investment advisor, and all views expressed are based on personal study, chart patterns, and publicly available market data.
Trading — whether in stocks or options — carries risk. Markets can move unexpectedly, and losses can sometimes exceed the money you have invested. Past performance or past setups do not guarantee future results.
If you are a beginner, treat this as a guide to understand how the market works — practice on paper trades before risking real money. If you are experienced, always assess your own risk, position sizing, and strategy suitability before entering trades.
Consult a SEBI-registered financial advisor before making any real trading decision. By engaging with this content, you acknowledge full responsibility for your trades and investments.
💬 Found this useful?
🔼 Give this post a Boost to help more traders discover clean, structured learning.
✍️ Drop your thoughts, questions, or setups in the comments — let’s grow together!
🔁 Share with fellow traders and beginners to spread awareness.
👉 “If you liked this breakdown, follow for more clean, structured setups with discipline at the core.”
🚀 Stay Calm. Stay Clean. Trade With Patience.
Trade Smart | Learn Zones | Be Self-Reliant 📊
BRITANNIA INDUSTRIES LTD. – TECHNICAL INSIGHT________________________________________________________________________________
📊 BRITANNIA INDUSTRIES LTD. – TECHNICAL INSIGHT
📆 Date: July 8, 2025 | 🕒 Daily Chart
📍 Symbol: NSE: BRITANNIA
💡 Educational Breakdown – For Study & Learning Only
________________________________________________________________________________
🔹 Price Action Overview:
Britannia closed at ₹5,884.00, up by +1.95%, forming an “Above the Stomach” bullish continuation pattern just below a key resistance zone.
________________________________________________________________________________
🔴 Top Range (Resistance): ₹5,899.50
📉 Bear Strength: 53
The price has approached a previous supply zone where sellers have shown resistance. Watch this level closely for either a breakout or rejection.
________________________________________________________________________________
🟢 Bottom Range (Support): ₹4,506
📈 Bull Strength: 77
This zone acted as a strong demand base in the past, initiating a rally with a sharp volume spike.
________________________________________________________________________________
🔍 Pattern Focus: Above the Stomach
A bullish candle has opened above the midpoint of the previous red candle, suggesting buyer strength. This often signals momentum continuation, especially near breakout levels.
________________________________________________________________________________
🎯 What to Watch For:
✅ Breakout Confirmation Zone:
If price closes decisively above ₹5,900 with volume expansion, it may indicate strength and fresh upside continuation.
________________________________________________________________________________
🚫 Failure Zone:
If price faces rejection near ₹5,900–₹5,920 and forms a bearish engulfing or strong upper wick, short-term profit booking could occur.
________________________________________________________________________________
📌 Risk Management Tip:
Traders typically look for entry above breakout candle high with a stop below recent swing low or candle low. Volume confirmation is essential before considering directional bias.
________________________________________________________________________________
🔍 Contextual Takeaway:
This is a textbook example of price consolidating just below a resistance after a strong trend and forming a bullish candle setup. A breakout or failure here can define the next leg of the move.
________________________________________________________________________________
📚 Stay objective, wait for confirmation, and let the price lead.
________________________________________________________________________________
Entry Above ₹5,905–₹5,920 (on breakout)
Stop Loss ₹5,765
Risk Reward 1:1 | 1:2 +
________________________________________________________________________________
⚠️ Disclaimer:
This analysis is for educational purposes only.
STWP is not a SEBI-registered advisor.
No buy/sell recommendations are made.
Please consult your financial advisor before trading.
STWP is not responsible for trading decisions based on this post.
________________________________________________________________________________
What’s your view on BRITANNIA ? Comment below ⬇️
🔁 Share this if you're tracking the stock
✅ Follow STWP for clean Price Action + Candlestick patterns
🚀 Be Self-Reliant | Trade with Patience | Learn with Logic
________________________________________________________________________________

BRITANNIA INDUSTRIES LTD. – INTRADAY ZONE ANALYSIS📈 BRITANNIA INDUSTRIES LTD. – INTRADAY ZONE ANALYSIS
📆 Date: July 1, 2025 | ⏱ Timeframe: 15-Minute Chart
🔍 Educational Breakdown – For Learning & Study Use Only
________________________________________
🔹 Price Action Zones
🔴 Top Range (Resistance): ₹5869.50
🟢 Bottom Range (Support): ₹5721
⚪ Neutral Zone: Between ₹5732 – ₹5804 (No clear directional bias until breakout from either zone)
________________________________________
🧩 Chart Pattern: No
There’s no prominent chart pattern (e.g., flag, wedge, triangle) seen in the current snapshot. This is primarily a demand-supply structure with price action analysis.
________________________________________
🔁 Reversal Candlestick Patterns:
🔴 Top Range: No textbook reversal candle observed yet. However, the previous rejection from ₹5822–₹5804 still makes this zone valid for bearish observation.
🟢 Bottom Range: ✅ Morning Star pattern identified near ₹5721.
This is a strong bullish reversal pattern indicating potential buyer strength emerging from the demand zone.
________________________________________
🧠 1. Trade Plan (Based on Reason and Logic)
🔼 Bullish Trade:
Idea: Go long if price retests ₹5732–₹5721 and holds with bullish confirmation (preferably another higher low or volume spike).
Stop Loss: Below ₹5715
Risk-Reward: 1:1 | 1:2+
Logic: Presence of a valid Morning Star reversal at demand zone suggests buyer strength and potential upside toward ₹5800+.
________________________________________
🔽 Bearish Trade:
Idea: Short if price rallies to ₹5822–₹5804 and shows rejection (bearish wick, reversal candle, volume drop).
Stop Loss: ₹5827.25
Risk-Reward: 1:1 | 1:2+
Logic: Previously reacted supply zone with strong rejection. If tested again without volume confirmation, short setup is valid.
________________________________________
📦 2. Trade Plan Based on Demand/Supply Zones
🟥 Supply Zone: ₹5822 – ₹5804
SL: ₹5827.25
Plan: Enter short only if price rejects the zone again with bearish confirmation.
Risk-Reward: 1:1 | 1:2+
🟩 Demand Zone: ₹5732 – ₹5721
SL: ₹5715.60
Plan: Enter long if the zone holds, ideally using the Morning Star as confirmation.
Risk-Reward: 1:1 | 1:2+
________________________________________
📌 Disclaimer
This analysis is shared for educational and study purposes only. It does not constitute investment advice. The author is not SEBI-registered. Please consult a SEBI-registered advisor before making trading decisions. Always use proper risk management and trade only with confirmation.
________________________________________
💬 Comments
What’s your view on Britannia?
Will the Morning Star at the demand zone lead to a reversal, or will supply pressure dominate again?
Drop your thoughts and chart setups below 👇
________________________________________
