Britannia Industries Ltd - 10.12.2021Britannia Industries Ltd - 10.12.2021
The stock is trading @ 3632 levels
There is a HAMMER in weekly chart
There is a SPINNING TOP in daily chart
The prices are above ema
Stochastic overbought in daily chart
Watch out for the price action
BRITANNIA

BRITANNIA important levels for long term investmentBRITANNIA important levels for long term investment

Britannia Long - FMCG1. Price sustaining support 5 times.
2. Formed good BULLISH REVERSAL candle at support line.
3. Also, FMCG Index corrected at reversing at support.
Entry : 3620-3640
SL : 3300 - closing basis
Target: 4100

Britannia for swing Britannia for swing
Reason >>
1. Trendline support
2. NIFTY FMCG Reversal from 200EMA
3. At Demand zone
Play with sl of 3280 for targets of 3700/3830/4130++
Trade on your risk, consult your financial advisor before taking trade!
Happy Trading

BRITANNIA BREAK-OUT AND RE-TESTBritanniya Break-out and re-test.
Fundamentally Strong company
Technical : channel pattern

britanniataking support at 200 MA
go long above 3730 hourly closing
sl 3600
target ath
Disclaimer: This is for demonstration and educational purpose only. This is not buying or selling recommendations. I am not SEBI registered. Please consult your financial adviser before taking any trade.

Britannia - Get ReadyBritannia is coming close to its long-time support trendline. If a reversal is shown any day, it may go in an uptrend. One may wait to enter at a lower price around 3450-3400 if falls further. Early targets are indicated on the chart.
Only for learning and sharing purposes . Not a trading recommendation.
Please comment on what do you think about the setup.
All the best.

weekly weak closeweekly close below 3540
will take bearish entry next week
disclaimer - trade @ own risk

Britannia Trade Long For TomorrowAs you can see in the chart from last 10-15 day stock is consolidating behind 3700 levels.
.
Today stock has given the breakout and then made a green candle.
.
So for tomorrow if stock goes above 3750, you can this trade for the Target of 3900.
.
Note: This is a swing trade & this is only for educational purposes.
.
Don't forget to like the idea, if you think it's helpful.

Possible Up Movement From Here - FlagBuy half of the amount @4120, Buy more @4155-60
Target - 4500++
Duration - 1-1.5 months
SL - <3138 (closing point)
Pattern - Flag

Britannia Industries - Target - 4000Why and when to enter is mentioned in the chart itself.
Consult your financial advisor. This is just for educational purpose.

Britannia - For Early BuyLooks change in trend finally
Break of trend Line
Entry above 3700 only with volume break
Risk to Reward - Excellent

HIGHEST PROBABILITY POSITIONAL TRADING SETUP IN BRITANNIAReasons to BUY now
1.WEEKLY TIME FRAME ANALYSIS:
.Breakout from FLAG and POLE pattern / Parallel Channel Pattern with good volumes and is now retesting it with low volumes
.RSI is 48 which indicates long term strength
.EMA 52 rejection
.0.618 Fib ratio rejection
2.DAILY TIME FRAME:
.EMA 200 Support
.BULLISH engulfing candle pattern after a false breakout of EMA 200.
NOTE: This is a positional trade and will take time to perform and give targets...but this is the safest trade one can take in this market.The stock might also give a false breakdown from these levels and then head higher as it is a bull market and an uptrending sector stock...
FOLLOW me for more such content ahead...Till then,
HAPPY TRADING :)

Looking good above 3926Looking good above 3926
Currently its taking support and showing sign of reversal.
Good Risk to Reward

Britannia Industries LimitedBullish flag pattern in Britannia Industries Limited. wait for the breakout.

Buy Britannia above 3875Britannia looks good to buy if sustains above 3875 for the marked targets on the chart until 3810 is intact on the downside on a closing basis.
To motivate me, Please like the idea If you agree with the analysis.
Happy Trading!
InvestPro India Team

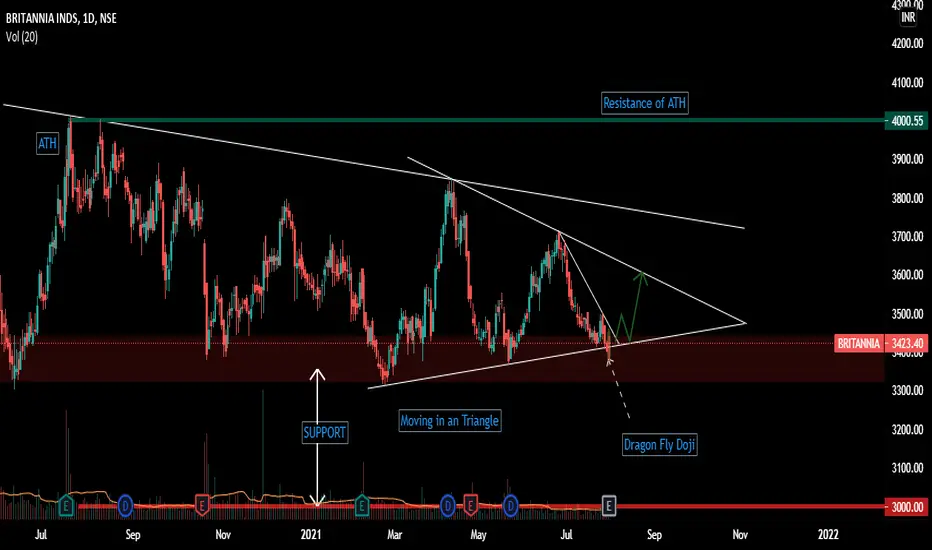
BRITANNIA 1D Time Frame AnalysisBRITANNIA 1D Time Frame Analysis
- Strong Support near 3300-3400 and psychological support of 3000
- Moving in the symmetrical triangle since March
- And a possible Double Bottom near support
- Most probable chances are it will bounce from here and rally towards 3600
- More Direction will be clear after touching the upper line of the triangle
- Psychological Resistance of 4000 at top and also previous ATH level
Britannia AnalysisBUY Britannia around 4000
Britannia has given a breakout above 3998.
Target:- 4640


Britanniatrend of Britannia looks quite strong so buy on dips
buying range is around 4050
stop loss is below 4000
target can easily be 4200++

Britannia : Buy WatchlistStock seems to be consolidating in a tight range and could be bought on a breakout above 4025.9 if supported by volumes. Company has posted flat sales and lower profit growth YOY for the quarter ended June 2021.

BRITANNIA intraday shorting setuphello traders
i am not a financial advisor
pls manage ur risks
thank you
