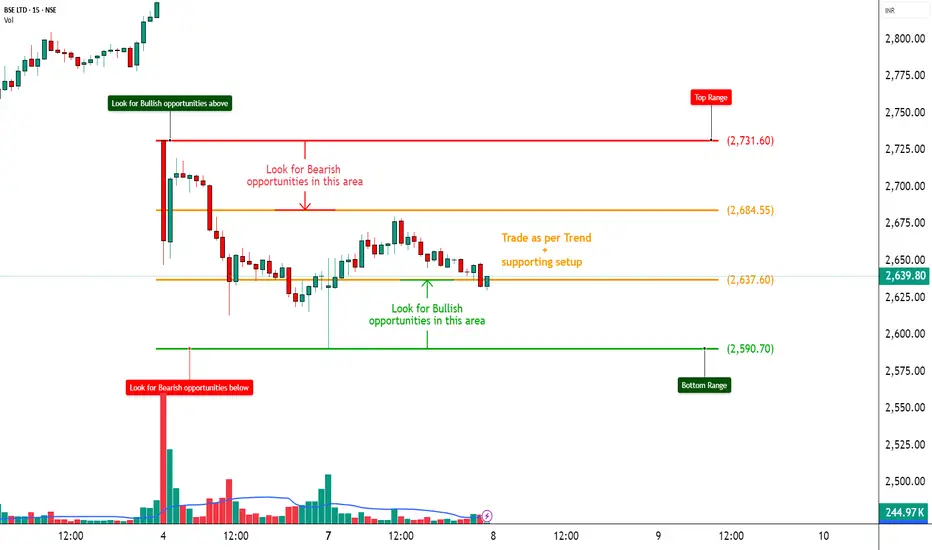
BSE – Heavy Call Writing Indicates Resistance Ahead________________________________________
📈 BSE – Heavy Call Writing Indicates Resistance Ahead | OI + Price Action Analysis
🕒 Chart Type: 15-Minute
📆 Date: July 7, 2025
________________________________________
🔍 What’s Catching Our Eye:
BSE is trading near ₹2636, and the Option Chain is showing aggressive Short Build-Up on Calls from 2650 to 3000, clearly highlighting a resistance zone above current price. Meanwhile, Put writers are unwinding, especially at ₹2600 PE, confirming weak bullish conviction. Traders are playing defensively with bearish bias dominating.
________________________________________
📌 What We’re Watching For:
If BSE breaks below ₹2600, we may see a quick slide toward ₹2550–2500. However, a sharp breakout above ₹2700 with strong volume may trigger a round of short-covering. Until then, upside looks capped due to excessive Call writing.
________________________________________
📊 Volume Footprint:
Options activity is backed by strong volume —
• Over 8.9k contracts at ₹2700 CE
• Over 8.1k contracts at ₹2800 CE
• Over 7k contracts at ₹3000 CE
→ Traders are betting on price staying below 2700–2800 levels, creating a strong supply wall.
________________________________________
📈 Option Chain Highlights:
• Calls (Short Build-Up):
o ₹2700 CE: +81,375 OI | Price ↓ 8.82%
o ₹2800 CE: +18,375 OI | Price ↓ 11.07%
o ₹3000 CE: +77,250 OI | Price ↓ 16.60%
o ₹2650 CE: +38,250 OI | Price ↓ 8.01%
• Puts:
o ₹2600 PE: -42,375 OI | Price ↓ 10.94% → Long Unwinding
o ₹2500 PE: +102,375 OI | Price ↓ 16.55% → Short Build-Up
📌 Inference:
Bulls are on the back foot. CE writers are dominating across all key strikes, and only the 2500 PE is showing fresh interest — which is far from spot, indicating potential room for further downside.
________________________________________
🔁 Trend Bias:
🔴 Bearish to Neutral – Unless 2700 breaks cleanly
________________________________________
🧠 Trade Logic / Reasoning:
Every CE strike from ATM to OTM is under short build-up — that's a clear ceiling forming. With no visible strength in Put writing near spot, the path of least resistance appears to be on the downside. Keep a close eye on ₹2600.
________________________________________
📍 Important Levels to Mark:
🔺 Top Range (Resistance): ₹2731.60
🔻 Bottom Range (Support): ₹2590.70
________________________________________
🎯 Trade Plan (Educational Purpose Only):
✅ Best Buy (Equity): Only if BSE crosses ₹2700 with volume
✅ Best Sell (Equity): Below ₹2600 for target ₹2550–2500
✅ Best CE to Long: ❌ None – All major Calls under Short Build-Up
✅ Best PE to Long: ₹2500 PE – Showing fresh bearish positioning
🟢 Demand Zone: NA
🔴 Supply Zone: NA
⚠️ Invalidation Below:
Bullish view invalidated if price sustains below ₹2600
________________________________________
⚠️ Disclaimer:
This analysis is for educational purposes only.
STWP is not a SEBI-registered advisor.
No buy/sell recommendations are made.
Please consult your financial advisor before trading.
STWP is not responsible for trading decisions based on this post.
________________________________________
💬 Spotting the weakness early helps plan smarter.
What’s your view on BSE – comment below ⬇️
🔁 Share this if you're tracking BSE this week
✅ Follow STWP for clean price + OI based setups
🚀 Be Self-Reliant | Trade with Patience | Learn with Logic
________________________________________
BSE
BSE Ltd - Breakout Setup, Move is ON...#BSE trading above Resistance of 4169
Next Resistance is at 6645
Support is at 2586
Here is previous chart:
Chart is self explanatory. Levels of breakout, possible up-moves (where stock may find resistances) and support (close below which, setup will be invalidated) are clearly defined.
Disclaimer: This is for demonstration and educational purpose only. This is not buying or selling recommendations. I am not SEBI registered. Please consult your financial advisor before taking any trade.

BSE - Cup and Handle - BO - DailyHere’s the **technical analysis** for **BSE Ltd. (Bombay Stock Exchange)** based on the chart you shared:
---
### 📊 **BSE Ltd. (NSE) Technical Analysis**
1. **Pattern Observed:**
- Beautiful **Cup and Handle** pattern formed and broken out.
- Previous consolidation (marked rectangle) now successfully cleared.
2. **Key Levels:**
- **Breakout Zone:** ₹5780.
- **Current Price:** ₹6564.
- **Immediate Resistance:** ₹6597 (today's high).
- **Major Target (as per pattern):** **₹7822**.
3. **Volume Confirmation:**
- Strong volume spikes during breakout — **very positive**.
4. **Target Projection:**
- Cup Depth ≈ ₹2057 points.
- Projected Target = Breakout level (₹5780) + Depth (₹2057) = **₹7822**.
5. **Support Levels:**
- ₹5780 (important support now).
- ₹5000 zone (in case of major correction).
---
### 📈 **Summary Table**
| Aspect | Detail |
|:------|:-------|
| Pattern | Cup and Handle |
| Breakout Level | ₹5780 |
| Current Price | ₹6564 |
| Immediate Resistance | ₹6597 |
| Major Target | ₹7822 |
| Support | ₹5780 |
| Bias | **Very Strong Bullish** |
---
### 📋 **Example Trade Setup**
- **Entry:** Hold/Buy on dips near ₹6300–6400 (if retracement happens).
- **Stop Loss:** ₹5700 (safe, below breakout point).
- **Target 1:** ₹6597.
- **Target 2:** ₹7822.
---
### 🧠 Observations:
- BSE Ltd has **already given a sharp move** post-breakout, so a minor retracement or consolidation can happen before the next leg higher.
- RSI and momentum indicators would likely show strong overbought readings — **normal in strong trends**.
---
**Summary:**
✅ **BSE Ltd.** has already **triggered a breakout** and looks extremely **strong towards ₹7822** in the coming weeks. 🚀
✅ Only condition: Ideally, fresh entries should be cautious near highs — **buy on minor dips** or wait for a little consolidation.
---

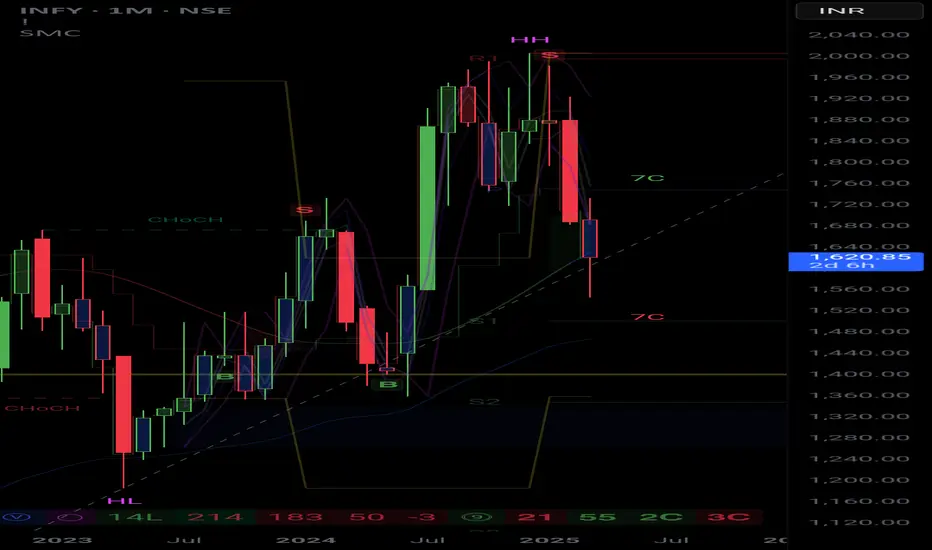
Infosys (INFY) Stock Forecast – March 2025Infosys (INFY) Stock Forecast – March 2025
Current Price: ₹1,619.50
Timeframe: Monthly Chart (1M)
Technical Analysis & Forecast
1. Trendline Support: The stock is currently testing a key trendline support on the monthly chart.
2. Breakdown Possibility: If INFY closes below this trendline, it may head towards the ₹1,400 level, aligning with the S2 support zone.
3. Resistance Levels: The recent rejection from ₹1,850-1,900 suggests strong selling pressure at those levels.
4. Market Structure:
Lower highs (LH) formation indicates a possible bearish continuation.
Change of character (ChoCH) signals uncertainty in trend direction.
5. Indicators:
Moving Averages: INFY is testing its long-term moving averages. A break below these could accelerate the downside.
Volume & Momentum: Selling pressure has increased, and bulls need to reclaim key resistance levels for a recovery.
My View
INFY is taking trendline support this month. If this support is broken, we can expect ₹1,400 as the next downside target. However, if buyers defend this level, a rebound towards ₹1,750 is possible.
Disclaimer
This analysis is for educational and informational purposes only. It is not financial advice. Please conduct your own research or consult with a professional before making any trading decisions.
BSE : Trading Sideways with HIGH IV- Current Ratios : P/E ~ 84 (5 yr average of ~37.5), PEG ~ 5, P/BV ~ 21 (5 yr average of 3.2)
- Technically, BSE has gone into a consolidation within a range of 6200 to 5000 since Dec-2024..
- Yesterday’s bounce was due to Goldman-Sachs purchase in the stock, and momentum can push it to test 6000-6200 levels soon.
- A significant direction in BSE stock prices will only emerge, once it breaks this consolidation range.
- However, this seems like a nice setup for Option traders to trade this range., as the Implied Volatility has also jumped significantly.
#stoxsense #bse #learntradingwithsudhir

BSE Bombay Stock Exchange Technical👉🇮🇳As per recent data on chart of #BSE #BombayStockExchange has shown significant trading volumes, especially in derivatives like options and futures, indicating active technical trading. The Sensex has been noted for setting new records, suggesting bullish trends that technical analysts would interpret through various indicators. but in my view top has been made please find the 📉chart for your reference.
#bseltd ❣️ #renderwithme #stockmarketsindia #ShareMarket #Nifty #Nifty50 #MarketNews

BSEafter moving partially sideway to bullish it has given fresh BO
if 5400 is saved this may given good returns from here

BSE TRENDLINE BREAKOUTBSE breaking trendline resistance
in this #stockmarketcrash
good volume,breaking 20 ema
strong rsi,rsi divergence
#target 5830 after breaking 5500
sl 5000
NO BUY/SELL RECOMENDATION

Sensex: Double Bottom BrokenThe Sensex has broken the double bottom support at 77,575, signaling a bearish breakdown structure. The next key level to watch is 76,000, which is now on the radar for potential testing.
Disclaimer:
This analysis is for informational purposes only and does not constitute financial advice. Always conduct your own research and consult a professional financial advisor before making any trading or investment decisions.

Metal Index: Ascending Triangle Broken, Testing Support LevelsDescription :
The CNS Metal Index recently broke below the 5th pivot of an ascending triangle pattern. This signals a potential bearish shift in momentum. The next key level to watch is the support zone around 8100. If this level is tested and broken, it could indicate further downside potential.
Traders should watch for confirmation signals, such as increasing volume on the breakdown or a sustained close below 8100, before making decisions. Conversely, if the index rebounds above the broken triangle line, it might invalidate the bearish scenario and suggest a consolidation phase.
Disclaimer :
This analysis is for informational purposes only and does not constitute financial advice. Always conduct your own research and consult with a professional financial advisor before making any trading or investment decisions. Trading involves significant risk and may result in substantial losses.

Technical Analysis of Gopal Snacks Ltd....TRADE FOR LATERINVEST BEFORE READ CAREFULLY / TAKE TRADE ON YOUR OWN RISK
RISK~REWARD PROFILE = 5.91:1
NSE:GOPAL SANEKS Technical chart Observations:-
~Price Correction:-
The stock corrected around 29%, possibly due to the negative news (fire in a warehouse).
The price appears to be approaching a strong psychological support level at ₹335.
~Pattern Formation:-
A potential Head and Shoulders pattern is visible, signaling a bearish reversal that already played out.
The price dropped significantly post-pattern completion.
~Support Level:-
Key support is around ₹322.80, which is highlighted as the entry point for a possible bounce.
Stop-loss (SL) is marked at ₹304.50 to limit downside risk.
~Target Levels (TP):-
~TP1: ₹362.30
~TP2: ₹386.35
~TP3: ₹430.95
~Volume:-
The trading volume on the recent downtrend is moderate, indicating cautious selling.
~Trend:-
Currently in a downtrend but nearing a critical psychological support zone.
Trading Strategy:
Wait for Confirmation: Enter the trade only if the price shows a clear bounce or reversal signs at the ₹322.80 level.
~Risk-Reward:-
Stop-loss: ₹304.50 (downside ~₹18.30 per share).
Target 1 (TP1): ₹362.30 (upside ~₹39.50).
Risk-reward ratio is favorable if TP1 is achieved.
~Notes:-
This is a counter-trend trade (going against the dominant downtrend), so caution is advised.
Monitor closely for any trend continuation or reversal indicators (e.g., candlestick patterns or volume spikes).
The highlighted targets (TP1-TP3) should be treated as milestones—book partial profits at each.
Final Note:
This chart suggests a well-structured trade setup, but execution depends on confirmation of price action near the support zone. Traders should monitor market sentiment, news updates, and technical signals before entering the trade.
Disclaimer:
I am not a SEBI-registered advisor. These levels are for educational purposes only. Please trade at your own risk. Consult a professional financial advisor for tailored advice. Like and share if you found this helpful!
LIKE,SHARE,SUBSCRIBE @Alpha_strike_trader

SIEMENS BEARISH TREND ANALYSIS (SHORT)NSE:SIEMENS
SIEMENS BEARISH TREND ANALYSIS
Key Levels:
Entry Point: ₹6,559.45
Stop Loss (SL): ₹6,732.85
Target Points:
TP1: ₹6,339.95
TP2: ₹6,143.60
TP3: ₹5,747.50
Analysis:~
Trend Overview:
Siemens is showing a bearish trend, confirmed by the price breaking an 8-month support level. The chart highlights potential downside targets with a disciplined stop-loss placement.
Support and Resistance:
The price has failed to sustain above the long-term support level, which has now turned into resistance.
The trend suggests potential further decline toward the specified targets.
Risk Management:~
Stop Loss at ₹6,732.85 ensures risk is minimized if the trade goes against the trend.
Target levels are spaced for progressive profit booking.
Chart Insights:~
Bearish Confirmation:
Siemens has turned bearish, breaking below its 8-month support zone, signaling potential further downside movement.
Resistance:~
The previous support level now acts as resistance.
A stop loss is placed slightly above this level to mitigate risk in case of trend reversal.
Profit Targets:~
TP1 and TP2 offer conservative profit levels, while TP3 provides a more aggressive downside target.
Trend Direction:
The 50-day and 200-day moving averages are sloping downwards, indicating sustained bearish momentum.
Disclaimer:
I am not a SEBI-registered advisor. This analysis is for educational purposes only. Trade at your own risk. Please consult a professional financial advisor before making trading or investment decisions. Thank you! Like and share if you found this helpful.
Like,share,subscribe @Alpha_strike_trader

Lupin Breakout: A New Highs Journey Begins!Hello everyone, i hope you all will be doing good in your life and your trading as well. Today i have a Lupin stock which has caught the market's attention with a powerful breakout from its resistance zone. Backed by increasing volume and bullish momentum, this pharmaceutical giant is showing signs of a potential rally. Let's dive into the chart to explore the opportunities.
1. Chart Overview
The chart appears to be for LUPIN LTD on a daily timeframe (1D).
The key focus is on price action with clearly defined support and resistance zones.
Indicators used include the RSI (Relative Strength Index) at the bottom of the chart.
The price is currently trading at ₹2,311.35, up by +3.75% for the day.
2. Key Levels Highlighted
Support Zone (Grey Band)
The support zone is marked around the ₹2,000–₹2,100 level, acting as a base where buyers consistently step in.
The price bounced off this zone multiple times, confirming its strength.
Resistance Zone (Grey Band)
The resistance zone is marked around ₹2,300–₹2,350, where sellers have historically prevented price from moving higher.
The recent breakout indicates strong bullish momentum.
Stop Loss (₹2,222)
A stop loss is suggested at ₹2,222, slightly below the resistance zone.
This is to manage risk in case the breakout fails and the price reverses.
Targets
1st Target: ₹2,490 : This is a realistic level based on previous price action and the measured move.
2nd Target: ₹2,678: This is a more optimistic target if the price continues its uptrend.
3. Price Action
Breakout: The price has broken above the resistance zone with strong bullish momentum, as seen by the large green candle and increased volume. This breakout suggests a potential continuation of the uptrend.
4. Volume Analysis
Volume Surge: There is a noticeable increase in volume during the breakout, indicating strong buying interest. Volume confirmation is a good sign that the breakout is genuine.
5. RSI Analysis
Current RSI: 71.94
The RSI is above 70, indicating an overbought condition. While this signals strong momentum, it may also suggest caution as a short-term pullback is possible.
Previous Bearish Divergences: Marked in red, showing past instances where the RSI was high but price reversed.
Bullish Confirmation: Marked in green, showing that RSI and price are aligned with the current uptrend.
6. What Does This Mean?
The breakout above resistance indicates a potential shift in market sentiment, favoring buyers.
The targets suggest significant upside potential, but the RSI warns of possible short-term profit booking.
7. Possible Outcomes
Bullish Scenario:
If the price holds above the resistance zone and sustains higher levels, it could move towards the 1st and 2nd targets.
Bearish Scenario:
If the price closes below ₹2,222 (stop loss), it may revisit the support zone around ₹2,000–₹2,100.
8. Suggested Actions
Entry: On sustained breakout above ₹2,311 (current level).
Stop Loss: Strictly at ₹2,222 to minimize losses.
Profit Booking: Gradual booking at ₹2,490 and ₹2,678.
Lupin has broken out of its resistance zone with strong momentum, signaling a potential uptrend. With solid fundamentals and technical confirmation, the stock looks poised for higher levels. Keep an eye on the targets and manage your risk with the defined stop-loss. Happy Trading!
Disclaimer:- Please always do your own analysis or consult with your financial advisor before taking any kind of trades.
Dear traders, If you like my work then do not forget to hit like and follow me, and guy's let me know what do you think about this idea in comment box, i would be love to reply all of you guy's.
Thankyou.

Bse India - Expecting PullbackStock currently in HH HLs in all TFs
Recently broke a resistance area of 4800-5000 with a very strong daily candle
Right now in a pull back phase
So expecting the same area to work as a support zone
Trend lines also suggests the same
Entry Sl accordingly when reaches

BSE LONG 16% SWING SETUP 1-3 MONTHSA well explained chart, with Target SL and Reason behind it.
It is in impulsive wave and targets are based on fibonacci levels.
Proper Stop loss of 8% for Risk Management.
Entry Criteria above today's closing or in Demand Zone.
Timeline 1-3 Months

Garware Technical Fibre in Extended Wave 3NSE:GARFIBRES
Garware Technical Fibre is in final wave of extended wave 3. The current stock movement indicates that it is currently in the fourth wave of the extended third wave, and it is in the process of forming a triangle pattern. Trangle always form in wave 4. I have labelled wave 4 triangle with ABCDE.
Entry point is at high of wave D :- 3375/-
Target :- 4906/-
Profit Probability :- 45%

ioc is getting bearishioc is at the supply zone the price will go lower because the price is respected the supply zone

LINDE INDIA day timeframeLINDE INDIA day timeframe NSE:LINDEINDIA
buy this stock, but there hasn't been a green candle yet. If a strong bullish green candle forms, indicating upward momentum, i will proceed with the purchase. This will give me confidence that buyers are gaining control, aligning with my entry criteria. Until then, I'll stay cautious and observe.

JSWENERGYReasons to consider going long on JSWENERGY
1. Bullish Reversal Patterns:
• The green candle on horizontal support could signify a potential reversal.
2. 200-Day Moving Average as Support:
• The 200-day moving average is a key long-term support level. A bounce from this level often attracts institutional interest and signals strength in the stock.
3. Relative Strength vs. Nifty:
• Positive relative strength suggests that JSWENERGY is outperforming the broader market, making it a strong candidate for an uptrend continuation.
4. Sector Support:
• Nifty Energy index taking support on its horizontal support increases the likelihood of a sector-wide bounce, which could positively impact JSWENERGY.
Waiting for confirmation with a CHOCH (Change of Character) on the 1-hour timeframe is a solid approach. Here’s a structured plan based on that:
1. Wait for CHOCH on 1-Hour: The CHOCH would confirm a potential shift in market structure, signaling the beginning of bullish momentum. This adds more reliability to the trade setup.
2. Entry on Retest / FVG / IFVG:
• Retest: After the CHOCH, a retest of the breakout zone could provide an optimal entry, ensuring the breakout holds.
• Fair Value Gap (FVG): If an FVG appears within this structure, entering here could capture the shift in momentum at a lower-risk point.
• Imbalance Fair Value Gap (IFVG): An entry on an IFVG could further refine your risk-to- reward ratio, especially if market liquidity fills these gaps.

HDFC LIFE 1 DayHDFC life insurance in 1 day time frame
It shows that :
the stock comes in golden zone and make bullish anglefing pattern
also it reaches the 400 EMA
it's also reached the previous resistance to retest it
there is a trend line and it touches
RSI is below 40
there is five confirmations also it is a good opportunity to trade in HDFC life insurance

BSE Broke Major LevelsNSE:BSE broke today's Cup and Handle Pattern, although the Handle Was the same size as the cup. Good price action continues as per my previous idea.
🙋♀️🙋♂️If you have any questions about this stock, feel free to reach out to me.
📌Thank you for exploring my idea! I hope you found it valuable.
🙏FLLOW for more
👍BOOST if useful
✍️COMMENT Below your views.
Meanwhile, check out my other stock ideas below until this trade is activated. I would love your feedback.
Disclaimer: This analysis is intended solely for informational and educational purposes and should not be interpreted as financial advice. It is advisable to consult a qualified financial advisor or conduct thorough research before making investment decisions.

BSE ascending triangleChart -> BSE Daily
Ascending triangle breakout with volume.
CMP: 5200
Good Range To Buy: 4800 to 5200
Targets: 5600, 6000
SL: 4600 Daily Close
Disclaimer: This is for educational purposes only, not any recommendations to buy or sell. As I am not SEBI registered, please consult your financial advisor before taking any action.

Indian energy exchange in weekly analysisIndian energy exchange in weekly analysis
It touches the previous support RSI is below 40 and MACD is also crossover signal line as per technical analysis
company also give good quarterly result is expected to give quarterly result as well as in future
do your study and then invest
