BSE- Correction phase startsAfter more than 2000% rally in 2 years, BSE finally formed a double top pattern in monthly. The target for this pattern is 1241 which is the confluence of fib 0.618 + Monthly support + blue channel support.
Note: This is for educational purpose and not a trade recommendation.
Bseindia

BSE LTD Intraday| 23 Dec 2025| +45 Points Clean Short Setup23 Dec 2025 | Simple & Easy BTR Indicator Setup
Consistency comes from simplicity — and today BTR proved it again.
Another smooth intraday short trade executed perfectly in BSE LTD, with clear entry, logical stop-loss, and disciplined exit.
🔍 Trade Overview
• Stock: BSE LTD
• Date: 23/12/2025
• Timeframe: 15-Minute
• Indicator Used: BTR Indicator ONLY
🔴 Entry Logic (Short)
✔ BTR generated a clear BEARISH signal
✔ Breakdown after rejection from higher levels
✔ Momentum shifted completely in sellers’ favor
🔻 SHORT ENTRY: 2755
🛑 Stop-Loss (Risk First)
📌 SL placed above recent Swing High
📌 Clean structure-based stop
📌 No guesswork, no emotional SL movement
🎯 Exit Execution
✔ Follow the system, follow the exit
✔ Price continued lower smoothly
🟢 EXIT BOOKED: 2715
📉 TOTAL PROFIT: +45 POINTS
🧠 Why This Trade Was Easy
✔ Clear BTR signal
✔ Strong bearish follow-through
✔ Proper SL placement
✔ No over-trading, no indicator clutter
📌 Strategy Rule
❌ No prediction
❌ No noise
❌ No multiple indicators
✅ Only BTR Indicator
✅ Follow entry & exit rules
✅ Trade becomes effortless
🔥 Final Thought
Trading is not about being right every time —
it’s about executing the same edge repeatedly.
BTR continues to deliver high-probability intraday setups in both directions.
📊 Follow for daily BSE intraday trades
💬 Comment / DM if you want to trade using BTR Indicator
Simple Rules. Clean Charts. Consistent Profits. 📉📈 NSE:BSE
📌 You can find the BTR Indicator in my TradingView profile → Scripts section
👉 Open my profile
👉 Go to Scripts / Indicators
👉 Add BTR Indicator to your chart
👉 Trade with zero noise & clear signals
Follow BTR. Follow Discipline. Trade Simple. ✅
If you want, I can also give you:
• A pinned profile bio line
• A comment reply template for followers
• A step-by-step “How to use BTR” post
Just tell me 👍

BSE LTD Intraday 22 Dec 2025— +80 Points Bull Setup (BTR)HURRY! Another high-probability intraday trade completed successfully in BSE LTD.
No complexity. No overthinking. Only one rule — Follow BTR Indicator.
🔍 Trade Snapshot
• Stock: BSE LTD
• Date: 22/12/2025
• Timeframe: Intraday
• Indicator Used: BTR Indicator ONLY
🟢 Trade Execution
✔ BTR Indicator generated a clear BUY signal
✔ Entry provided exactly at 2700
✔ Strong bullish momentum followed immediately
🟢 BUY ENTRY: 2700
🎯 Exit Discipline
📌 Follow the system — not emotions
📌 Exit planned and executed as per BTR logic
🔴 INTRADAY EXIT: 2780
📈 TOTAL PROFIT: +80 POINTS
🧠 Strategy Rule (Very Important)
❌ No extra indicators
❌ No noise
❌ No prediction
✅ Only BTR Indicator
✅ Follow the signal
✅ Book profit when system says EXIT
🧠 Strategy Rule (Very Important)
❌ No extra indicators
❌ No noise
❌ No prediction
✅ Only BTR Indicator
✅ Follow the signal
✅ Book profit when system says EXIT
📊 Follow for more high-accuracy intraday setups
💬 Comment if you want to trade using BTR Indicator

BSE Ltd –19 Dec 2025-Intraday Bearish Setup | 15 Points CapturedMarket Structure Insight
After an initial upside move, price failed to sustain above the key Fibonacci retracement zone (0.5–0.618). This area acted as a strong supply zone, clearly visible on the chart.
🔔 BTR Indicator Signal
BTR generated a clear Bearish Signal inside the supply zone
Multiple rejection candles confirmed seller dominance
Momentum shifted from bullish retracement to bearish continuation
🧭 Trade Plan
Short Entry: Near Fib 0.618 rejection zone, BTR Generate Short Signal at 2700
Stop Loss: Above supply zone high
Target: Demand zone / previous low
Exit: Near 2685 as price entered demand zone
✅ Result: +15 Points Intraday Gain
📌 Why This Setup Worked
✔ Fibonacci retracement confluence
✔ BTR bearish confirmation
✔ Lower high formation
✔ Strong demand zone for clean exit
✔ Disciplined risk management

BSE Intraday Trade — 18 Dec 2025BTR Bullish Setup + Fibonacci Precision | +30 Points Booked
Once again, BTR Indicator delivered a clean bullish intraday opportunity in BSE Ltd, proving the strength of rule-based trading over emotions.
This trade was further refined using Fibonacci Retracement, which helped in defining clear entry confidence, precise stop-loss, and a high-probability exit zone.
🔍 Trade Details
• Stock: BSE Ltd
• Timeframe: 15-Minute
• Setup Type: Bullish (BTR Confirmed)
• Market Condition: Pullback into Demand Zone
🟢 Entry Logic
✔ BTR generated a bullish signal inside a strong demand zone
✔ Price respected 0.5 – 0.618 Fibonacci retracement
✔ Strong bullish candle confirmed buyer presence
🟢 Buy Entry: Near 2670 zone
🎯 Exit & Target Planning
📌 Fibonacci Extension Used for Exit
• 1.618 Fib Level acted as a high-probability exit zone
• Price reacted immediately from this level
🔴 Exit Booked Near: 2700 zone
📈 Net Gain: +30 Points (Intraday)
🧠 Why This Setup Worked
✔ BTR provided directional clarity
✔ Fibonacci gave structure for SL & Exit
✔ Demand zone ensured low-risk entry
✔ System-based exit avoided overtrading
📌 Key Takeaway
Profitable trading is not about prediction.
It’s about alignment:
Signal + Structure + Risk Control
BTR does exactly that — again and again.
📊 Follow for daily intraday trade ideas
💬 DM for BTR Indicator & complete trading rules
Trade what you see. Exit where the system tells you. Stay disciplined. 🔥📈
#BSE #NIFTY #INTRADAY #BULISH #BUY #BSESTOCK #BSEINDIALTD

My BSE Intraday Short Trade Setup — 08 Dec 2025After a successful intraday win on 05 Dec 2025, where 30 points were captured in BSE, I have decided to post my intraday trade setups daily with full transparency and structure.
Staying consistent with the same rules and discipline, BTR Auto Buy/Sell Indicator has now identified another high-probability intraday SHORT setup in BSE on 08/12/2025.
🔍 Market Context
✔ Stock: BSE Ltd
✔ Timeframe: 15-Minute Chart
✔ Volatility: Ideal for intraday trading
✔ Structure: Price reacted from Supply Zone & Point of Control
📊 Indicator Used
🚀 BTR Auto Buy/Sell Signal System
✔ Approx. 70% win rate
✔ Clear bearish signal generation
✔ Works best with structure & zones
🎯 Trade Plan (Short Setup)
🔴 Entry:
– Short entry triggered when BTR generated a Bearish signal
– Signal formed near Supply Zone, adding strong confirmation
🛑 Stop Loss:
– Day Swing High
🎯 Targets:
– 25 / 50 / 75 / 100 points
– Partial booking recommended to protect profits
📉 Trade Outcome
✔ Breakdown followed immediately after entry
✔ Price respected supply zones
✔ Smooth intraday bearish continuation
✔ Disciplined exit near intraday support
This trade once again highlights the power of signal + structure + patience.
🧠 Key Lesson
Intraday trading is not about trading every move —
it’s about waiting for high-probability setups and executing without emotion.
Same stock.
Same indicator.
Same rules.
Different day — same consistency.
📌 What’s Next?
From now on, I will be posting daily intraday trade setups — both BUY & SELL — using the BTR Auto Buy/Sell System.
📌 Follow for daily live setups
💬 Private Message for BTR Indicator & trade logic
Trade smart. Stay disciplined. Let probability work. 📊🔥

BSE Intraday Winning Trade — +50 Points (Today) 15 Dec 2025Discipline + Structure + Signal = Consistent Profits
Today’s intraday session in BSE Ltd delivered another clean and controlled winning trade, capturing 50 points using my rule-based BTR Auto Buy/Sell Signal System.
This trade once again proves that following the system without emotion is the real edge in intraday trading.
📌 Trade Overview
• Stock: BSE Ltd
• Timeframe: 15-Minute
• Market Condition: Smooth intraday volatility
• Execution Style: Pure price-action + indicator-based
📊 Setup Logic
✔ Price reacted from a key zone
✔ BTR generated a clear trade signal
✔ Entry taken only after confirmation
✔ No prediction — only reaction
The market respected structure throughout the session, allowing the trade to move comfortably in our favor.
🎯 Trade Management
• Entry: On BTR signal confirmation
• Stop Loss: Day swing high/low (structure-based)
• Targets: 25 → 50 → 75 → 100 points
📌 50 points booked with discipline, without chasing or overtrading.
🧠 Key Learning
Intraday success doesn’t come from:
❌ Overtrading
❌ Guessing tops or bottoms
It comes from:
✔ Waiting for your setup
✔ Executing the plan
✔ Managing risk properly
Same stock.
Same rules.
Same mindset.
👉 Consistent results.
📈 Final Note
This is not about one trade —
it’s about repeating the same high-probability process every day.
📌 Follow for daily intraday trade ideas
💬 Private Message for BTR Indicator & strategy details
Trade smart. Stay disciplined. Let probability work. 🔥📊
NSE:BSE

BSE Looing good for Long callsBSE broke the Trend channel of almost 4months, looking good to take long call at around 2268 with stoploss at 1950 for the target at around 2800.
-- This is only for educational purpose, please do your own analysis before taking a call so you have confidence to hold the trade.

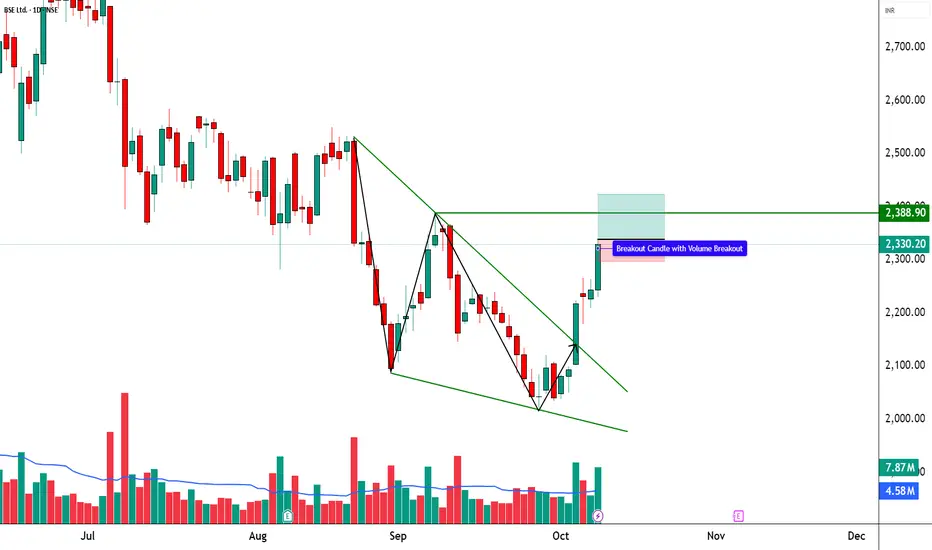
BSE | Intraday Bullish Setup📈 **BSE LTD | Bullish Breakout + SuperTrend Flip 🚀**
STWP Trade Analysis
🔹 **Entry Zone:** ₹2,328 – ₹2,334
🔹 **Stop Loss:** ₹2,296 (Risk ~₹32)
🔹 **Supports:** 2,305 / 2,265 / 2,232
🔹 **Resistances:** 2,388 / 2,423 / 2,450
🔑 **Key Highlights**
✅ Strong Bullish Candle — Breakout above consolidation with volume surge
✅ RSI & BB Expansion — Momentum revival confirmation
✅ SuperTrend Flip — Short-term trend turns bullish
✅ BB Squeeze-Off → Fresh volatility expansion underway
💡 **Learning Note**
This setup highlights how **volume-backed breakouts** aligned with **SuperTrend and RSI confirmation** provide high-probability entries. When volatility expands after a squeeze and price clears resistance with momentum, it often signals **institutional breakout strength** and **early trend continuation**.
⚠️ Disclosure & Disclaimer – Please Read Carefully
The information shared here is meant purely for learning and awareness.
It is not a buy or sell recommendation and should not be taken as investment advice.
I am not a SEBI-registered investment adviser, and all views expressed are based on personal study, chart patterns, and publicly available market data.
Position Status: No active position in BSE at the time of analysis.
Data Source: TradingView & NSE India (Past Chart Reference) (Historical levels)
Trading — whether in stocks or options — carries risk. Markets can move unexpectedly, and losses can sometimes exceed the capital you have invested.
Past performance or setups do not guarantee future results.
If you are a beginner, treat this as a learning example and practice with paper trades before risking real money.
If you are experienced, always assess your own risk, position sizing, and strategy suitability before entering trades.
Consult a SEBI-registered financial adviser before making any real trading decision.
By engaging with this content, you acknowledge full responsibility for your trades and investments.
________________________________________
💬 Found this useful?
🔼 Give this post a Boost to help more traders discover structured learning.
✍️ Drop your thoughts, questions, or setups in the comments — let’s grow together!
🔁 Share with fellow traders and beginners to spread awareness.
👉 “If you liked this breakdown, follow for more clean, structured setups with discipline at the core.”
🚀 Stay Calm. Stay Clean. Trade With Patience.
Trade Smart | Learn Zones | Be Self-Reliant 📊
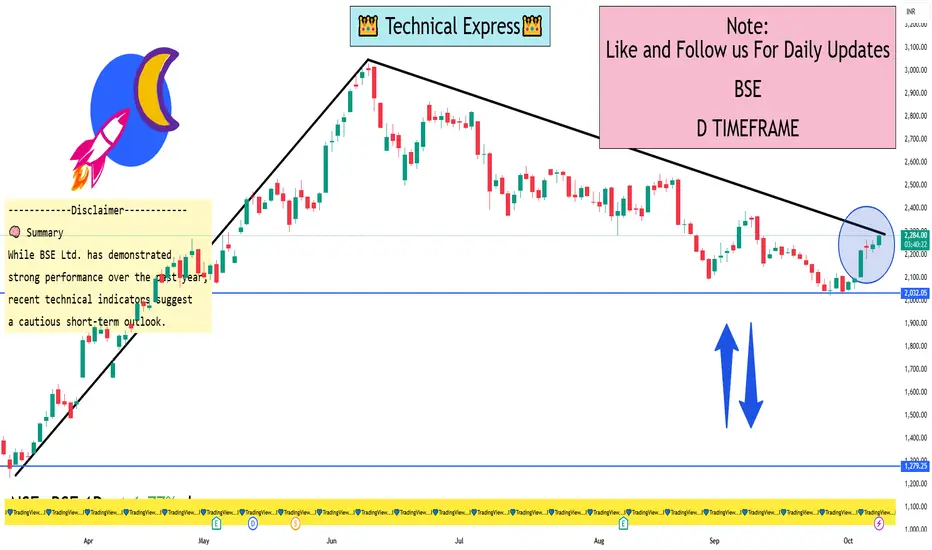
BSE 1 Day View📈 Daily Technical Indicators
RSI (14-day): 57.72 — Indicates a neutral to bullish momentum.
MACD: -19.21 — Suggests mild bearishness.
Stochastic Oscillator: 83.13 — Approaching overbought territory, implying caution.
Average True Range (ATR): Indicates low volatility, suggesting a stable trading environment.
ADX (14-day): 26.07 — Reflects a moderately strong trend.
🔄 Short-Term Outlook
On the 1-hour chart, BSE Ltd. is exhibiting a "Strong Sell" signal across both technical indicators and moving averages. This suggests a prevailing short-term downtrend, with the stock trading below its key moving averages.
📊 Key Levels to Watch
Support Levels: ₹2,230 (recent low) and ₹2,121 (intraday low).
Resistance Levels: ₹2,281 (recent high) and ₹2,300 (target price set by IIFL Capital).
🧠 Summary
While BSE Ltd. has demonstrated strong performance over the past year, recent technical indicators suggest a cautious short-term outlook. Traders should monitor key support and resistance levels closely and consider market conditions before making investment decisions.
BSE : LongThe price action shows a strong rally followed by a period of decline and consolidation.
Key horizontal support and resistance levels are marked, with the current price near the support zone, suggesting buyers are actively defending this area.
The descending trendline indicates a consistent pattern of lower highs, reflecting ongoing selling pressure.
Below, the MACD indicator reveals a recent attempt at bullish crossover, signaling potential upward momentum, but confirmation is awaited.
This setup is useful for monitoring possible trend reversals or continued weakness, and members are encouraged to note these patterns while making informed decisions.

Short term trend opens up in Nifty So on Thursday we studied that NSE:NIFTY would remain sideways with a bullish tone.
And that’s exactly what happened on Friday.
Nifty traded within a range in the first half and then moved up sharply in the second half, closing +57 points higher.
Closing above the previous day’s high is definitely a good price action sign.
But ideally, buyers’ volume should have matched that momentum too.
On Friday, buyers’ volume was up — but not strong enough to suggest a sharp move ahead. In fact, on the last 15-minute candle, sellers’ volume was higher by 10 million.
However, on short-term charts, net volume has turned green, which means any dip till 24800 will likely be bought quickly.
Now, Nifty’s Pivot stands at 24848. A drop below this could lead to another range-bound session tomorrow, with support at 24800.
Resistance for the day would be 24925, and any meaningful move will only come if this level is broken and sustained for at least one hour.
Since PP is tight, if a breakout happens with strong buyers’ volume, we could see a sharp rally upward.
For FnO stocks, we’ll continue tracking NSE:BSE and NSE:BHARATFORG .
Sector-wise, #Shipbuilding, #NBFC, and #AutoParts are looking good.
That’s all for the day. Take care and have a profitable tomorrow.
---
📊 Levels at a glance:
Pivot: 24848
Support: 24800
Resistance: 24925 (sustain > 1H = breakout)
Pivot Percentile: Tight (sharp rally possible on volume breakout)
Bias: Sideways to bullish, buy dips above pivot
Sectors to watch: Shipbuilding, NBFC, Auto Parts
FnO Focus: #BSE, #BHARATFORG

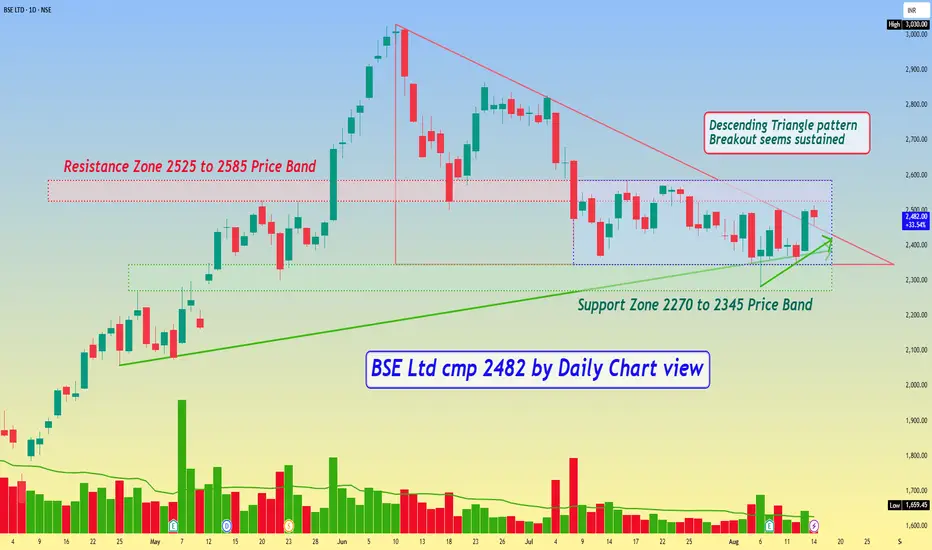
BSE Ltd cmp 2482 by Daily Chart viewBSE Ltd cmp 2482 by Daily Chart view
- Support Zone 2270 to 2345 Price Band
- Resistance Zone 2525 to 2585 Price Band
- Descending Triangle pattern Breakout seems sustained
- Stock seems trading within price range indicating Darvas Box setup
- Volumes seen gradually syncing closely with the average traded quantity
- Most known Technical Indicators BB, EMA, MACD, RSI, SAR seem trending positively
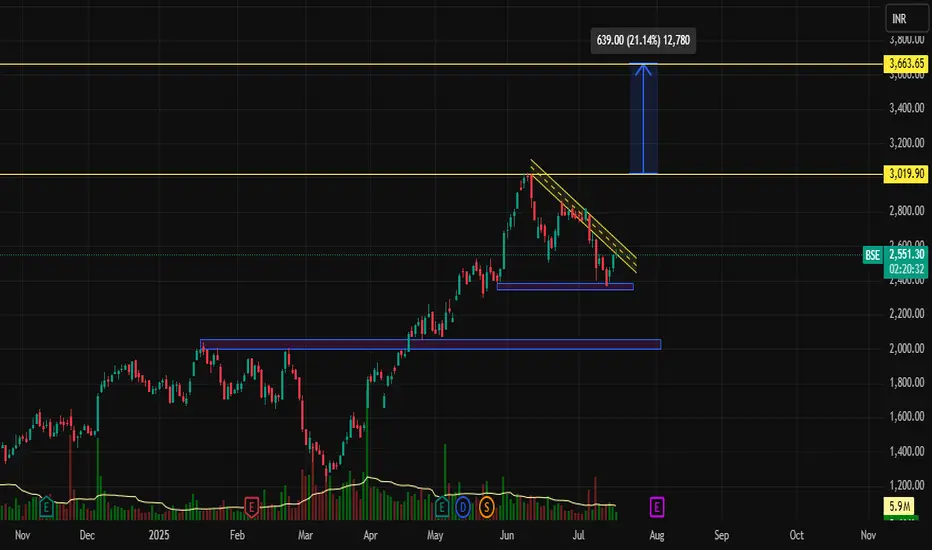
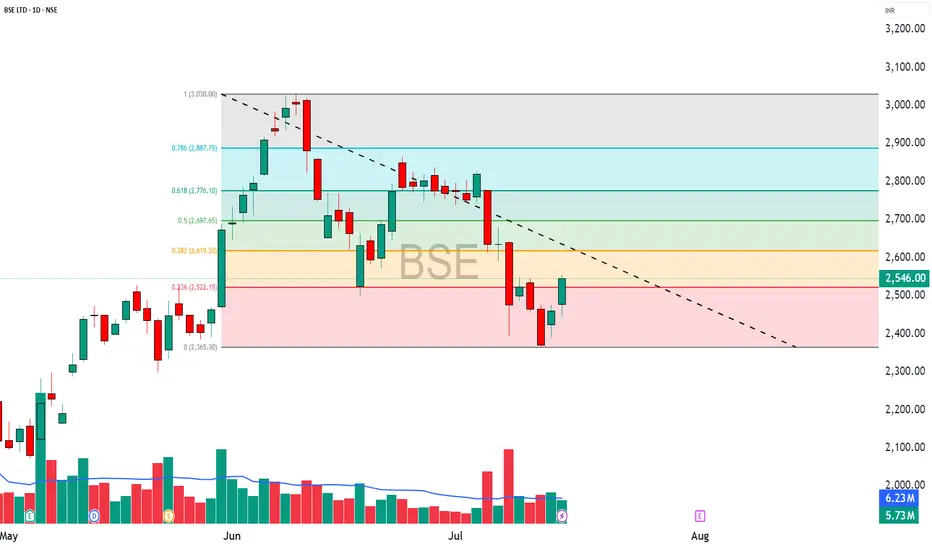
BSE | Falling Wedge Breakout Imminent? Potential Upside of 21%Stock: BSE (Bombay Stock Exchange)
Timeframe: Daily (1D)
Current Price: ₹2,547.90
Potential Upside: ₹639 (+21.14%)
Resistance Levels: ₹3,019.90, ₹3,663.65
Support Zones: ₹2,370 | ₹2,110
📌 Technical Analysis
1. Falling Wedge Formation (Bullish Reversal Pattern)
BSE is currently trading within a well-defined falling wedge pattern, a classic bullish reversal structure. The stock has been consolidating after a strong uptrend and is approaching the apex of the wedge, indicating a possible breakout.
Downward Sloping Resistance Line is being tested.
The support zone around ₹2,370 has held strong multiple times, creating a solid base.
2. Volume Analysis
Noticeably declining volume during the wedge formation signals a healthy consolidation phase.
A spike in volume on breakout would confirm strong buying momentum.
🔍 Breakout Target Projection
If BSE breaks out from the wedge resistance, the measured move suggests a potential upside of ₹639, bringing the target around:
📍 Target: ₹3,180–3,340 range
📍 Long-Term Resistance: ₹3,663.65 (next major hurdle)
🧠 Strategy Suggestion
Type Entry stop loss entry
Swing Trade ₹2,600–2,650 (after breakout confirmation) ₹2,370 ₹3,019 / ₹3,340 / ₹3,663
Note: Wait for daily candle close above the falling wedge with above-average volume for confirmation.
⚠️ Key Observations
🔹 Bullish momentum from previous uptrend still intact.
🔹 Price respecting demand zone at ₹2,370.
🔹 RSI near neutral – enough room for an upside.
🔹 Ideal breakout zone: Between ₹2,600–2,650
📅 Conclusion
BSE is showing a promising setup with a falling wedge pattern supported by strong demand zones. A successful breakout could lead to a 20%+ rally. Keep this stock on your radar as it nears a potential trend reversal.
📌 Disclaimer: This is not investment advice. Do your own research or consult with a financial advisor before investing.
Options Strategy Breakdown – For Educational Purpose Only________________________________________
📈 Options Strategy Breakdown – For Educational Purpose Only
🧠 Learn to Structure a Bull Call Spread Strategically
________________________________________
🔹 Stock Name: BSE
🔹 Spot Price: ₹2546
🔹 Lot Size: 375
🔹 Number of Lots: 1
🔹 Expiry Date: 31-July-2025
🕒 DTE (Days to Expiry): 16 Days
💡 Strategy Type: Bull Call Spread – Limited Risk | Limited Reward Option Structure
________________________________________
📘 Strategy Construction (Illustrative Example):
1️⃣ Buy Call Option – Strike: ₹2500 | Premium Paid: ₹125
2️⃣ Sell Call Option – Strike: ₹2600 | Premium Received: ₹76
🧮 Net Premium Outflow: ₹49
(₹125 - ₹76 = ₹49 * 375 = ₹18,375)
________________________________________
📊 Payoff Metrics (Illustrative & Hypothetical):
• 🔹 Breakeven Point: ₹2549.00
• 📈 Maximum Profit: ₹19,125 (When Spot ≥ ₹2600)
• ⚠️ Maximum Loss (Capital Deployed): ₹18,375 (if Spot ≤ ₹2500)
• 🔄 Real-Time PnL: Subject to market movement
• 🎯 Suggested Profit Booking Threshold: ₹18,375 (illustrative target)
• 🛑 Reversal Exit Point (Invalidation): Spot < ₹2487.75 (Support Violation)
________________________________________
📌 Why Learn This Strategy?
The Bull Call Spread is a risk-defined options strategy designed for moderately bullish views. It reduces premium cost compared to naked options and has a clearly capped loss and reward, making it suitable for learning proper risk management in derivatives trading.
________________________________________
🔍 Key Educational Takeaways:
• Helps manage premium exposure in trending markets
• Builds awareness of breakeven levels and invalidation points
• Encourages use of defined-risk structures over naked positions
• Promotes discipline and technical level-based exits
________________________________________
⚠️ Educational Disclaimer:
📢 This post is intended purely for educational and informational purposes only and does not constitute investment advice, recommendation, or solicitation to trade.
I am not a SEBI-registered investment advisor. All data shared above is illustrative and should not be considered as buy/sell advice.
Trading in derivatives involves risk. Please consult a SEBI-registered advisor before taking any financial decisions.
📘 Past performance or setup structure does not guarantee future results.
Always do your own research and use strict risk management.
________________________________________
💬 Want more educational breakdowns like this?
Drop a comment or message!
🔁 Share this with fellow learners to help them build structured option strategies.
✅ Follow @simpletradewithpatience for charts, clean setups, and educational content based on price action, zones, and risk-managed trades.
________________________________________
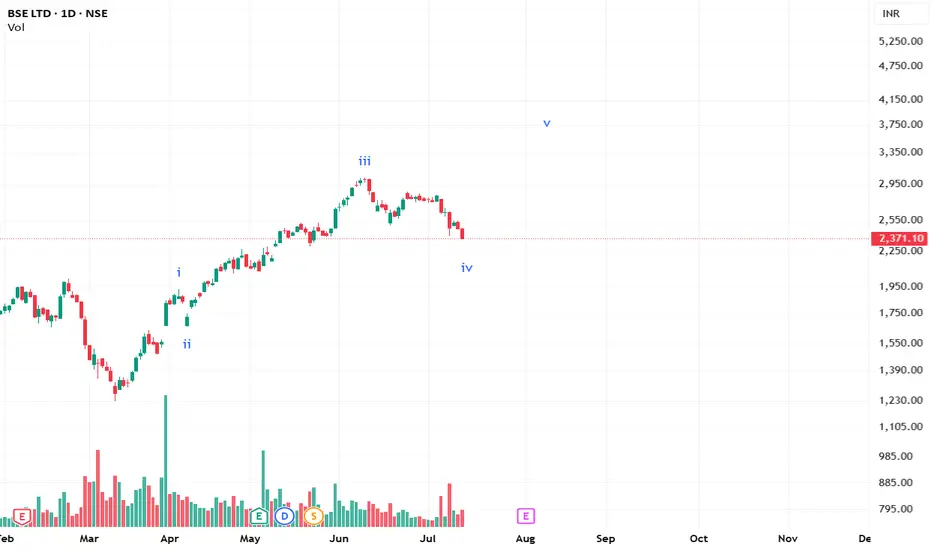
BSE is giving some good vibes now!A nice alternative wave 4 seems to be in progress in BSE. A confirmation is still needed to confirm the count!
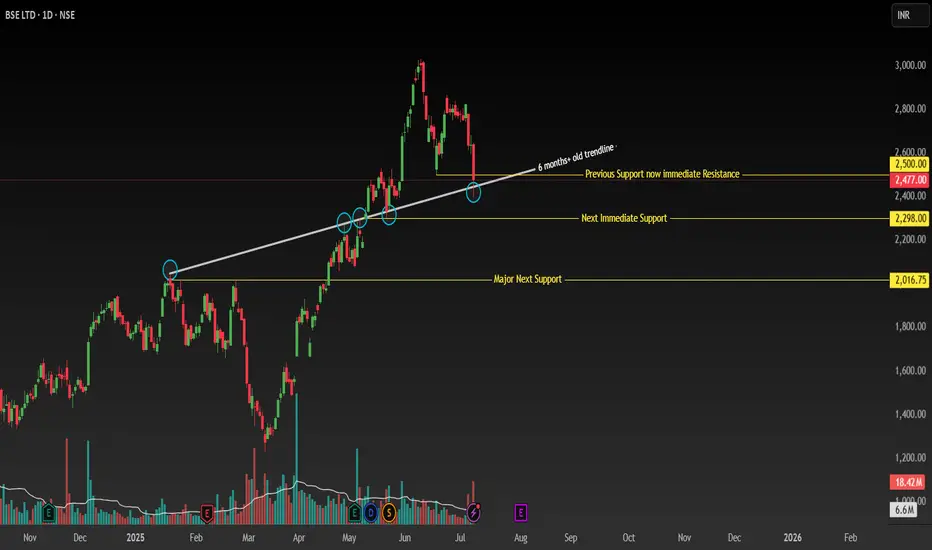
BSE - Support Break with Bullish Recovery SetupSymbol: BSE (Bombay Stock Exchange)
Timeframe: Daily
Key Levels:
✅ Breakdown: 2500 (closed below) → Next support: 2300 → 2000 (major).
✅ Bullish Anchor: Price > 200 MA + ascending trendline (Jan 20, 2025 breakout now support).
📊 Technical Structure
Critical Support Break:
-Daily close below 2500 (confirmed breakdown of key support).
-Next supports: 2300 (immediate) → 2000 (major swing low).
Bullish Anchors:
-Price above 200-day MA (long-term uptrend intact).
Ascending Trendline Support:
-Originating from Jan 20, 2025 (resistance until May 13 breakout).
-Now acting as dynamic support (resistance-turned-support).
Key Reversal Signal: Watch for reclaim of 2500
-Requires strong bullish candle + above-average volume.
-Confirms failed breakdown and resumption of uptrend.
🎯 Trading Plan
Scenario 1: Buy Dips (Conservative)
Entry Zone:
-Layer 1: 2300 (trendline + horizontal support confluence).
-Layer 2: 2000 (swing low + 200 MA reinforcement).
-Stop Loss: 1950 (below 2000 structure).
-Targets: 2500 → 2700 → 2900.
Scenario 2: Breakout Re-entry (Aggressive)
Trigger: Daily close above 2500 with: Bullish candle (preferably >1.5% gain).
-Volume ≥ 20% above 10-day average.
-Stop Loss: 2450 (below breakout level).
-Targets: 2700 → 2900 (measured move).
⚠️ Risk Management
Position Size: ≤3% capital per trade.
Invalidation Conditions:
-Close below 2000 (invalidates bullish thesis).
-Failed 2500 reclaim (weak volume/rejection candle).
Disclaimer: Not financial advice. Conduct your own due diligence. Past performance ≠ future results. Risk capital only.
🔥 Boost if this analysis helps your strategy!
💡 Comment below any stocks you want me to analyse next!
Assuming the mindset of Warren Buffett, let us evaluate BSE Ltd.📊 1. Understand the Business (Circle of Competence)
BSE Ltd. is one of India’s two major stock exchanges (along with NSE). It earns revenue from:
Listing fees
Transaction/clearing charges
Data dissemination
Subsidiary businesses (e.g., mutual funds, SME platform)
🔍 Buffett View:
The stock exchange business is a monopoly-like, high-moat business with few players.
It benefits from network effects – more listings attract more investors and vice versa.
It has low capital requirements to grow and high operating leverage – very Buffett-friendly traits.
📈 2. Financial Health (Conservative Analysis)
Let’s assume a financial breakdown based on known fundamentals (recent as of 2024-25):
| Metric | Value | Buffett Interpretation |
| ---------------------- | ---------------------- | ----------------------------------------------- |
| ROE (Return on Equity) | >20% | Excellent – Indicates efficient use of capital |
| Debt-to-Equity Ratio | Close to 0 | Strong – Buffett avoids debt-heavy firms |
| Free Cash Flow | Positive, consistent | Good – Buffett loves cash-generating businesses |
| Dividend Yield | 1.5%–2.5% | Moderate, not key, but shows surplus cash |
| Earnings Growth | CAGR \~20–25% (recent) | Promising – but must sustain organically |
🔍 Buffett prefers stable and predictable earnings, and BSE shows that in its core exchange business, though it remains sensitive to market cycles.
🏰 3. Economic Moat
BSE's Competitive Advantages:
Brand heritage (Asia’s oldest exchange)
Government regulations ensure limited competitors
High switching costs for existing listed companies
High margin data services, SME listings, and mutual fund platforms
🛡 Buffett’s View:
> “I want a business with a durable competitive advantage.”
> BSE fits this well.
👨💼 4. Management Quality
Buffett places immense importance on management honesty and competence.
BSE’s leadership has been conservative, focused on transparency and innovation (e.g., India INX, BSE StAR MF).
Consistent improvement in digital platforms and growing relevance in mutual fund distribution indicates forward-thinking leadership.
✅ Buffett’s View: Passes the integrity and competency test.
🌏 5. Industry Outlook
Indian capital markets are expanding.
Retail participation, SIP inflows, and startups going public will grow exchange volume.
Fintech and tech listings offer upside.
Regulatory tailwinds from SEBI are improving transparency and scale.
📘 Buffett likes industries with tailwinds, and Indian capital markets are structurally growing.
📉 6. Technical Entry (Buffett seldom uses technicals but we’ll blend it)
> "Price is what you pay. Value is what you get."
Looking at the Fibonacci retracement levels from the chart:
CMP: ₹2,456.70
38.2% Level: ₹2,337.15 →Potential entry zone
50% Level: ₹2,123.35 → Strong support / high conviction entry
61.8% Level: ₹1,909.50 → Ideal deep value buy (high margin of safety)
🟩 Accumulation Zone: ₹2,100 – ₹2,337
🛑 Stop-loss (Fundamental): ₹1,850 (below 61.8% retracement and key support)
🎯 Target (Intrinsic Value): ₹3,000–₹3,200 over 2–3 years (based on earnings growth)
📌 7. Intrinsic Value Estimation (Buffett’s Method)
DCF-style rough estimate:
EPS: ₹75 (assumed)
Growth: 15% CAGR (conservative)
Terminal PE: 25 (market average for strong moats)
Holding period: 5 years
Future EPS = 75 × (1.15)^5 ≈ ₹150
Target Price = 150 × 25 = ₹3,750
Present Value (with 12% discount) ≈ ₹2,120 – ₹2,350
🔎 Fair Value Range: ₹2,100–₹2,350
💵 Buy Below: ₹2,350 (for margin of safety)
✅ Final Verdict (Buffett Style Summary)
| Criteria | Verdict |
| ----------------------- | ---------------------------- |
| Understandable Business | ✅ Yes |
| Economic Moat | ✅ Strong |
| Management Quality | ✅ Trusted & Competent |
| Financial Strength | ✅ Excellent |
| Industry Tailwind | ✅ Positive |
| Intrinsic Value Range | ₹2,100–₹2,350 |
| Current Price | ₹2,456 – Slightly overvalued |
| Buy Recommendation | Wait for dip below ₹2,350 |
| Stop Loss (Soft) | ₹1,850 |
| Target (Long-Term) | ₹3,500+ |

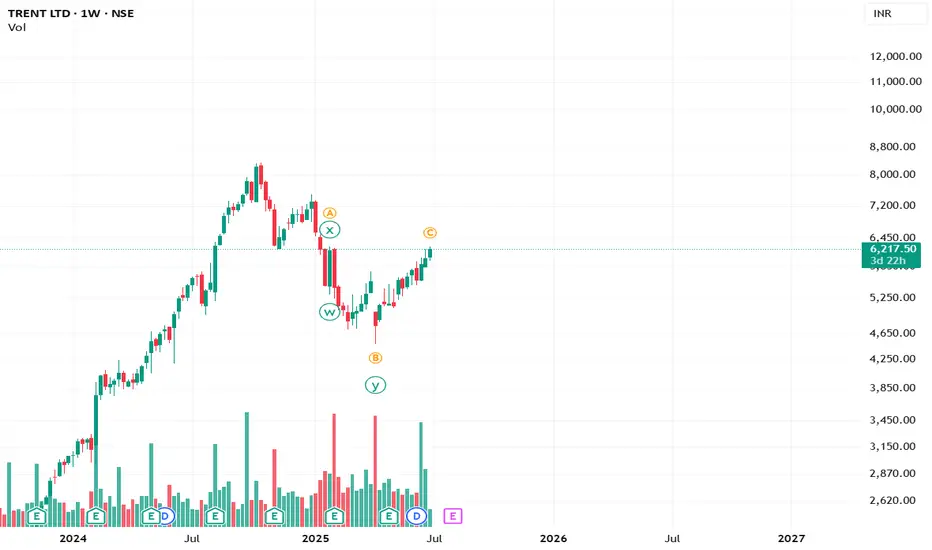
A Possible alternate count for TRENT?Whether TRENT has completed its complex correction or is still unfolding an expanded flat. Only time will tell.
BSE BREAKING ATH BSE ATH breakout trading at new ATH
good volume building up last few week
bullish RSI,MACD crossover done
V shape recovery
near #target 6800 SL 5000
NO BUY/SELL RECOMENDATION

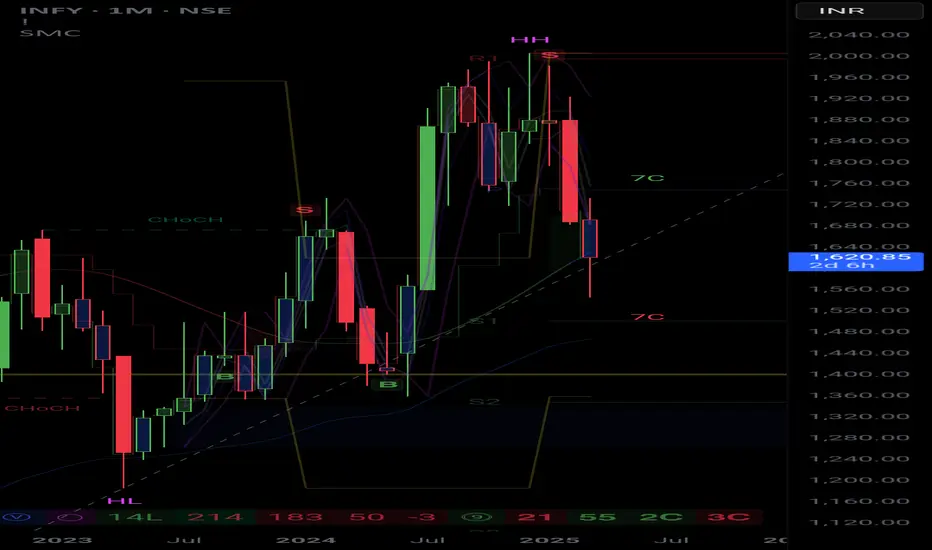
Infosys (INFY) Stock Forecast – March 2025Infosys (INFY) Stock Forecast – March 2025
Current Price: ₹1,619.50
Timeframe: Monthly Chart (1M)
Technical Analysis & Forecast
1. Trendline Support: The stock is currently testing a key trendline support on the monthly chart.
2. Breakdown Possibility: If INFY closes below this trendline, it may head towards the ₹1,400 level, aligning with the S2 support zone.
3. Resistance Levels: The recent rejection from ₹1,850-1,900 suggests strong selling pressure at those levels.
4. Market Structure:
Lower highs (LH) formation indicates a possible bearish continuation.
Change of character (ChoCH) signals uncertainty in trend direction.
5. Indicators:
Moving Averages: INFY is testing its long-term moving averages. A break below these could accelerate the downside.
Volume & Momentum: Selling pressure has increased, and bulls need to reclaim key resistance levels for a recovery.
My View
INFY is taking trendline support this month. If this support is broken, we can expect ₹1,400 as the next downside target. However, if buyers defend this level, a rebound towards ₹1,750 is possible.
Disclaimer
This analysis is for educational and informational purposes only. It is not financial advice. Please conduct your own research or consult with a professional before making any trading decisions.
Long entry in BSEFor the First on the daily chart we have seen the BSE stock trading in bullish mode above the 200 EMA levels. A long entry for both trading & Investment can be seen in the stock. Below the 200 EMA we can keep the SL. Good risk to reward trade.

BSE : Trading Sideways with HIGH IV- Current Ratios : P/E ~ 84 (5 yr average of ~37.5), PEG ~ 5, P/BV ~ 21 (5 yr average of 3.2)
- Technically, BSE has gone into a consolidation within a range of 6200 to 5000 since Dec-2024..
- Yesterday’s bounce was due to Goldman-Sachs purchase in the stock, and momentum can push it to test 6000-6200 levels soon.
- A significant direction in BSE stock prices will only emerge, once it breaks this consolidation range.
- However, this seems like a nice setup for Option traders to trade this range., as the Implied Volatility has also jumped significantly.
#stoxsense #bse #learntradingwithsudhir
