BTC Traders: Crucial Levels Incoming 🚨 BTC Traders: Crucial Levels Incoming 👇
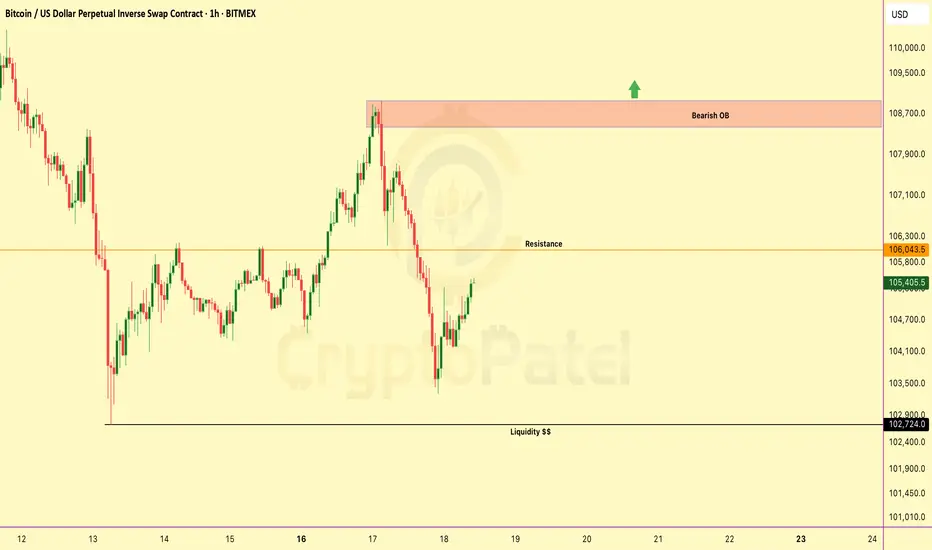
Bitcoin is hovering around $105,399 — and things are heating up.
$106K = Resistance.
A clean break could send us to the Bearish Order Block ($108K–$108.95K).
But here’s the danger zone:
🟥 OB = Last drop's origin.
Rejection here = major sell-off risk.
🔻 $102K = Liquidity pool.
Lose this level, and sub-$100K is on the table.
Current Bias:
– Hold below OB = Bearish
– Reclaim OB = Relief bounce
– Drop below $102K = Trend Accelerates Down
What’s your game plan here?
💬 Comment your next move
🔁 Retweet if useful
🔖 Bookmark for later
Btc-bitcoin

Bitcoin Ready to Blast or Waiting under $100k?BTC is currently trading near $105,399, showing a corrective bounce after a recent sell-off.
Resistance Ahead – $106k:
Price is approaching a key resistance level. A break above could lead to a short-term move toward the Bearish Order Block at $108000–$108950.
🟥 Bearish Order Block (OB):
This is the supply zone that initiated the previous drop. If price fails to break and hold above this OB, we could see renewed selling pressure and continuation of the downtrend.
🔻 Liquidity Pool – $102k:
This level holds resting sell-side liquidity. A failure to hold this area may trigger a sweep — and if $102K breaks, it could unlock deeper downside potential, possibly sending BTC below $100K.
Summary Outlook:
▪️ Rejection from OB = strong bearish continuation
▪️ Break of $106K = short-term bullish move toward OB
▪️ Break of $102K = high probability of sub-$100K levels
▪️ Overall bias remains bearish unless price reclaims and holds above the OB zone with strength.
NFA & DYOR
Pump.fun Sells $741M in SOL After X Suspension – What’s Really?Pump.fun Sells $741M in SOL After X Suspension – What’s Really Happening?
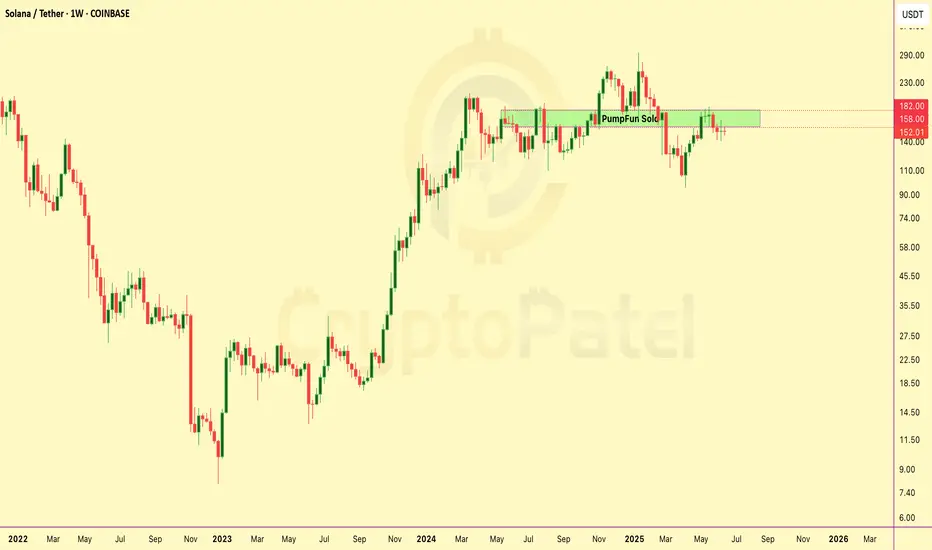
PumpFun (@pumpdotfun), a popular Solana-based meme token launch platform, was recently suspended from X — but they’ve been making major moves behind the scenes.
Since May 19, 2024, the platform has sold around 4.1 million SOL, worth nearly $741 million, at an average price of $180.
Here’s the full breakdown:
🔹 264,373 SOL sold for $41.64 million USDC at $158
🔹 3.84 million SOL, worth $699 million, sent to Kraken at $182
Why is Pump.fun selling so much?
Is this an exit strategy, or are they just managing risk?
$IO Could Be the Next 100x AI Coin?SEED_ALEXDRAYM_SHORTINTEREST2:IO Could Be the Next 100x AI Coin — Don’t Miss This Supercloud Revolution
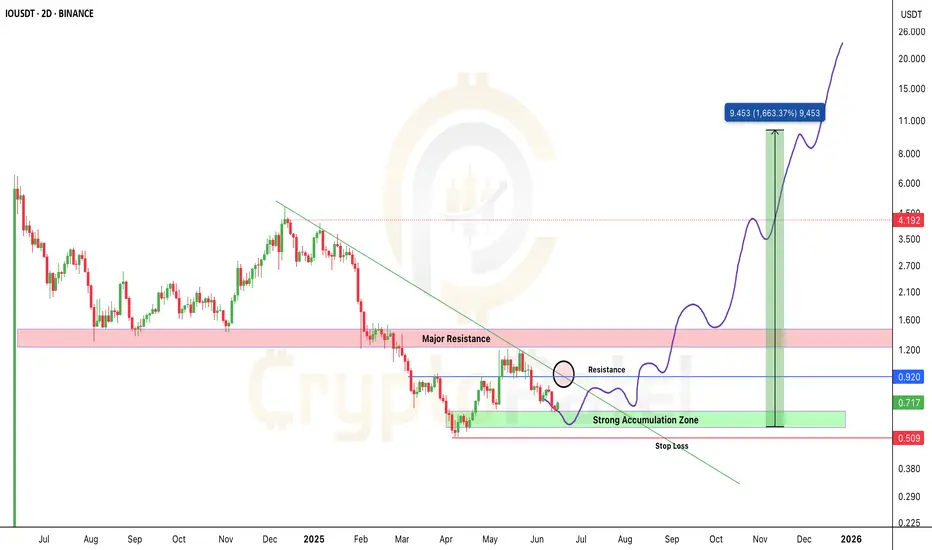
SEED_ALEXDRAYM_SHORTINTEREST2:IO is showing early signs of strength after bouncing from the key accumulation zone ($0.51–$0.73).
Structure still bullish.
A breakout above $0.92 = confirmation for next leg up.
If volume kicks in, SEED_ALEXDRAYM_SHORTINTEREST2:IO has macro breakout potential.
▶️ Entry Zone: $0.51–$0.73
▶️ Breakout Trigger: $0.92
▶️ Resistance Zone: $1.20–$1.60
▶️ Target: $5/$9/$15/$20
▶️ ROI Potential: 10x / 20x
❌ Invalidation: Break below $0.50
🔥 Long-term holders and breakout traders — don’t miss this.
io.net is turning idle GPUs into a supercloud to power AI, ML & big data — without relying on AWS or GCP.
✅ 90% cheaper than trad cloud
✅ 16,000+ GPUs live
✅ Built on Solana
✅ Backed by Multicoin, Delphi, Solana Ventures
🔰 Token Utility: Pay for compute | Staking rewards | Governance rights
This is DePIN + AI — a powerful combo. If adoption scales, SEED_ALEXDRAYM_SHORTINTEREST2:IO could be massive.
📢 If this analysis helped you, please RT & drop your thoughts in comments 👇
Let’s spread the alpha.
NFa & DYOR
BTC Decision Point – Are You Watching This?BTC Decision Point – Are You Watching This?
Bitcoin is reclaiming momentum after sweeping liquidity at $102.7K. It's now pushing toward major resistance at $106.1K.
But the real battle? The bearish OB at $107.2K–$108.9K — where price nuked last time.
✅ Break above = clear skies toward new ATHs
❌ Rejection = another trip to $102K or even Under $100K
🔁 Retweet if this helped
💬 Drop your bias below: Long or short?👇

$ETH BLOODBATH: -15% Dump! Next Stop $2100? CRYPTOCAP:ETH BLOODBATH: -15% Dump! Next Stop $2100?
I shorted right from $2862 — nailed the move.
Now trading below critical $2550 support.
👉 Hold $2550? Reversal towards $3000-$4000 possible.
👉 Lose it? We likely fill $2100-$2200 FVG — 0.618 fib at $2116.
$2860 remains THE level to watch for a New ATH.
💬 Comment your ETH target!
🔁 Retweet if this helps your gameplan.

Bitcoin Bulls vs Bears — Battle Zones Mapped Out#Bitcoin Bulls vs Bears — Battle Zones Mapped Out
🔰 $105K–$106.7K = Bearish Order Block:
Below this zone = CRYPTOCAP:BTC stays bearish unless HTF closes above $106.7K
🔰 Next Moves:
▪️ Likely retest $105K–$106K before next leg ↓
▪️ Target: $97K–$95K zone
🔰 Key Levels:
✅ Holding 0.618 Fib (support)
✅ Unfilled FVG: $97K–$98.3K
✅ Bullish OBs: $95.7K–$97K | $93.5K–$94.7K
If $97,000 holds strong → Expect BIG bounce!

BTC Breakdown or Bounce? Key Levels You Need to Watch!BTC Breakdown or Bounce? Key Levels You Need to Watch!
#Bitcoin 4H Chart Analysis – SMC Overview:
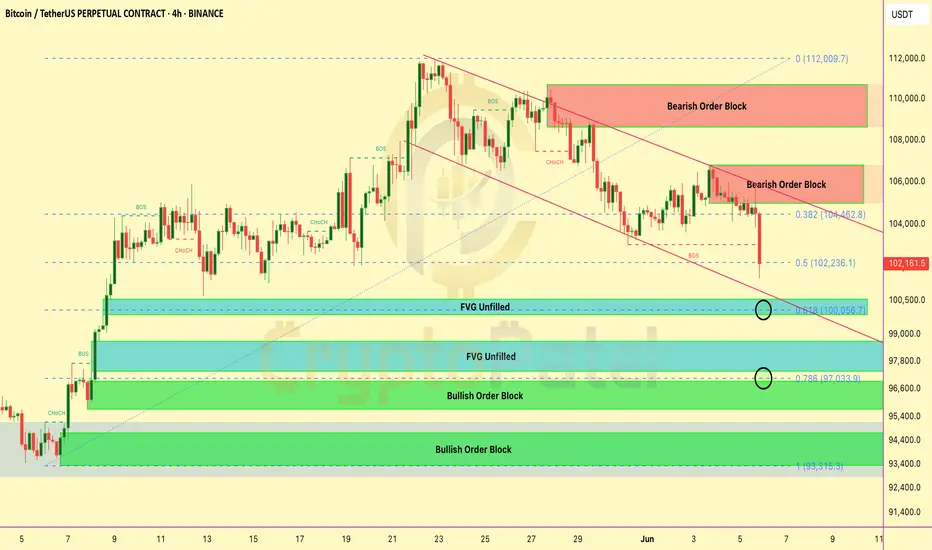
BTC is currently in a short-term downtrend, respecting a descending channel and showing clear bearish structure.
🔴 Bearish Signs:
Price rejected from 2 major Bearish Order Blocks:
▶️ $106K–$104K
▶️ $111K–$109K
Breaks of Structure (BOS) and Change of Character (CHoCH) confirm trend shift to bearish Couldn’t hold the 0.382 Fibonacci level at $104.4K — now testing the 0.5 Fib at $102.2K
🟢 Key Support Zones (Potential Reversal Areas):
1️⃣ $100K Zone
✔️ 0.618 Fib level
✔️ Unfilled Fair Value Gap (FVG)
🔍 Possible bullish reaction from here
2️⃣ $97K Zone
✔️ 0.786 Fib
✔️ Bullish Order Block (OB)
✔️ Another FVG
💥 Strong confluence — good probability of reversal
3️⃣ $93K Zone
✔️ Deep Bullish OB
🛡️ Last strong support if $97K fails
🔼 If bulls reclaim control: We need a clear CHoCH above $104.5K to confirm bullish shift
⚠️ Tip: Mark these zones. Use alerts. Let the price come to you — don’t force trades.
📢 Share if useful & stay updated
BITCOIN WARNING – $104K IS KEY🚨 BITCOIN WARNING – $104K IS KEY
#Bitcoin is showing signs of weakness on the 4H chart! Let’s break it down:
🔻 Trend Shift Detected:
Recent CHoCH and BOS suggest the uptrend is over. Market structure has turned bearish.
Key Levels to Watch:
▪️ Support at $104K is being tested again. If it breaks, we may see a drop.
▪️ Next major targets:
➤ $100.5K (Unfilled Fair Value Gap)
➤ $98K – Strong demand zone
➤ $96.6K – Bullish Order Block + FVG confluence
Why It Matters:
▪️ Price rejected hard from the $107K zone (supply + FVG)
▪️ Liquidity was grabbed from Equal Highs
▪️ Now it’s hunting lower liquidity near $100K
⚠️ If $104K fails, get ready for a quick drop to $100.5K or even $96.6K
Plan: Short-term bearish unless BTC breaks back above $106K with volume.
Stay alert — volatility incoming!

Breakout or Breakdown? BTC at Critical Level!Breakout or Breakdown? BTC at Critical Level!
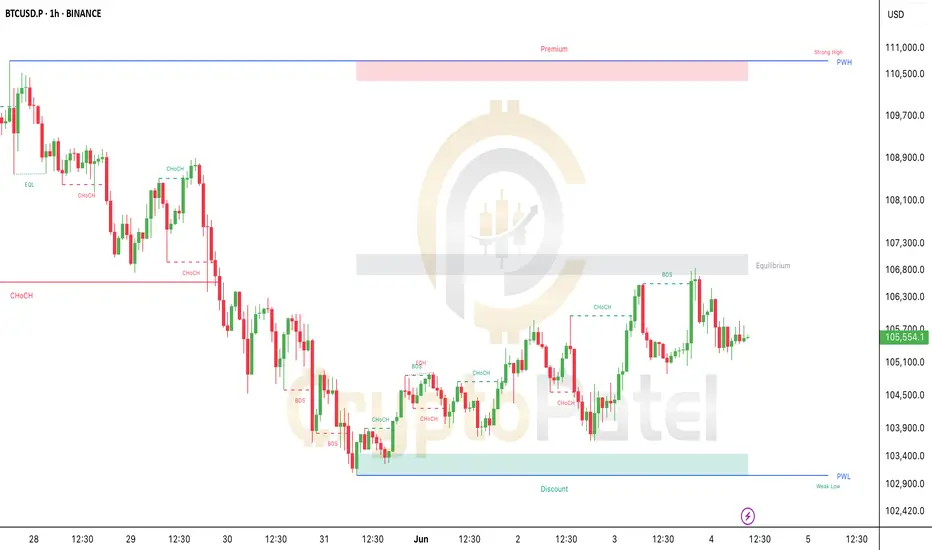
#Bitcoin is showing early bullish signs after a clean reversal from the discount zone (~$103K).
We saw a CHoCH → BOS → Retest sequence play out perfectly!
Price is now consolidating just below a key supply zone (~$106.8K). This is the Equilibrium Zone – where smart money decides the next move.
🔹 As long as BTC holds above $104.2K, we stay bullish.
🔻 BUT – if we break below $103.4K, expect a deeper pullback, and we could even see Bitcoin drop under $100K for a proper liquidity sweep.
What’s Next?
If we reclaim $106.8K with strength, the next target is the Premium Zone around $110K–$111K, where major liquidity sits!
Watch for breakout or rejection – don’t FOMO. Patience = Profits.
BTC Bulls Must Defend $103K… Or Say Hello to $99K Again Bitcoin completed a clear 5-wave Elliott Impulse and is now forming an ascending wedge (abcde structure), typically hinting at a possible correction.
Key Levels to Watch:
🔴 Key Bull Level: $103,085 – must hold to maintain bullish structure
🟠 Support 1: $99,265 – breach = deeper pullback
🟡 Support 2: $95,965 – last stronghold for bulls
Outlook:
🔼 A breakout above the wedge = continuation toward $110K+
🔽 Breakdown below $103K = expect correction toward lower supports
Strategy:
➡️ Wait for confirmation. A wedge breakdown = potential short trade setup.
➡️ Breakout = bullish continuation. Always manage risk wisely.
Stay sharp, traders!

Ethereum Wyckoff Accumulation – Weekly Chart BreakdownEthereum Wyckoff Accumulation – Weekly Chart Breakdown
ETH is showing a textbook Wyckoff Accumulation pattern playing out on the 1W timeframe — and if it holds, we could be gearing up for a major breakout rally in the coming months.
Phase Breakdown:
✅ Phase A: Selling Climax (SC) marked the bottom. Automatic Rally (AR) set the resistance. Secondary Tests (ST) confirmed demand at lower levels.
✅ Phase B: Smart money accumulated heavily within the range — no directional move, just shakeouts and traps.
✅ Phase C: The Spring — price dipped below support to liquidate weak hands. Classic bear trap.
✅ Phase D (NOW): Recovery begins. If we see a Sign of Strength (SOS) above resistance with volume, Phase E (markup) is confirmed.
✅ Phase E: Full breakout mode. Higher highs, higher lows. Price discovery.
🟢 Accumulation Zone: $1,600–$1,300
🟢 Key Resistance: ~$3,600–$4,000
🟢 Projection Zone: $4,800 to $7,800+ (if SOS confirms)
✅ Bias: Bullish
Note: Watch for a clean breakout above the resistance zone. Low volume pullbacks = strength.
This is the kind of setup you don’t want to ignore.

Bitcoin At Big Resistance level so What Next?#BTC/USDT Update – Price at Critical Resistance
The chart structure remains unchanged from our previous update.
🔸 After entry, price dipped ~5% below our zone, but has now printed a strong bullish candle, signaling potential upside momentum.
🔸 However, Bitcoin is currently trading at the upper boundary of the ascending channel, acting as resistance.
Key Level to Watch:
If the HTF candle closes above $99,500, it will signal strength, and I’ll consider closing short positions and initiating fresh long setups.
Important Note:
The current pattern resembles a liquidity trap, not a clean bullish continuation. That’s why I remain cautious.
✅ Plan:
🔸 Wait for confirmation > $99,500
🔸 Use tight stop-loss – no blind trades.
Stay sharp, monitor price action closely.

Bitcoin Ready to Dump Again till $85000?CRYPTOCAP:BTC just tapped a key Short POI near resistance!
Bears stepping in hard below $99,550 — this is prime sniper zone.
▶️ Trade Setup (SMC x ICT):
▶️ Entry: $93,800–94,200
▶️ Targets: $90,000 → $86,000
▶️ Stop Loss: $99,600 (above structure)
Liquidity swept ✅
FVGs below ✅
Momentum shifting ✅

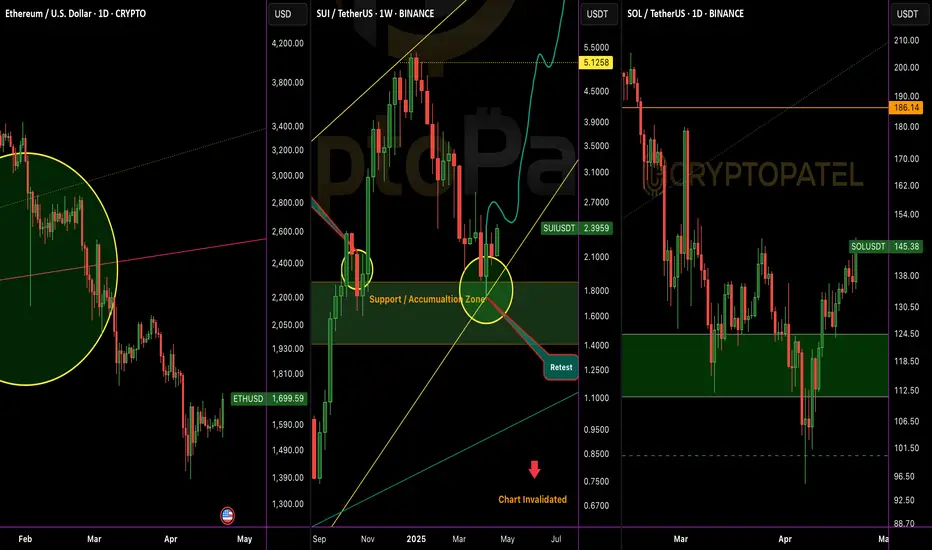
Bitcoin And Altcoins Price Difference🚨 2 months ago, #Bitcoin hit $90K and alts were flying:
CRYPTOCAP:ETH – $2,850
CRYPTOCAP:SUI – $3.50
CRYPTOCAP:SOL – $180
Today, BTC is BACK above $90K… but alts are in the dip!
CRYPTOCAP:ETH – $1,700
CRYPTOCAP:SUI – $2.40
CRYPTOCAP:SOL – $145
Never Forget to Buy at F*** Dip you Planning for Long Run
Will Bitcoin Hit $1 Million in Future?Everyone’s Scared of #Bitcoin Red Candles... I see Opportunity.
1⃣ This ain’t just a dip — it’s a Discounted future begging to be Grabbed.
2⃣ My Chart will Age like fine wine 🍷
3⃣ Buy fear. Stack smart.
4⃣ In a few years, You'll wish you did.
Let the smart money eat. 🚀
NFA & DYOR

Bitcoin buying strategyBitcoin at divergence.
Bullish invalidation below 74808
Bullish targets: 82830, 88044, 91755
Below 74808-74800 zone, bearish continuation till 71845, 68075, and 64525 as downside targets respectively.

Will Bitcoin Test $65000 level soon ?🚨 #BTC/USDT SMC Update and Fresh Analysis 🚨
Our previous short setup played out perfectly with a solid -21% move from the $94,000 region, catching the local top and dumping all the way to $75,000.
What’s next?
From a Smart Money Concepts (SMC) perspective, current PA suggests another local top might be in.
🔹 Bearish Order Block just got tapped
🔹 Strong Resistance seen near the $86,000 level
🔹 Price forming LL (Lower Low) and LH (Lower High) structure
If this setup plays again, we may see a new low below $75,000.
Key Level to Watch:
If a HTF candle closes above $88,200, the short thesis is invalidated — and in that case, we may be looking at a bullish continuation toward the $100,000 zone.
Reminder:
Don’t enter blindly. Wait for confirmations and respect risk management—protect your capital at all costs.

#Bitcoin 30 Minutes Chart Scalp profit Update:#Bitcoin 30 Minutes Chart Scalp Profit Update:
That quick scalp move delivered a clean +3.60% — just as planned. Scalp trades are meant for small, fast targets, and this one hit perfectly. ✅
But If Still holding?
🔹 Move SL to Break Even to protect capital
🔹 Structure looks fine for now, but don’t get greedy — manage your risk.
Always trade with a plan.
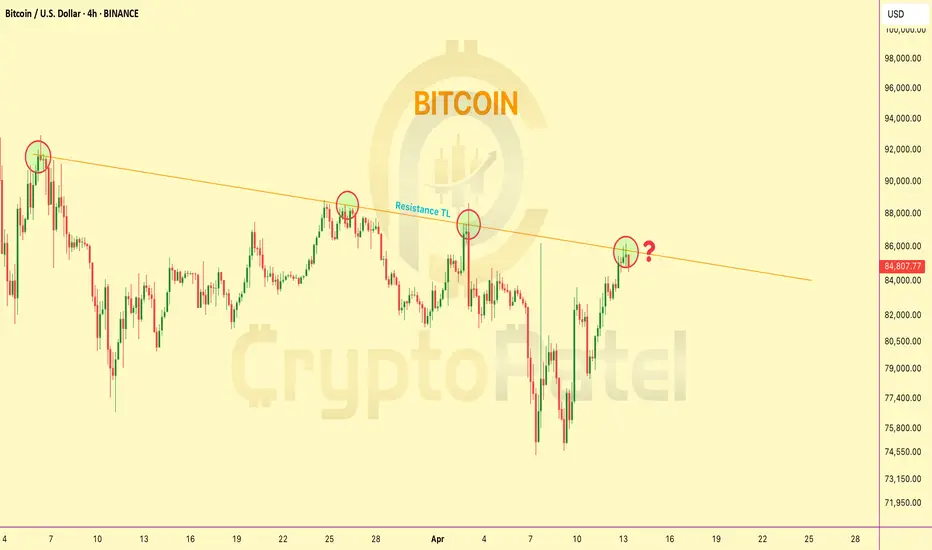
Bitcoin trading at Resistance level so What Next?🚨 Bitcoin 4H Chart Update
CRYPTOCAP:BTC is now trading right at the trendline resistance on the 4H chart
So what’s next?
1️⃣ Breakout and blast toward $100K?
2️⃣ Or another rejection down below $70K?
The decision point is HERE.
This breakout could change the game.
👇 Drop your thoughts –
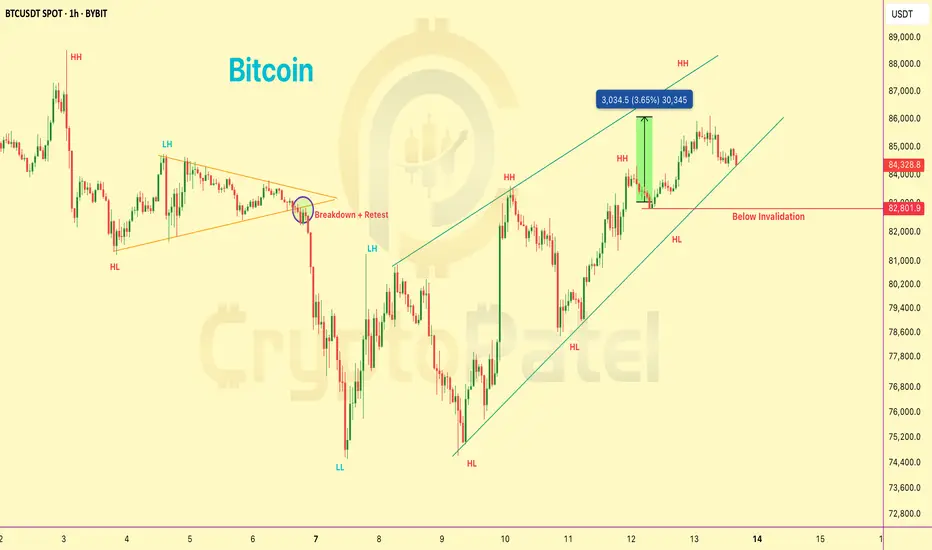
BTC/USDT – 30-Min Chart Technical BreakdownBTC/USDT – 30-Min Chart Technical Breakdown
🔺 Pattern Formation:
Price action is currently developing a rising wedge, generally considered a bearish continuation pattern. However, the ongoing Higher High (HH) and Higher Low (HL) structure suggests short-term bullish momentum is still intact.
Key Resistance Levels:
* $84,700 – Major horizontal resistance
* $83,600 – Local supply zone / recent rejection point
Key Support Levels:
* $81,200 – Trendline + structure support (wedge base)
* $78,400 – Secondary structural support
* $74,900 – High-confluence demand zone
Long Setup (High-Risk Trade – Counter to Pattern Bias):
* Entry Zone: $82,500 – $83,000 (wedge support retest zone)
* TP1: $83,900
* TP2: $85,200
* TP3: $87,000 (upper wedge boundary)
* SL: Below $81,100 (wedge break + structural invalidation)
Confirmation Needed:
Watch for bullish engulfing or a strong bounce from the wedge support (red dashed trendline) with solid volume influx.
Risk Note:
Despite current bullish flow, wedge patterns often resolve bearishly. If price breaches below $81,100, invalidate longs and reassess for possible shorting opportunity.

Bitcoin Ready for New ATH or New LowBitcoin Update:
If Bitcoin Price Break $83000 and 4H Close above then It Turned into Bullish Mode Otherwise Ready for New Low Again....

BITCOIN BULLISH POTENTIALPrice has entered the discount zone near a weak low, signaling a potential reversal as smart money may be accumulating after a liquidity sweep. This area often serves as a launchpad for bullish moves, especially when sell-side liquidity has been taken.
Short-term sentiment is shifting bullish, suggesting momentum could be building for a move upward. With key bearish targets already met, the downward pressure may be fading, setting the stage for a corrective move or full reversal.
If bullish structure forms—such as a break of structure or a bullish order block holding—price could begin climbing toward equilibrium and possibly into premium territory. Look for confirmation through price action and volume shifts.
