Breakout or Breakdown? BTC at Critical Level!Breakout or Breakdown? BTC at Critical Level!
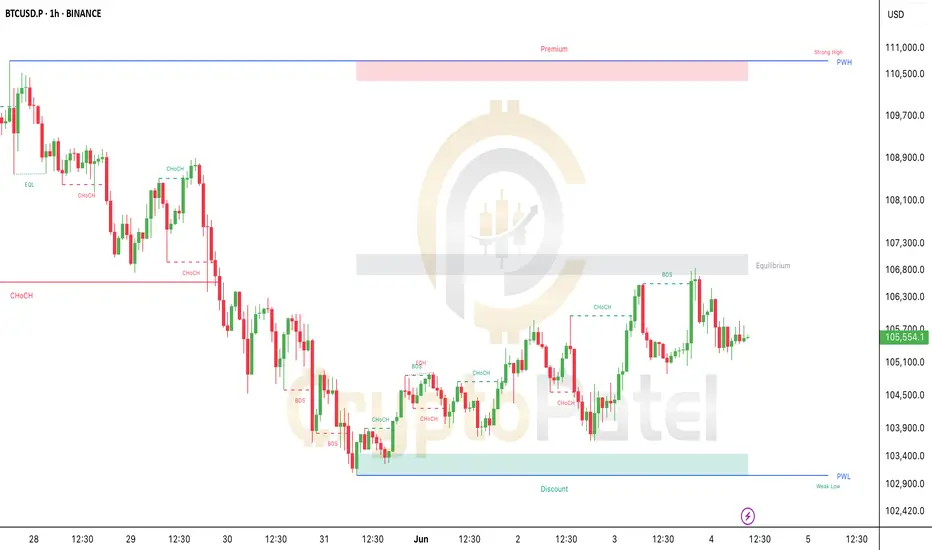
#Bitcoin is showing early bullish signs after a clean reversal from the discount zone (~$103K).
We saw a CHoCH → BOS → Retest sequence play out perfectly!
Price is now consolidating just below a key supply zone (~$106.8K). This is the Equilibrium Zone – where smart money decides the next move.
🔹 As long as BTC holds above $104.2K, we stay bullish.
🔻 BUT – if we break below $103.4K, expect a deeper pullback, and we could even see Bitcoin drop under $100K for a proper liquidity sweep.
What’s Next?
If we reclaim $106.8K with strength, the next target is the Premium Zone around $110K–$111K, where major liquidity sits!
Watch for breakout or rejection – don’t FOMO. Patience = Profits.
BTC-D
Bitcoin's Next Move: $110K Breakout or $94K Dip? SMC Decides#Bitcoin Daily Chart Analysis – Smart Money Update
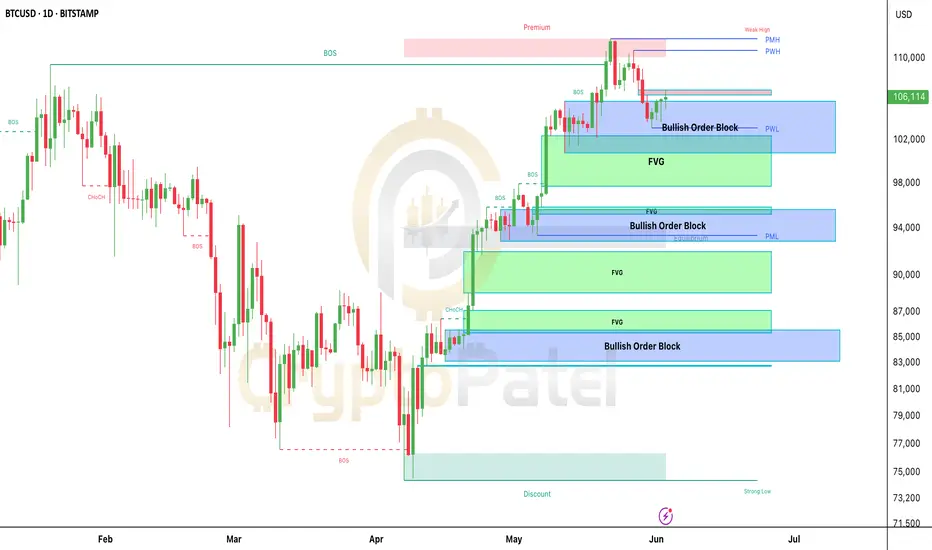
As of today, BTC is trading around $105,800 and is showing signs of consolidation after reaching a key resistance zone near $110K.
Let’s break down what’s happening on the chart 👇
Current Market Structure
▶️ BTC has been in a clear uptrend, with multiple Breaks of Structure (BOS) confirming bullish momentum throughout April and May.
▶️ However, price recently entered a premium zone (above $110K), where it faced strong resistance.
▶️ This created a weak high, and we saw a Change of Character (CHoCH) that suggests buyers are slowing down.
Key Levels to Watch
$102K–$106K Zone (Current Area)
▶️ Price is sitting inside a Bullish Order Block + Fair Value Gap (FVG).
▶️ This is a strong support zone.
▶️ If this area holds, we could see a move back up toward $110K or even higher.
$93K–$96K Zone
▶️ Another clean Bullish OB + FVG combo.
▶️ If BTC breaks down from the current zone, this is the next major area where Smart Money might step in to buy.
$83K–$87K Zone
▶️ Deep discount zone, far below equilibrium.
▶️ If price reaches here, it’s a high-probability reversal area.
What Smart Money Might Do
▶️ If BTC holds above $102K–$105K, bulls could regain control and retest the highs near $110K.
▶️ If we break below this zone, expect a pullback toward $94K–$95K or even $87K, where more demand is waiting.
Fair Value Gaps (FVGs)
▶️ Several FVGs are visible, especially between $98K–$103K and $93K–$96K.
▶️ These gaps are areas of imbalance where price is likely to return and fill before the next move.
Summary
▶️ BTC is currently in a decision zone.
▶️ Holding above $102K = bullish continuation likely.
▶️ Breakdown = retracement into deeper bullish zones.
⚠️ As always, wait for confirmation on lower timeframes before entering any trade. Let the market show its hand.
Stay patient. Smart Money doesn’t chase—It waits.
NFA & DYOR
WIF Just Flipped Bullish — Is This the Start of the Next Big AltWIF Just Flipped Bullish — Is This the Start of the Next Big Alt Rally?
WIF just bounced hard from the $0.80 demand zone and flipped structure bullish with a clear CHoCH!
Smart Money is back — and they’ve left their footprint.
Here’s What’s Cooking:
🔹 CHoCH Confirmed ✅
🔹 Bullish OB at $0.93–$0.96 respected ✅
🔹 Price aiming for $1.13–$1.42 — major liquidity zones
🔹 This isn’t random. It’s Smart Money accumulation, and the next leg up could be explosive.
⚠️ Don’t chase. Wait for confirmation around $1.13 zone and plan accordingly.
Breakout = 🚀
Rejection = Watch for retest.
High-Probability Play
This chart is loaded with confluences. If you're sleeping on it… you might miss one of the cleanest moves of the week.
📢 ACTION TIME:
✅ Save the chart
✅ Share with your crew
✅ Stay updated — we’re tracking this live
Comment “WIF🔥” if you're watching this move!

SYRUP/USDT About to Explode? Here’s What Smart Money is Doing!SYRUP/USDT About to Explode? Here’s What Smart Money is Doing!
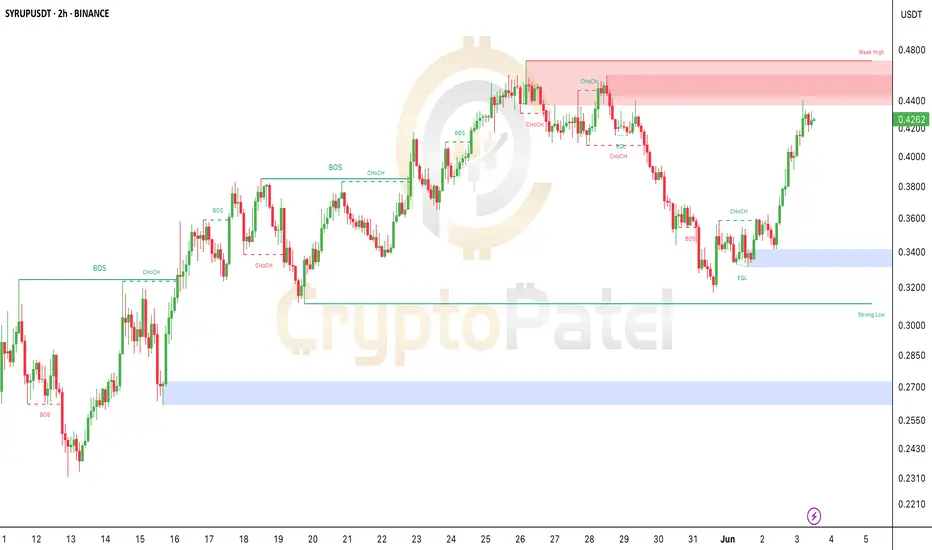
After weeks of sideways action, SYRUP just flipped bullish from a strong demand zone near $0.34.
It broke structure, reclaimed key levels, and is now eyeing the $0.44–$0.46 weak high zone!
This move looks like a classic Smart Money re-accumulation setup — and it’s gaining momentum fast!
Key Signals:
✅ Strong CHoCH + BOS combo
✅ Equal lows protected (liquidity trap avoided)
✅ Massive green candles + volume spike
✅ Next resistance: $0.46 — if broken, clean sky above!
Watch Closely:
If price reclaims $0.4450 with volume, we might see a breakout rally!
Short-Term Target: $0.46+
Strong Support: $0.38 and $0.34 zones
Don’t sleep on this move! Track, set alerts, and trade smart.
Your edge is in the knowledge — not the hype.
NFA & DYOR
From $1.38 to $0.50 Overnight – What Happened to $WCT?#WalletConnect Token ( NASDAQ:WCT ) just dropped from $1.38 to $0.50 in just 24 HOURS! 😳
From pumping hard to dumping even harder — here’s the REAL reason 👇
🔹 Early investors took profits after a huge 7x pump
🔹 Whales started booking profits
🔹 Panic selling hit hard — $500M+ traded on Upbit alone!
🔹 No new updates to support the hype
🔹 Futures trading went wild — $3.4B volume & extreme shorting
🔹 Chart broke major support – downtrend confirmed
$0.50 = Make or Break Level
If $0.50 holds 👉 bounce is possible
If it breaks 👉 we could see a deeper drop to $0.20
Fundamentals are still strong (Binance, Solana, Optimism, Airdrops),
But the hype ran faster than the project. Now the market is correcting.
⚠️ Don’t FOMO. Watch the key support. Trade smart.

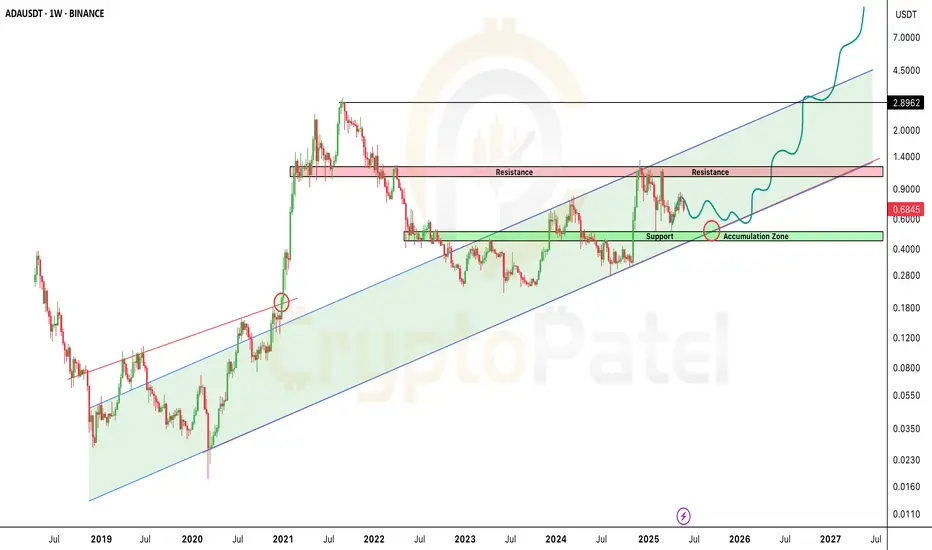
ADA Sitting on Strong Support — Next Big Move Loading?🚨 ADA Sitting on Strong Support — Next Big Move Loading?
Cardano has dropped to around $0.68, but guess what? It's sitting on a major support zone in a long-term bullish channel!
🟩 Accumulation Zone: $0.60–$0.40
This is where smart money enters… historically a STRONG buy zone!
🟥 Next Resistance: $1–$1.20
Break that — and ADA could fly toward $5–$10+ in the coming bull run!
The chart is screaming MEGA RUN ahead — if you're bullish on ADA long-term, this might be your signal.
Not financial advice, but the setup looks Strong.
GRASS–Long Swing Trade Setup After 80% Rally GRASS has seen a strong +80% move recently, and is now pulling back into a key support zone. This type of price action—post-rally consolidation at support—often precedes another leg higher, particularly if structure holds and momentum resumes.
🔹 Entry Zone:
$2.16 – $2.77 (support area & previous breakout zone)
🎯 Take Profit Targets:
🥇 $2.80 (recent high / range reclaim)
🥈 $3.50 (next major resistance zone)
🛑 Stop Loss:
$2.00 (just below structural invalidation level)
📌 Strategy Notes:
Volume surge confirms strong interest; this pullback could be accumulation.
Monitor for bullish engulfing or higher low confirmation on lower timeframes.
Maintain discipline with tight invalidation under $2.00.
If support holds and a reversal candlestick confirms, this could be a high-probability continuation setup. Let me know if you'd like a risk-reward breakdown or chart overlay!

Why TONCOIN is Potential to hit $50?🚨 TON Is Silently Prepping for a Massive Bull Run — Are You In Yet?
While the market chases memecoins, TON is building real stuff — with real money, real users, and now even AI integration.
Here’s why TON could be the next CRYPTOCAP:SOL -like sleeper 👇
▶️ $1.5 Billion Raised via Bonds
Telegram raised $1.5B at a 9% yield — no token dump, no equity sale.
Just old-school bonds — and institutional giants like BlackRock & Citadel bought in.
This gives TON huge runway to:
✅ Build Infra
✅ Expand Ecosystem
✅ Onboard Millions of Users
▶️ TON x xAI (Elon Musk's Grok) 🤝
The TON Foundation just announced a partnership with xAI (Grok) — bringing AI-powered search and interaction inside Telegram.
Imagine Grok integrated with TON wallet, payments, and apps — AI + Blockchain + 900M users = Game changer.
This is real utility, not just another hype partnership.
▶️ Ex-Visa Exec Joins TON as VP of Payments
Nikola Plecas, who helped shape Visa’s crypto strategy, is now leading TON’s payment mission.
The goal? Bring crypto payments to the heart of Telegram’s global userbase.
Solana Pay & Lightning — watch your back 👀
▶️ Telegram Premium Hits 15M Paid Users
This isn’t just “users” — this is a monetized audience, ready for TON-powered payments, tipping, and apps.
TON isn’t building a user base — Telegram already has it.
▶️ TON Technical Analysis (TA)
We called the TON move at $2.50 — and it’s already 50% up!
Now it’s forming:
✅ Bullish Market Structure
✅ Higher Highs + Higher Lows
✅ Strong Bounced From demand zone
Next target short term? $5–$6
Bull Market Potential? $50–$70 easy, especially when altseason fully ignites 🔥
Why TON Could Be the Next Crypto Titan:
▪️ Backed by Telegram
▪️ Integrated into daily chat & apps
▪️ 900M+ users in waiting
▪️ AI partnership with Grok
▪️ Institutional money flowing in
▪️ Strategic hires and solid infra
TON is the dark horse of this bull market.
It doesn't shout. It ships.
Once TON wallets go live for all Telegram users...
Game over for most L1s.
Follow CryptoPatel for more early alpha before the herd wakes up.
And tell me — what’s YOUR price target for CRYPTOCAP:TON in this cycle? 👇
Note: This is Not Financial Advice so DYOR before investing.

Is $WLD the Next 10x Altcoin This Bull Run? Is MIL:WLD the Next 10x Altcoin This Bull Run? 🚀
Based on the chart, this looks like a good time to start accumulating.
👉 My zone: $1.21–$1.00
👉 Bull target this cycle: $10
Strong bullish structure above $0.60 — but don’t forget: risk management is key.
#Altcoin #Worldcoin

Relief Rally or Trap Before the Next Big Drop? BTC/USD PLAN – MAY 24 | Relief Rally or Trap Before the Next Big Drop?
Bitcoin is showing signs of a technical rebound after rejecting from the 111k region. However, macroeconomic factors and investor sentiment are sending mixed signals that require caution moving forward.
🌍 MACRO OVERVIEW:
The US Dollar remains strong, supported by persistent high Treasury yields — putting pressure on risk assets like crypto.
New tariff tensions between the U.S. and China are shaking markets and tightening global liquidity, which may weigh on speculative assets including Bitcoin.
BTC ETF inflows have declined for the second week in a row, suggesting institutions are becoming more cautious after the recent rally.
📈 TECHNICAL OUTLOOK (H1 Chart):
After bouncing from the key support around 106,800, BTC has initiated a mild retracement toward the 0.5 Fibo at 109,300.
Short-term bullish target lies at the 110,000–111,947 area — a heavy confluence zone of supply, trendline resistance, and previous bull trap zone.
A failure to break 111,900 may lead to a strong correction back to 106,800, and if that fails, a deeper drop toward 102,567 is likely — a high-liquidity demand zone.
📌 TRADE SETUPS:
🔵 SHORT-TERM BUY SCALP:
Entry: 108,300 – 108,500
Stop Loss: Below 107,900
Take Profit: 109,300 – 110,000 – 111,947
Look for bullish reaction if BTC forms a higher low and stays inside the channel.
🔻 MAJOR SELL SCENARIO:
Entry: 111,800 – 112,000
Stop Loss: Above 112,300
Take Profit: 110,000 – 108,500 – 106,800 – 102,500
Favor short setups if price fails at resistance and shows rejection with lower volume or bearish candles.
⚠️ Caution:
Bitcoin is at a critical resistance zone. A breakout may trap late longs before a deep correction. If price breaks and holds above 112k, the bullish trend may resume toward new highs.
🎯 Stick to your zones. Don’t chase price. Use proper risk control.

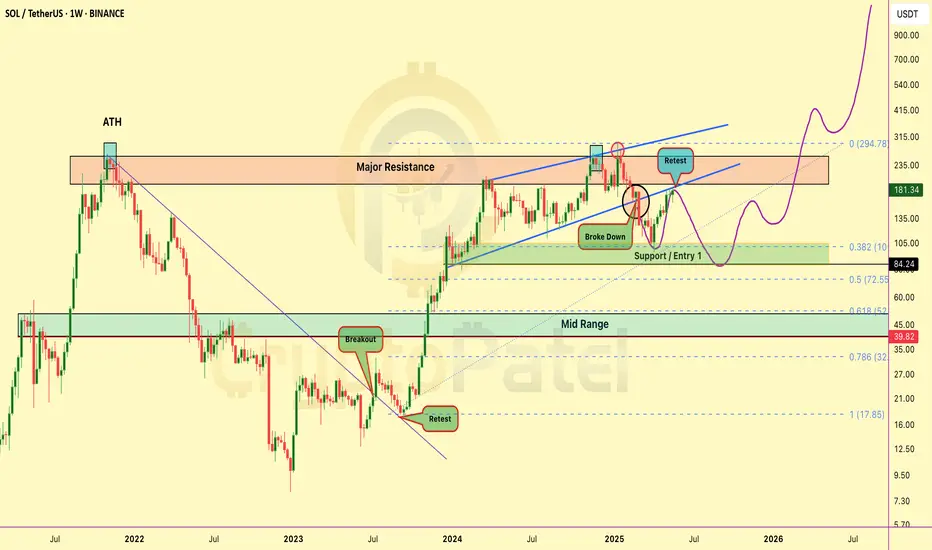
Bearish Setup Loading on Solana? Bearish Setup Loading on Solana? Watch This Key Level Closely
Solana just retested the breakdown zone after losing key support — currently sitting in a danger zone.
Short Interest Zone: $180 – $190
If this area holds as resistance, we could see another move below $150 soon.
Bearish Setup Invalidation: Break above $200 will flip this bias.
Long-Term View? I’m still super bullish on SOLANA in the bigger picture — my long-term target remains $1000 🚀
Risk Management is Key
Never trade without a STOP LOSS — protect your capital.
This is NOT financial advice — DYOR before investing.
Let the chart guide you, not emotions. Stay sharp.
Bitcoin Dumped form $111800 to $107800 so What next?🚨 Hope you caught the top short at that Bearish OB!
CRYPTOCAP:BTC dropped from $111.5K → $107.8K
Next Key Level: $105K
Hold = Bull Mode On 🟢
Break = Say Hello to < $100K again 😬
Reminder: Don’t gamble your hard-earned money. Trade smart.

ETHEREUM MEGA CYCLE ALERT🚨 ETHEREUM MEGA CYCLE ALERT 🚨
CRYPTOCAP:ETH just bounced from the same support zone that sparked its last bull run 🔥
This could be the start of Wave 5 — and if history repeats…
🎯 Target: $10,000 ETH
Last time this pattern showed up? ETH went 10x.
Don’t fade the chart.
👉 Like & Retweet if you’re riding this wave
👇 Tag a friend who’s still sleeping on ETH!

BTCUSD IN SKY !!!!!!!!!!!!When the BTC was at 65k this needs to take a rebound and that is till 18500
Now just bought it and hold your socks
Put Target 100000
Date : 23rd June 2024 !!
BUY ALL CRYPTO NOW !!!!!!!!!

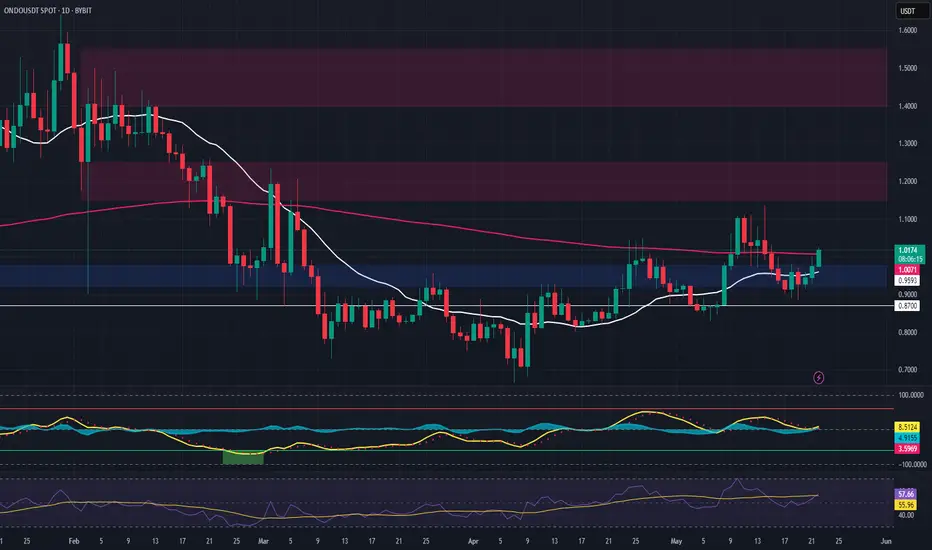
ONDO – Long Spot Trade Setup from 20-Day SMA ReclaimONDO is showing early signs of strength by reclaiming the 20-day SMA following a successful retest of both the SMA and key horizontal support. This confluence signals a potential continuation of the uptrend and presents an attractive long spot opportunity.
🔹 Entry Zone:
$0.92 – $0.97 (support + 20-day SMA confluence)
🎯 Take Profit Targets:
🥇 $1.15 – $1.25 (recent high & resistance cluster)
🥈 $1.40 – $1.55 (macro target zone, possible extension if trend strengthens)
🛑 Stop Loss:
Just below $0.87 (tight invalidation if price breaks below local structure and SMA)
$AKT Could Be the Next 10x AI Coin – Here’s Why I’m Bullish Now!CSEMA:AKT Could Be the Next 10x AI Coin – Here’s Why I’m Bullish Now!
Looking to buy CSEMA:AKT in the $1.50–$1.20 zone — strong support + FVG. If price dips, I’ll accumulate.
➡️ Support: $1.50–$1.20
➡️ Resistance: $2 — breakout could send it flying
➡️ Targets: $5 / $10 / $15
➡️ Invalidation: Below $0.80 = bearish shift
Why I’m Bullish:
Decentralized cloud disrupting big tech. Surging demand from AI workloads. Now supports NVIDIA GPUs, and gaining strong traction in AI & Cosmos communities.
A breakout above $2 could lead to massive upside and High Chances to Hit $10+
— DYOR | NFA

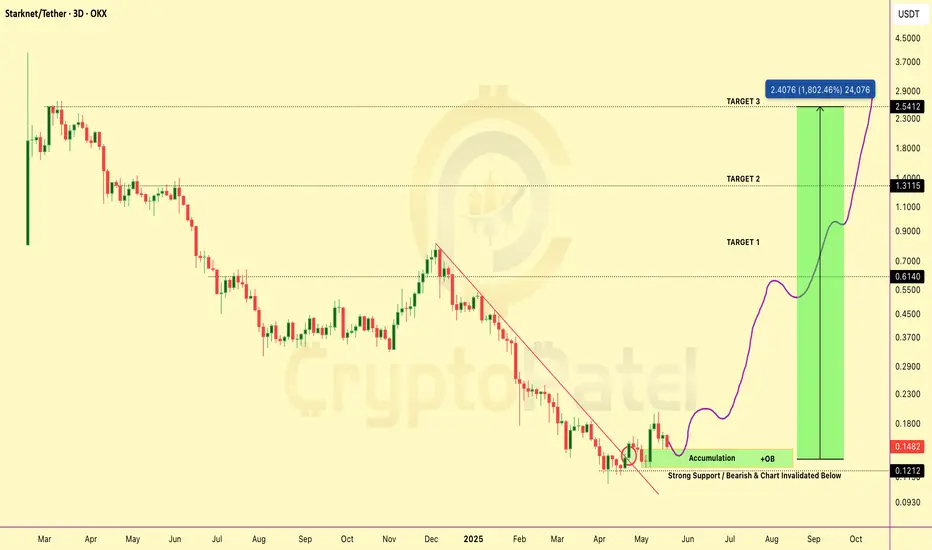
$STRK Technical Setup – 10x–20x Potential Loading🚨 NASDAQ:STRK Technical Setup – 10x–20x Potential on the Table
#Starknet has broken structure and is now retesting the bullish order block zone — classic PA move before the next leg up.
📌 Accumulation Zone: $0.15–$0.13 (Bullish OB)
🔄 Retest in progress – holding above OB confirms strength
🎯 Targets: $0.60 / $1.30 / $2.50
❌ Invalidation: Clean break below $0.12
Structure remains bullish — expecting continuation if OB holds.
High R:R setup. Eyes on it!
Note: This is Not Financial Advice so DYOR before investing in Any Cryptocurrencies.
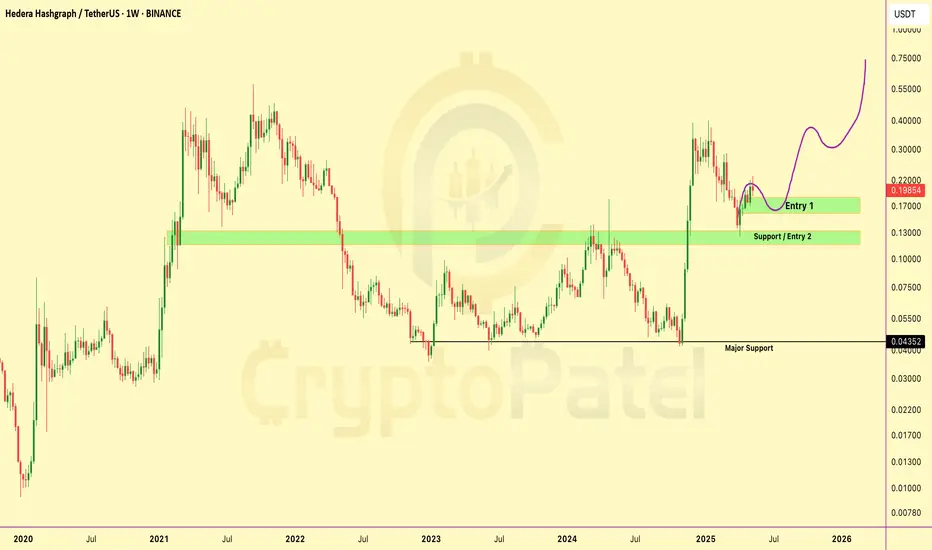
HBAR/USDT Chart Analysis and Price ProjectionMassive CRYPTOCAP:HBAR Rally Loading – Only If This Zone Holds!
Price is holding the critical support at $0.130 — a confirmed base here could trigger a major upside move toward $0.50–$1 🚀
▶️ Accumulation Zone: $0.180–$0.160
▶️ Invalid below $0.124
▶️ Above = ultra bullish structure in play!
DOGECOIN MEGA Bullish In Altseason CRYPTOCAP:DOGE is looking MEGA BULLISH! 🚀
Already did 700% from our first entry and still 300% up — plus it’s now 68% up from our Recent 2nd entry!
Chart shows strong bullish structure — higher highs, clean pullbacks, and massive community momentum backing it up. This bull run, #DOGE has real potential to hit:
▶️ Targets: $0.5 / $1
▶️ Long-Term: $1 / $2 / $3+
The meme king isn’t done — this could be just the beginning! 👑
👉 Are you holding DOGE/USDT?
Like & Retweet if you believe #DOGECOIN will hit $1 this cycle!

EOS Super bullish toward $10 because WLFI Buying$EOS/USDT Weekly Technical Breakdown
🔰 Price Action:
EOS is currently trading at $0.85, following a rejection from the key weekly resistance zone between $1.24–$1.31. This zone has acted as a historical supply area, and the failure to break above it has triggered a short-term corrective move.
🔰 Bullish Development:
EOS has recently broken out of a multi-year falling wedge pattern, signaling a potential long-term trend reversal. Post-breakout, the asset is now retesting lower levels — a common occurrence before continuation.
🔰 Key Demand Zones:
Primary Accumulation Zone: $0.83–$0.69
Major Weekly Support: $0.47–$0.40
These zones coincide with historical consolidation and low-volume nodes, making them ideal for long-term positioning.
🔰 Institutional Interest:
Trump-backed World Liberty Financial has accumulated 3.64M NYSE:EOS for 3M USDT, with an average entry at $0.824 — aligning perfectly with the current range. This reinforces the strength of the accumulation zone and may signal smart money inflow.
🔰 Upside Resistances to Monitor: $2.87 / $5.03 / $10.57 / ATH: $14.90
NYSE:EOS is showing signs of structural reversal on the HTF. As long as the price holds above the $0.69 base, bullish continuation remains valid. A reclaim and weekly close above $1.31 could trigger the next impulsive leg toward $5+.

BTC/USD DAILY PLAN – Will Bitcoin Hit 110K Before Reversing?BTC/USD DAILY PLAN – Will Bitcoin Hit 110K Before Reversing?
After a strong bullish impulse, BTC is now consolidating in a tight range between 103K–106K on the H4 chart. The ascending parallel channel remains intact, but bullish momentum is fading — a sign of potential distribution at the top.
🧠 Macro Context
BTC pumped recently thanks to ETF news and institutional inflows.
However, volume is decreasing, suggesting smart money may be offloading.
DXY and U.S. bond yields are ticking up → this could add pressure on BTC in the short term.
📊 Technical Outlook (H4 Chart)
BTC remains inside an ascending channel. Key levels to watch:
🔺 Resistance:
106,000 – local range high (H4)
110,576 – extended target if price breaks out
🔻 Support:
101,775 – bottom of current range; a breakdown here confirms weakness
94,473 – strong demand zone + EMA200
84,371 – key structural support zone if deeper correction occurs
⚠️ BTC may fake a rally toward 110K and then reverse sharply if broader macro conditions worsen.
🎯 Trading Scenarios
🔹 SCALP BUY:
Entry: 101,800 – 102,000
Stop-Loss: 100,800
Take-Profits: 103,200 → 104,000 → 105,000 → 106,000
Only enter long if price holds above 101.7K and shows strong rejection candles.
🔸 SELL ZONE:
Entry: 110,000 – 110,500
Stop-Loss: 111,200
Take-Profits: 107,000 → 105,000 → 101,775 → 94,473
Watch for exhaustion or false breakout patterns at this psychological zone.
🟢 LONG-TERM BUY ZONE:
Entry: 94,500 – 94,000
Stop-Loss: 92,500
Take-Profits: 96,000 → 98,000 → 100,000 → 103,000
Ideal for swing entries if BTC retraces into the broader demand zone.
⚠️ Key Notes:
BTC is showing signs of “rise slowly – dump fast” behavior.
Keep close watch on 101,775 – a decisive level for intraday direction.
No Fed rate cuts in sight → big money may still stay cautious.
✅ Conclusion:
Stick to trading range setups: BUY at channel base – SELL at distribution zones
Avoid FOMO and only enter trades after clear price action confirmation.
Risk management is essential during this high-trap environment.

Chainlink (LINK) – Momentum Shift with Strong EMA ReclaimLINK is showing a clear structural shift, having reclaimed both the 20-week and 200-week EMAs, signaling a potential transition from accumulation to expansion. The recent sweep of liquidity near $14 further strengthens the bullish case.
This setup provides a clean opportunity to enter on retracement to support, with solid upside if the momentum holds.
🔹 Entry Zone:
$13.00 – $13.50 (support + previous liquidity sweep zone)
🎯 Take Profit Targets:
🥇 $20 (HTF resistance)
🥈 $25 (macro range mid/high)
🥉 $30 (prior major resistance)
🛑 Stop Loss:
Daily close below $12.00 (structure invalidation)

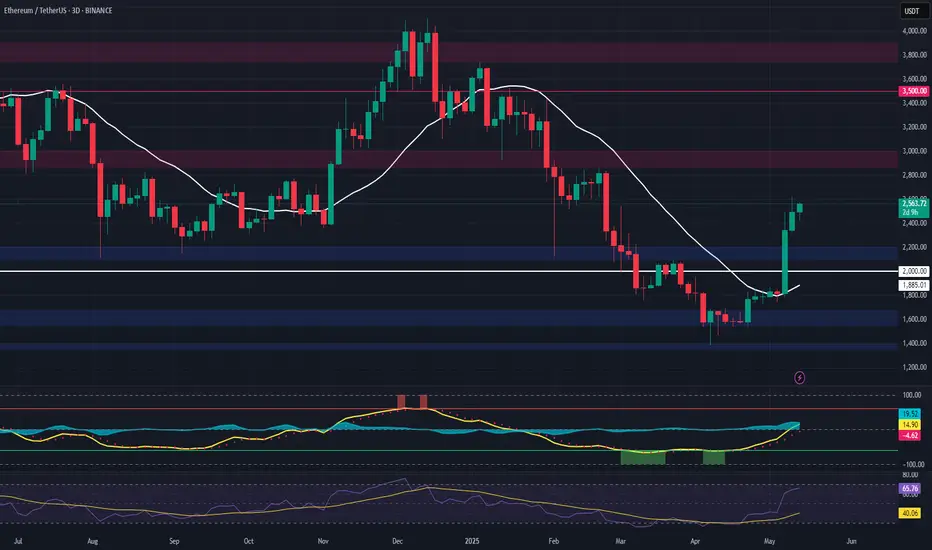
Ethereum (ETH) – Early Recovery Setup After Liquidity SweepEthereum has printed a bullish deviation below key liquidity ($1,500) and reclaimed the 20-day EMA, flipping prior resistance into support — a classic signal of early reversal momentum.
We're now watching for a pullback into the $2,100–$2,200 demand zone to offer an optimal spot entry before a potential move into higher timeframe targets.
🔹 Entry Zone:
$2,100 – $2,200 (pullback into reclaimed support/demand)
🎯 Take Profit Targets:
🥇 $3,000
🥈 $3,500
🥉 $3,900
🛑 Stop Loss:
Close below $2,000 (to invalidate reclaim of structure)