GBP/JPY 2-hour chart...GBP/JPY 2-hour chart, here’s what I can interpret based on my markings:
Range zone (pink box): approximately 203.8 – 204.4
Resistance zone (green box): around 201.0 – 201.5
Current price: ~202.18
Ichimoku cloud: price is just breaking back toward the cloud (potential short-term bullish momentum)
Marked target point: around 204.3 – 204.4
🎯 Target Analysis
If price continues its upward momentum from the bounce near 201.3 (support zone) and breaks above the cloud:
First target: 203.20 (top of the cloud / minor resistance)
Second target (main): 204.30 – 204.40 (the top of my marked range)
📉 Invalidation / Stop-loss idea
If price falls back below 201.70 – 201.50, that would invalidate the bullish setup and could signal another test of the green support zone.
Summary
Buy zone: Above 202.20–202.30 (confirmation above Tenkan/Kijun lines)
Target 1: 203.20
Target 2: 204.30–204.40
Stop-loss: 201.50
BTC-D

SOL/USDT (1H timeframe)...SOL/USDT (1H timeframe):
Here’s a clear technical breakdown 👇
🧭 Chart Overview:
Current price: around $200.40
Trend: Uptrend, but showing short-term pullback
Support area: $190 – $195
Resistance area: $205 – $210
🔍 Key Observations:
The ascending trendline is acting as dynamic support.
Price recently rejected near the $210 resistance zone and is pulling back toward the trendline and Ichimoku cloud.
The target points marked on my chart suggest downside retracements if support breaks.
---
🎯 Target Levels:
If price stays above the trendline/support → bullish continuation:
Target 1: $207
Target 2: $212
Target 3: $220 (major breakout target)
If price breaks below the trendline/cloud support → bearish correction:
Target 1: $195 (short-term support / first target point)
Target 2: $188 (lower target zone marked on chart)
Target 3: $180 (major downside target if correction deepens)
---
⚠ Summary:
📈 Bullish scenario: Hold above $198 → move to $207–$212.
📉 Bearish scenario: Break below $198 → drop to $195 → $188.

USD/CAD (3H timeframe) chart...USD/CAD (3H timeframe) chart 👇
🧭 Chart Overview:
Current price: ≈ 1.3979
Trend: Bearish breakdown from support and trendline.
Price has cleanly broken below both the ascending trendline and Ichimoku cloud, confirming a downside continuation.
---
🔍 Key Technical Details:
The previous support zone (1.4010–1.4040) has turned into resistance.
Momentum is bearish after retesting that area and rejecting it.
Two target points are clearly marked on my chart.
---
🎯 Target Levels:
If bearish momentum continues 👇
Target 1: 🟢 1.3900 — first major support / first target
Target 2: 🟢 1.3730–1.3750 — second major target zone (full extension of breakdown)
---
⚙ Trade Setup Suggestion:
Entry (Sell): Below 1.3980 (confirmation of continuation)
Stop Loss: Above 1.4045 (above broken support)
Take Profit 1: 1.3900
Take Profit 2: 1.3730
---
⚠ Summary:
📉 Structure = Bearish
🎯 Targets = 1.3900 → 1.3730
🔄 Resistance = 1.4010–1.4040 (sell zone if retested)

chart for GBP/JPY...chart for GBP/JPY. Based on what I’m seeing + recent technicals, here’s a target-zone scenario for my. Remember: this is a probabilistic view, not a guarantee — set my risk accordingly and use a stop.
---
🔍 Current technical context
GBP/JPY is hovering around ~ 203.0-203.5 (per recent data).
There is resistance near ~ 205.30 according to one analysis.
On the downside, support is referenced around ~ 200.67 or ~ 197.47 in one view.
The pair’s trend signals show a generally bullish macro trend, though short-term momentum might be weakening.
---
🎯 Target zones
Given my chart shows a break of a trendline (uptrend) and a move lower, here are two plausible targets depending on how the move unfolds:
If a bearish move continues (i.e., break of support around ~ 200.6) → A target around 197.50-198.00 is reasonable.
If the price instead holds support and bounces/reverses → A target near or above the resistance around 205.30-207.00 becomes possible.
---
✅ My preferred “play” based on my setup
Since my chart shows a breakdown of an ascending trendline, I lean toward the bearish target path:
Entry: At current ~ 203.0 area (assuming my chart confirms the break).
Stop-loss: Just above the recent high / trend‐line (say ~ 205.50) to manage risk.
Target: ~ 197.50-198.00 (gives about 5-6 points of drop from current).
Risk-reward: Check how many pips my risking vs this target — ensure the reward is larger than the risk.
---
⚠ Things to watch
If price breaks back above ~ 205.30 with good momentum, the bearish scenario is invalidated and my need to pivot.
Macroeconomic/fundamental events (e.g., UK or Japan monetary policy) can blow this setup either way — be aware.
The move to 197.50 might not be smooth — there may be bounces, retests of broken trendline, etc.
---
If you like, I can plot multiple target-levels (e.g., near‐term, mid-term, and stretch) on my exact chart timeframe (1-hour) and we can mark stop and risk-zones.

Will Bitcoin Ready to Next leg down toward $76000?CRYPTOCAP:BTC has completed a bearish retest at the $116K resistance zone, maintaining a bearish bias below $116K–$117K
If price continues to reject this level, I’m anticipating a corrective move toward: $105K → $93K → $76K
However, a confirmed breakout above $117K would invalidate the bearish structure and could trigger an extended rally toward $150K+.
Resistance: $116K–$117K
Support: $105K / $93K / $76K
Bias: Bearish below $116K | Bullish above $117K
Stay disciplined — structure > sentiment.
NFA & DYOR

Will TRON hit $2 in this bull run?If CRYPTOCAP:TRX loses $0.26 I'm deleting this tweet. If it holds? We're going to $2 💎
Currently: $0.26 ✅
Target: $2.00 🔜
Upside: 600%
Bulls in full control and NOT losing this level 💪
Screenshot this tweet
NFA & DYOR

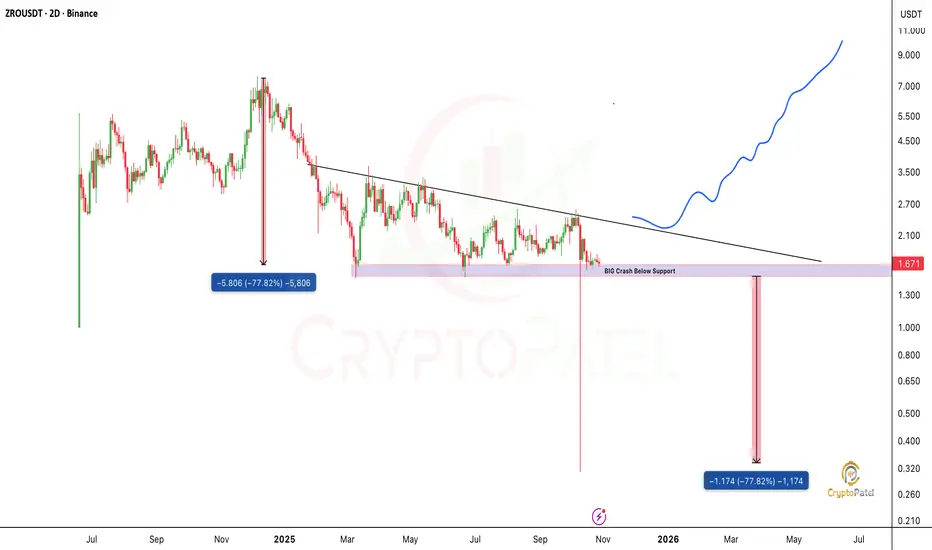
Will $ZRO Dump 70% again?⚠️ MAJOR CSE:ZRO BEARISH CATALYST ALERT ⚠️
CSE:ZRO is forming a bearish flag and trading at a critical support zone, if this level breaks, a 30%-60% crash could follow within days.
Nov 20 Unlock: 25.71M ZRO (~$43M)
🔹 7.29% of circulating supply
🔹 ~22% of market cap releasing
🔹 Only 35.28% supply unlocked so far
This massive unlock could trigger heavy selling pressure on an already fragile chart.
Trade carefull, extreme caution advised until price reclaims key support.
Note: NFA & DYOR
THE ENTIRE MARKET IS ABOUT TO HARD DUMPTHE ENTIRE MARKET IS ABOUT TO HARD DUMP
If #Bitcoin holds the $107K–$104K support: next stop $150K 🚀
But if it fails… prepare for a hard dump toward the $80K zone 😳
This is the make-or-break level.
NFA & DYOR

GBP/USD – 1H Chart...✅ Clear Technical Target Zones (GBP/USD – 1H Chart)
Target Price Zone Why it matters
TP1 1.3420 – 1.3440 Nearest major resistance + previous structure level + matches my first marked target
TP2 1.3485 – 1.3500 Next resistance zone + matches my upper target line + psychological round number
---
⚠ Levels to Watch Below (Support)
Support Zone Why
1.3325 – 1.3340 Kumo (cloud) support + breakout retest zone
If price falls back into the cloud, momentum could weaken. If it stays above the breakout, bullish continuation remains valid toward TP2.
---
Quick Plan (Based on the chart only)
✅ If price pushes above 1.3420 → TP2 becomes more likely
⚠ If price rejects at 1.3420 → retracement is likely first
---
If you want, I can help my refine: ✅ Stop-loss zone
✅ Risk-to-reward
✅ Confirmation signals (Ichimoku + price action combo)

USD/JPY pair and asking for a target...USD/JPY pair and asking for a target, here’s what the technicals suggest — but keep in mind: this is not financial advice — my responsible for my trades.
---
✅ What the technicals are showing
The pair is trading above its 50-week SMA, which suggests a longer-term bullish tilt.
A key resistance level is around 153.26. A breakout above that opens the way to higher targets.
If the breakout happens, one target cited is 158.80 (via a 161.8% projection).
On the flip side, if support fails (specifically ~145.47), the bullish case weakens.
---
🎯 My suggested target
Primary target: ~ 158.80 — with the caveat that my need a clean breakout above ~153.26 to justify it.
Alternate scenario: If the pair fails to break convincingly and support breaks ~145.47, the target becomes a drop toward the support zone instead.
---
🧠 Things to watch / trade‐management points
Confirm breakout: Look for a daily / 4-hour close above ~153.26 and increased momentum.
Risk management: If my entering now, consider placing your stop-loss below support (e.g. 145-147 zone) because a break there weakens the scenario.
Measure rewards vs risk: If my risk is large (large stop), the target must justify it.
Be aware of fundamentals: Events from the Bank of Japan (BOJ) or Federal Reserve (Fed) can shift this quickly.

Silver Futures (MCX) 4-hour chart Silver Futures (MCX) 4-hour chart, and my marked a resistance zone and a downward breakout below the Ichimoku cloud and key support.
Here’s what I can interpret:
Price broke below the Ichimoku cloud, confirming a bearish trend.
There’s a clear resistance area around ₹151,000–₹153,000.
The breakdown happened below the ₹145,000–₹146,000 level.
My marked a target zone below, with a downward arrow.
✅ Likely Target Projection
Using standard technical projection (height of range = target distance):
Resistance zone top: ~₹153,000
Breakdown zone: ~₹145,000
Height: ₹8,000
If we subtract that from the breakdown area:
Target = 145,000 – 8,000 = ₹137,000
🎯 Estimated Short-term Target:
₹137,000 – ₹138,000
This aligns with my chart’s “target point” mark.
If you want to be more precise, you could:
Watch for support around ₹140,000, which might give a bounce.
If that breaks, next major support zone = ₹136,000–₹137,000.

EUR/USD chart...EUR/USD chart:
Chart timeframe: 2H (2-hour chart)
Pattern: It looks like a descending trendline breakout from a consolidation (range) zone, confirmed by Ichimoku signals and upward momentum.
Indicators: Ichimoku Cloud shows price breaking above the cloud — a bullish sign.
Target zone: my marked two “target points” with arrows on my chart.
---
To estimate the target price, let’s infer it based on the chart:
1. Current price (breakout point): ≈ 1.1667
2. Height of the range (pink box): roughly from 1.1520 to 1.1670
→ Range height ≈ 150 pips (0.0150)
If this is a range breakout, then:
Target 1 (conservative): 1.1667 + 0.0150 = 1.1817
Target 2 (extended): another projection from that = 1.1967
---
✅ Targets Summary:
🎯 Target 1: 1.1817
🎯 Target 2: 1.1967
These align with my chart’s two “target point” lines visually.

XAU/USD (Gold) chart on the 3-hour timeframe...XAU/USD (Gold) chart on the 3-hour timeframe, I can see my using the Ichimoku Cloud and have marked a range with a potential breakdown area and a target point already indicated on the chart.
Here’s what the chart suggests:
Current price: around 4031 USD
Range low (support): around 4030 USD (which is currently being tested)
Range high (resistance): around 4190–4200 USD
Breakdown target (measured move): around 3940–3950 USD
📉 Analysis:
Price has broken below the range box, indicating a bearish breakout.
The Ichimoku Cloud ahead is bearish and thick, showing potential resistance.
A measured move from the height of the range (≈ 150–170 points) projects downward to around 3940–3950 USD.
My chart already marks 3944.299 as the target point, which aligns well with this projection.
✅ Target Summary
Type Level (USD) Comment
Short-term target 3,944 Measured move target after range breakdown
Extended target 3,900–3,880 Possible continuation if bearish momentum sustains
Invalidated above 4,090–4,100 If price re-enters the range and closes above the cloud

GBP/JPY (British Pound / Japanese Yen) 1-hour chartGBP/JPY (British Pound / Japanese Yen) 1-hour chart, I have drawn a rising wedge pattern — which is typically a bearish reversal setup once the lower trendline breaks.
Here’s the detailed target analysis:
---
📉 Current price:
Around 203.50
⚠ Breakdown level (support zone):
Around 203.20 – 203.00
If the price closes below this zone, the bearish move is confirmed.
---
🎯 Target 1 (short-term target):
≈ 202.20 – 202.30
This aligns with my first target point marked on the chart — the initial measured move from the wedge height.
---
🎯 Target 2 (extended / full move):
≈ 201.20 – 201.30
This matches my second target point — the full measured projection of the wedge pattern.
---
✅ Summary:
Level Description Zone
🔻 Breakdown Point Confirm sell below 203.20 – 203.00
🎯 Target 1 First profit level 202.20 – 202.30
🎯 Target 2 Final profit level 201.20 – 201.30
⛔ Stop-loss Above recent high 204.00 – 204.20

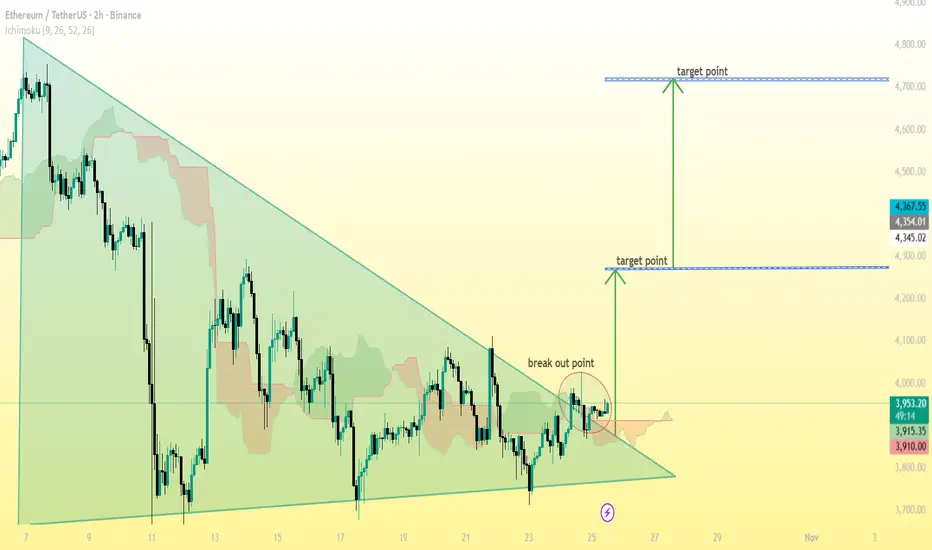
ETH/USDT (Ethereum vs Tether) on the 2-hour timeframe...ETH/USDT (Ethereum vs Tether) on the 2-hour timeframe, the pattern drawn is a symmetrical triangle — a consolidation setup that often leads to a strong breakout.
Here’s the target breakdown based on my chart:
---
📈 Current breakout level:
Around $3,950 – $3,960
🎯 Target 1 (short-term):
Around $4,350 – $4,370
This is the first target after the breakout, matching my chart’s lower target point.
(≈ +10% move from the breakout)
---
🎯 Target 2 (extended / major):
Around $4,700 – $4,750
This is the second target — the measured move from the triangle’s height projected upward.
(≈ +18%–20% move from the breakout)
---
⚠ Support / Stop-loss suggestion:
If price closes back below $3,900, it may invalidate the breakout and signal a false move.
---
✅ Summary:
Breakout point: $3,950
Target 1: $4,350
Target 2: $4,700
Stop loss: $3,900
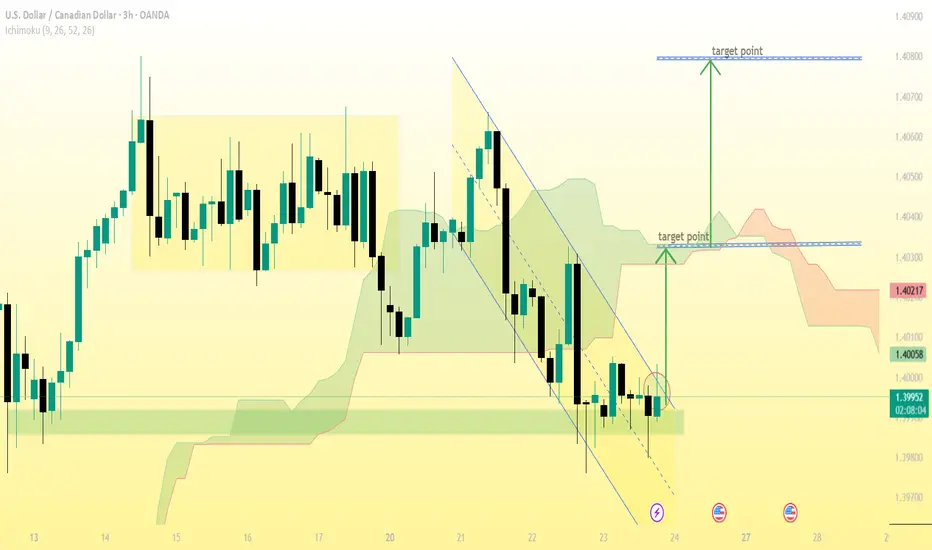
USDCAD (3H chart) setup ...USDCAD (3H chart) setup — here’s what can be seen and the likely target analysis based on my chart:
🔍 Chart Observations:
The pair has broken out of a descending channel (marked by the two slanting lines).
Price is currently around 1.3999 and testing the upper boundary of the breakout.
The chart also uses Ichimoku Cloud, with price beginning to move above the cloud area — a bullish sign.
Two target points are already drawn on my chart.
🎯 Target Levels:
1. First Target (Short-term):
📍 Around 1.4020 – 1.4030
→ This aligns with my first “target point” label and matches initial resistance from the cloud zone.
2. Second Target (Main Bullish Target):
📍 Around 1.4070 – 1.4080
→ This corresponds to the higher target level drawn on my chart and previous horizontal resistance zone.
✅ Summary:
Buy Zone: 1.3980 – 1.4000
TP1: 1.4020
TP2: 1.4070
Stop Loss (SL): Below 1.3960 (under the support base)
This setup supports a bullish breakout continuation toward 1.4070 if the price sustains above 1.4000.
The Market Doesn’t Hate You — It’s Just Doing Its JobEvery trader at some point feels attacked by the market.
You take a trade, it hits your stop loss by one pip… and then runs perfectly in your direction.
You think, “The market is against me.”
But the truth is — the market doesn’t hate you.
It’s simply doing its job: collecting liquidity before moving to its real destination.
💡 Here’s What’s Really Happening
The market is a liquidity machine.
It moves where money is resting — not where traders wish it would go.
When you see price sweeping highs or lows before reversing, that’s not manipulation against you —
it’s Smart Money doing what it’s built to do:
Hunt liquidity
Fill institutional orders
Create displacement before the next move
Your stop loss isn’t being targeted personally —
it’s sitting where millions of other traders’ stops are clustered.
The market simply clears those levels before delivering the real move.
🧠 The Lesson
Stop trading emotionally and start thinking structurally.
Ask yourself before every setup:
Where is liquidity resting?
Has the market collected it yet?
Is structure confirming the new direction?
When you learn to think like Smart Money, you stop blaming the market and start understanding it.
You’ll realize every loss was a lesson pointing you toward better timing, discipline, and patience.
📊 Final Thought
The market is not your enemy — it’s your teacher.
Once you align with how liquidity and structure truly work,
you’ll stop feeling trapped and start trading with clarity and confidence.
💬 Follow for more institutional-based educational posts.
No signals. No hype.
Just pure trading knowledge and Smart Money insights that help you grow.

SOLANA 27,560% CYCLE IS ABOUT TO REPEAT - $9,200 TARGET BY 2029 SOLANA 27,560% CYCLE IS ABOUT TO REPEAT - $9,200 TARGET BY 2029
Previous Bull Cycle Metrics:
1️⃣ Duration: 1,492 days
2️⃣ % Gain: 27,560%
3️⃣ Price: $1 → $295
Now here's where it gets CRAZY...
IF we get a healthy retracement to the golden pocket ($60-$35), and IF the fractal repeats:
1️⃣ Bottom: $60-$35
2️⃣ Same % gain: 27,560%
3️⃣ Same timeframe: 1492 days (Feb 2029)
This is Wyckoff accumulation into parabolic expansion.
The risk/reward is GENERATIONAL
Bookmark this. Screenshot this. Thank me in 2029.
This is just my math based on past fractals & returns. Not financial advice - DYOR

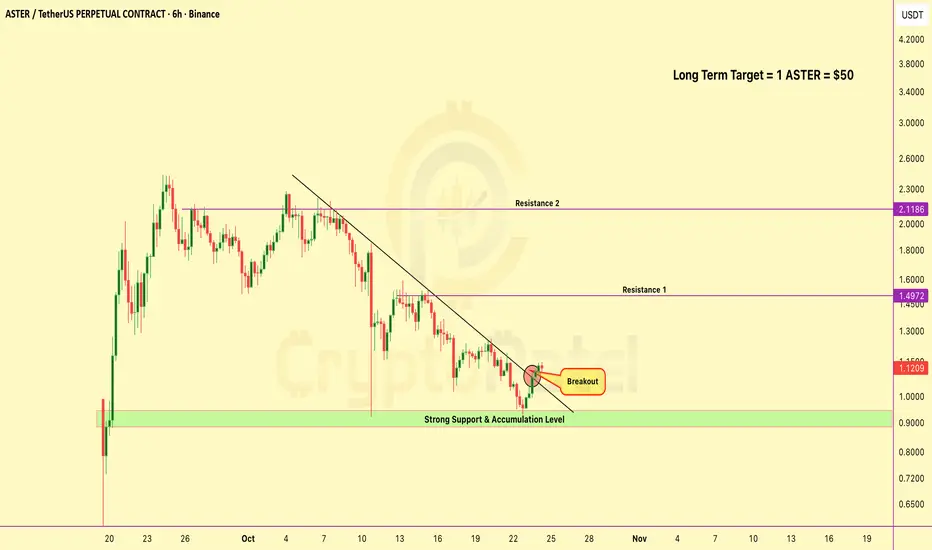
Will $ASTER hit $100 in future which is 100x from Current Price?IMO, SEED_WANDERIN_JIMZIP900:ASTER has the potential to become the next CRYPTOCAP:BNB within 4–5 years. I’m gradually accumulating for the long term.
Accumulation zone: around $1 or below, these levels may not return once the market matures.
If fundamentals and adoption grow as expected, a $50–$100 valuation in the future isn’t impossible.
Note: NFA & DYOR
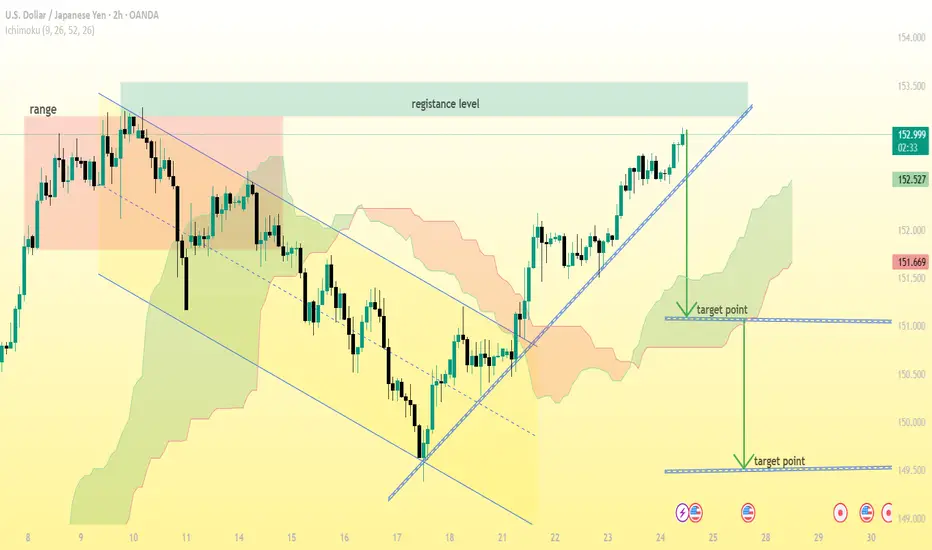
USD/JPY (2H chart)...USD/JPY (2H chart):
The current price is around 152.97, sitting at the upper resistance zone marked on my chart.
There’s a visible ascending trendline, and the price is currently testing or slightly above that line.
My marked two target points below — likely indicating a bearish correction setup if the trendline breaks.
Here’s the detailed breakdown:
---
📉 Bearish Scenario (if price breaks below trendline and 152.50 zone):
1. First Target:
Around 151.65 – 151.70
→ This aligns with my first “target point” label and Ichimoku cloud support.
2. Second Target:
Around 150.30 – 150.50
→ my lower target zone, near the previous consolidation support.
---
📈 Bullish Scenario (if resistance breaks and price sustains above 153.00):
Next resistance levels: 153.50 – 153.80, and then 154.20.
Only valid if there’s a strong close above 153.00 with volume.
---
🔹 Summary:
Scenario Condition Target 1 Target 2
Bearish Break below 152.50 151.65 150.30
Bullish Break & close above 153.00 153.50 154.20
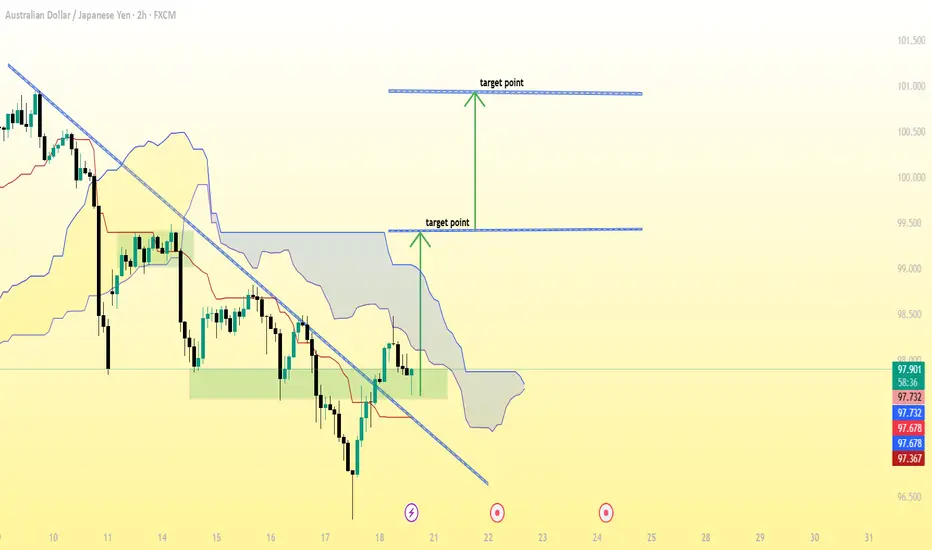
AUD/JPY (2-hour timeframe), here’s a breakdown of what’s visibleAUD/JPY (2-hour timeframe), here’s a breakdown of what’s visible:
The downtrend line has been broken to the upside, suggesting a potential bullish reversal.
The Ichimoku Cloud shows price moving above or attempting to move above the cloud — another bullish signal.
Two target points are already marked on my chart:
1. First target: around 99.50
2. Second (final) target: around 100.75–101.00
✅ Summary of Target Zones:
🎯 Target 1: ~99.50
🎯 Target 2: ~100.75–101.00
📉 Stop Loss Suggestion:
My might place it just below the recent support or below the cloud (around 97.00–97.20 zone), depending on my risk tolerance.
EUR/USD (Euro vs US Dollar) chart on the 2-hour timeframe...EUR/USD (Euro vs US Dollar) chart on the 2-hour timeframe, here’s a detailed breakdown of what my setup is showing and the likely target levels 👇
---
🧭 Chart Overview:
Current price: ≈ 1.1608
My using Ichimoku Cloud, trendlines, and measured move projections.
The chart shows a breakout from a falling channel, with two marked target points above.
---
🎯 Target Points (as per my chart):
1. First Target (Short-term):
Roughly around 1.1680 – 1.1700
This level aligns with the top of the Ichimoku Cloud and previous structure resistance.
It’s my initial profit zone after confirmation of breakout continuation.
2. Second Target (Extended):
Roughly around 1.1780 – 1.1800
This level is derived from the measured move (height of previous range projected upward).
It represents the full bullish objective if momentum sustains.
---
⚙ Trading Logic (Example):
Buy Entry: After breakout retest near 1.1600 – 1.1620
Target 1: 1.1680 – 1.1700
Target 2: 1.1780 – 1.1800
Stop Loss: Below 1.1550 (previous swing low / lower cloud boundary)
---
📊 Potential Gain:
From 1.1600:
Target 1: ≈ +80 pips
Target 2: ≈ +180–200 pips

XAGUSD (Silver/USD) 1-hour chart...XAGUSD (Silver/USD) 1-hour chart, here’s what I can observe and infer about potential target levels:
---
🔍 Chart Summary:
My using Ichimoku Cloud and trendlines.
Price is currently around $49.10.
The chart shows two target points drawn:
1. First Target Point: Around $51.90 – $52.00
2. Second Target Point: Around $54.30 – $54.50
---
🎯 Target Levels Based on the Chart:
1. First Target (Short-Term):
Around $51.9 – $52.0
This coincides with resistance from the previous range and Ichimoku cloud top.
Represents a possible initial take-profit zone if price breaks above current consolidation.
2. Second Target (Extended):
Around $54.3 – $54.5
Aligns with the projected measured move from my trendline channel.
This would be the larger bullish target if price sustains above the $52 breakout zone.
---
📈 Trading Idea (Hypothetical Example):
Buy Zone: Above $49.5 – $49.8 (confirmation breakout)
Target 1: $51.9 – $52.0
Target 2: $54.3 – $54.5
Stop Loss: Below $48.5 support (near Ichimoku base)
