XRP down 10% with 48 hoursCRYPTOCAP:XRP is down 10% on the inverse chart right after the first spot XRP ETF went live in the US
This is why I kept Saying Sell the News. Markets move before headlines.
Retail moves after. That gap is where most people lose money.
NFa & DYOR
Btc-e

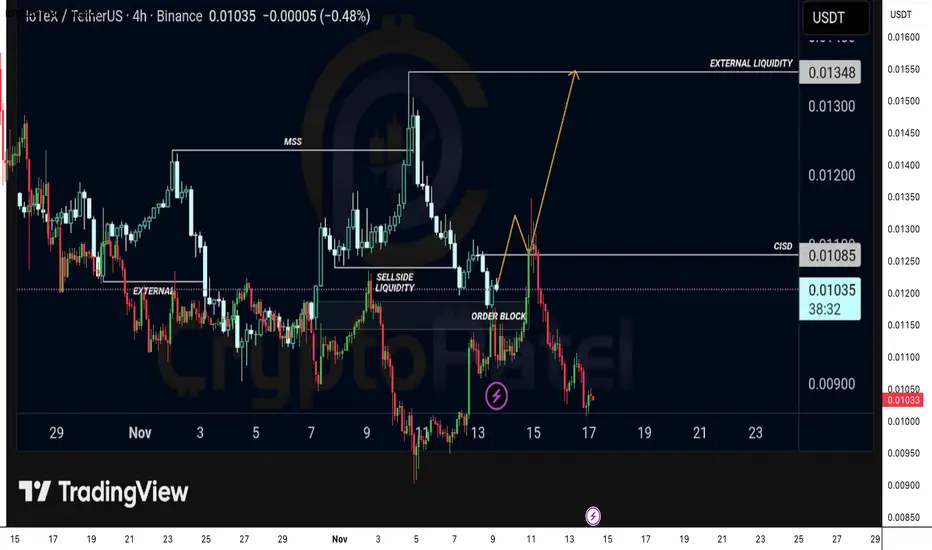
$IOTX / USDT – High Conviction Long SetupCRYPTOCAP:IOTX / USDT – High Conviction Long Setup
Price has already swept sell side liquidity and tapped directly into a fresh bullish Order Block. A decisive candle close above the CISD level at 0.01085 signals strong bullish intent and opens the path toward external liquidity sitting at 0.01348.
Entry 0.01085 | SL 0.00915 | Targets 0.01180 /0.01280 / 0.01348
This setup offers a clean draw on liquidity with an attractive risk to reward profile. If price reclaims CISD with momentum, the upside expansion can be rapid.
Trigger Wait for confirmation above CISD
Note: NFA & DYOR

BITCOIN CME Gap Alert: CME GAP around $91000BITCOIN CME Gap Alert:
As per CME chart, Bitcoin still has an unfilled gap between $91,970 – $92,730.
In my opinion, BTC must revisit around $91,970 to fully close this gap.
Price usually returns to CME gaps because they act as liquidity zones and market inefficiencies, the market tends to fill them before continuing the main trend.
NFa & DYOR

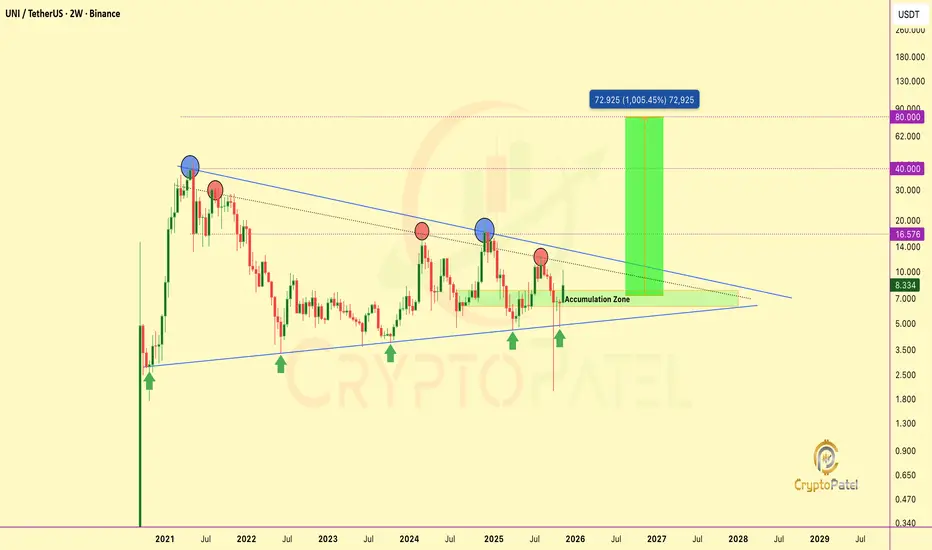
$UNI TA + FA align: Breakout loading toward $80CRYPTOCAP:UNI TA + FA align: Breakout loading toward $80
#UNI is coiling inside a multi-year descending triangle, with strong accumulation at $6–$7.
A breakout above $9–$10 could confirm a macro trend reversal toward $16.5 → $40 → $72+
Catalyst: Uniswap CEO Hayden Adams proposes turning on protocol fees, burning UNI & making it deflationary.
TA + FA = Bullish Expansion Loading...
NFA & DYOR
GBP/USD on the 1-hour timeframe.GBP/USD on the 1-hour timeframe.
There’s a bullish breakout setup drawn, with an upward projection (two labeled “Target Points”).
The breakout seems to be from a descending channel, now shifting to a bullish channel or reversal structure.
From what’s visible:
Current price is around 1.3180 – 1.3190.
The first target level on my chart appears to be around 1.3350.
The second (higher) target level looks around 1.3450 – 1.3500.
✅ Summary
Target 1: 1.3350
Target 2: 1.3450 – 1.3500
These align with a typical breakout move projection (measured move of the prior channel height).

BTC/USDT Timeframe (4-hour)BTC/USDT Timeframe (4-hour)
Current price: ≈ $105,845
My drawn:
A descending trendline (showing previous resistance)
Ichimoku Cloud, and
Two target points marked with green arrows.
---
🔍 Chart Interpretation
From my image:
Price has broken above the descending trendline.
It’s also moving into/above the Ichimoku Cloud, a sign of a potential trend reversal.
My first target appears around $113,000 – $114,000, which aligns with the upper boundary of the drawn arrow.
The second target (higher arrow) points near $117,000 – $118,000, representing the extended bullish target zone.
---
🎯 Possible Targets Based on my Chart
1. Target 1: $113,000 – $114,000
(Short-term resistance / first profit zone)
2. Target 2: $117,000 – $118,000
(Next key resistance / full breakout target)
---
⚠ Risk Note
Watch for retests near $104,000 – $105,000 (the breakout zone).
If BTC closes back below the trendline or Ichimoku cloud, bullish momentum weakens.

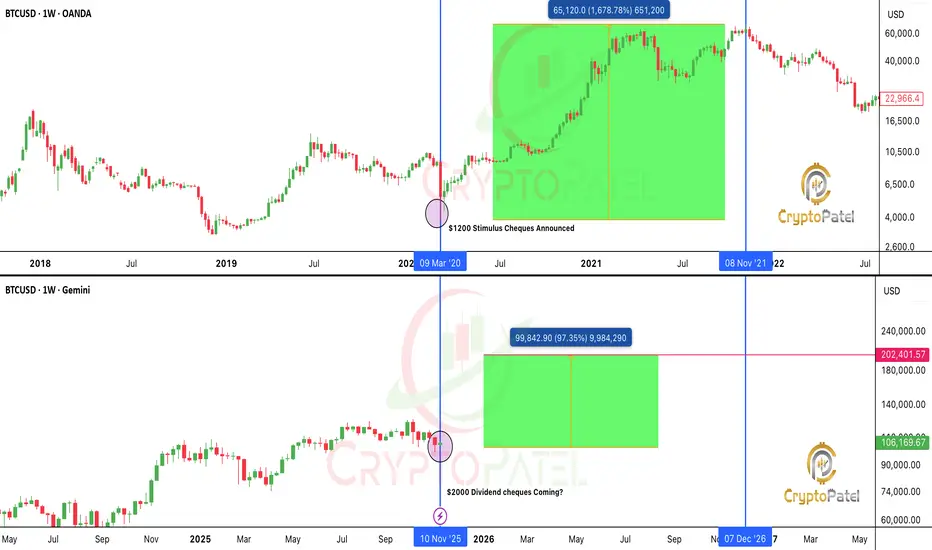
Trump’s $2,000 stimulus = $600B Liquidity: Bitcoin To the Moon?Trump’s $2,000 Stimulus Could Light the Fuse for the Biggest Crypto Rally Ever
This isn’t just another political headline.
If Trump’s plan to send $2,000 stimulus checks funded by tariff dividends actually happens, it could unleash a $600 billion liquidity wave into the economy.
That’s nearly the same scale as the 2020 stimulus, which kicked off one of the most legendary bull runs in history.
🔹 Bitcoin skyrocketed from $3,800 to $69,000
🔹 Ethereum exploded from $90 to $4,800
🔹 Altcoins went absolutely wild, 50x, 100x, even more
But here’s the twist...
This time, the setup is 10x stronger.
In 2020, those checks were about survival, paying rent, buying food, covering bills.
Crypto was new. ETFs didn’t exist. Institutions were on the sidelines.
Now? The game has completely changed.
✅ Crypto is mainstream
✅ Bitcoin ETFs are live
✅ Institutions are ready to buy
✅ Retail access is everywhere
✅ The U.S. economy is growing, not crashing
In 2020, people used stimulus to survive.
In 2025, they’ll use it to invest.
When money flows into a market that’s already primed for risk...
That’s not just bullish, that’s explosive.
The 2020 checks fueled a survival rally.
The 2025 checks could ignite a speculation supercycle.
Imagine $600 billion pouring into a global asset class that’s waiting for liquidity.
Bitcoin. Ethereum. Solana. AI coins. RWA tokens. Meme coins.
History doesn’t repeat but it sure does rhyme.
And this rhyme could make millionaires all over again.
NFA & DYOR
#BITCOIN TECH UPDATE: BEARISH IN CONTROL#BITCOIN TECH UPDATE: BEARISH IN CONTROL
CRYPTOCAP:BTC is down 14% from $115K retest, clean rejection.
Trend remains bearish, structure forming lower highs & lower lows.
Key Zones:
Relief zone: $105K–$108K (short setup area).
Major support: $94K → break below = $76K next.
Momentum:
Selling pressure dominates; no bullish divergence yet.
Invalidation:
Only a close above $111.5K flips bias bullish toward $150K. ( Super Bullish Above $116.5K)
Plan:
Sell rallies. Manage risk. Avoid FOMO longs.
NFA & DYOR

$NEAR Ready for a Massive Breakout: Next Stop $20+ Incoming CRYPTOCAP:NEAR Ready for a Massive Breakout: Next Stop $20+ Incoming
The chart structure looks absolutely explosive right now! $NEAR/USDT has bounced hard from the triangle support, confirming strength and signaling that a massive rally is brewing.
I’ve been accumulating heavy in the $2.50 - $1.90 zone, expecting a big breakout rally ahead!
Targets: $7.70 / $16.70 / $30 / $50
If CRYPTOCAP:NEAR can smash through the $5 resistance, get ready for a vertical flight toward $20+, with long-term eyes on $50
Why I’m ultra-bullish:
✅ Strong recovery from key support zone
✅ Bullish triangle breakout structure
✅ Volume uptick showing accumulation
✅ Momentum shifting rapidly toward bulls
Chart invalidation below $1.50, but above that, it’s looking unstoppable. NFA & DYOR

This is a GBP/JPY (4H) setup This is a GBP/JPY (4H) setup — a bearish structure with two target points clearly marked below the current price.
🧭 Chart Breakdown:
The price has broken below the ascending trendline and the Ichimoku Cloud, showing bearish momentum.
The first target point is at a nearby support level, and the second is a deeper extension move.
🎯 Targets:
First target: around 174.60 – 174.70 zone
Second target: around 172.90 – 173.00 zone
🔍 Summary:
Trend: Bearish below 176.50
Targets:
TP1 → 174.60
TP2 → 172.90
Invalidation: Break back above 176.80 (re-entry into the cloud/trendline)

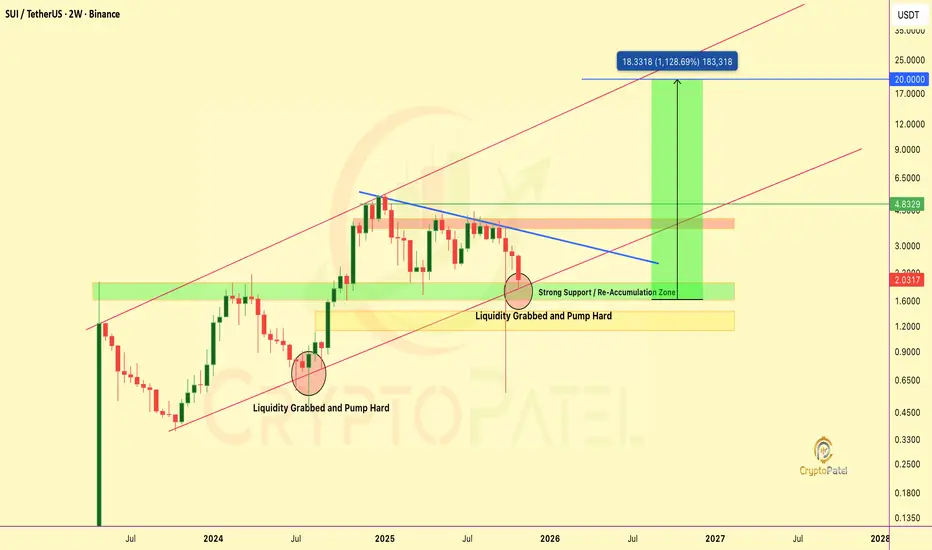
SUI– Breakout Setup Forming, Bulls Eyeing a Move Toward $20SUI/USDT – Breakout Setup Forming, Bulls Eyeing a Move Toward $20
SUI is building a strong re-accumulation base after months of correction. The $1.6–$2 demand zone continues to attract heavy buying interest, the same zone that triggered the last major rally.
Technical Highlights:
✅ Multiple liquidity grabs with strong rebounds
✅ $1.6–$2 zone acting as key accumulation area
✅ Descending trendline compression nearing breakout
✅ Structure remains bullish above $1.6
A confirmed breakout above the descending trendline could launch SUI into a high-momentum phase, targeting higher resistances.
Upside Levels: $4.8 / $10 / $20 – Macro channel target
Accumulation View:
Smart money is active below $2, positioning early before expansion. As long as $1.6 holds, the structure favors a bullish continuation.
High compression. Low noise. When this trendline breaks, volatility will speak loud. NFA & DYOR
ETH/USDT (4H) chartETH/USDT (4H) chart:
The price is currently trading near a support zone (around $3,250–3,300).
The chart shows a potential bullish setup with two marked target points above.
The Ichimoku Cloud suggests resistance around mid-levels before a full reversal.
Here’s the breakdown 👇
🔹 Key Levels:
Support zone: $3,250 – $3,300
First target (inside the cloud): around $3,700 – $3,750
Second target (top / resistance zone): around $4,150 – $4,200
🔹 Summary:
If ETH holds the current support and breaks above the cloud:
Target 1: ≈ $3,700
Target 2: ≈ $4,200
Invalidation: below $3,200 (support breakdown)

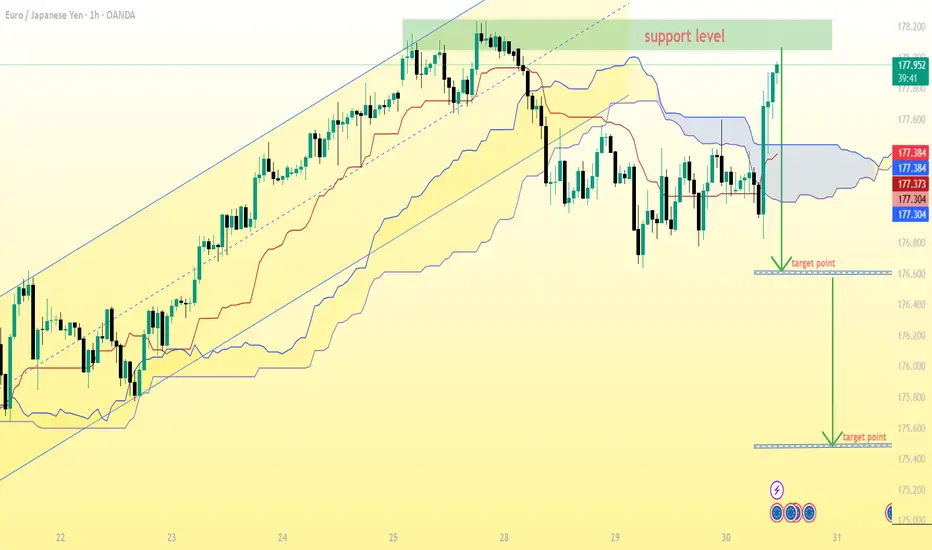
EUR/JPY (1H) chartEUR/JPY (1H) chart, here’s what can be interpreted based on my annotations and price action:
Support level (green zone): around 178.00 – 178.20
Current price: 177.88
Breakdown below cloud: already happened previously, price retested resistance (support turned resistance) and dropped again.
My also drawn two target points below — one short-term and one deeper move.
---
🎯 Target Analysis
From my markings and price structure:
First target (short-term): around 176.40 – 176.50
→ This aligns with my first green arrow and matches a previous minor swing low.
Second target (main target): around 175.20 – 175.30
→ This is the lower arrow, which aligns with the bottom of my previous structure (major support zone).
---
📊 Trade Idea Summary
If my looking at a short setup (since price rejected the resistance zone):
Sell Entry: below 177.70 (confirmation of rejection)
Target 1: 176.40
Target 2: 175.20
Stop-loss: above 178.20 – 178.30 (just above resistance zone)
---
⚖ Risk/Reward (approximate)
If entering at 177.70:
SL: 178.30 (≈ 60 pips risk)
TP1: 176.40 (≈ 130 pips reward)
TP2: 175.20 (≈ 250 pips reward)
➡ R:R = 1:2 to 1:4
---
✅ Conclusion:
My first target is 176.40, and my main target is 175.20.
This setup looks valid if price stays below the 178.00 resistance and cloud confirms bearish momentum.
AUD/JPY 4H chartAUD/JPY 4H chart:
The price was in an upward channel, then broke down sharply below both the Ichimoku cloud and the support trendline.
There’s a clearly marked resistance zone around 100.2–100.6, which the price rejected strongly.
The chart shows a target line drawn downward from the breakout area.
Based on the image, the target point appears to be around the 97.80–98.00 zone.
🔍 Summary:
Resistance: 100.2–100.6
Current price: ≈ 99.21
Bearish breakdown target: 97.8–98.0
Bias: Bearish continuation while below 99.6

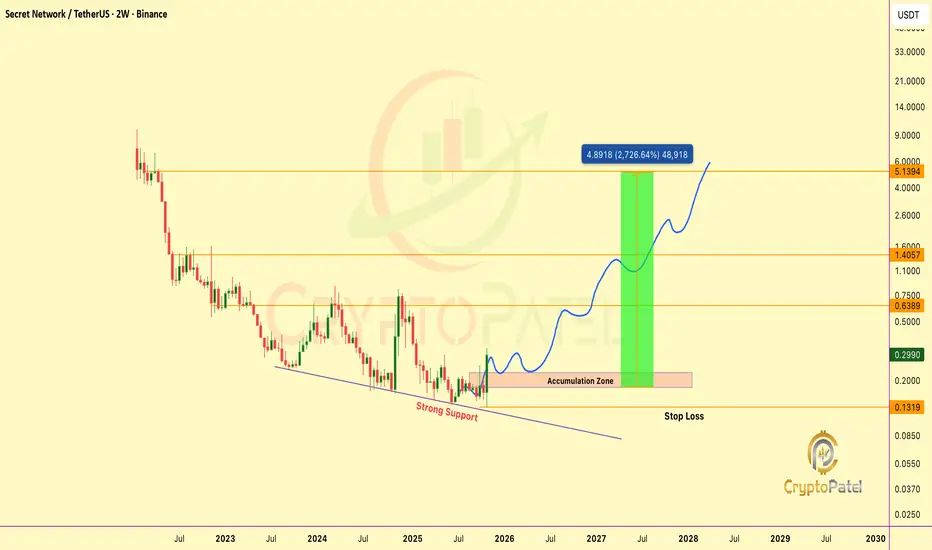
The calm before the storm… $SCRT is getting ready to flyThe calm before the storm… $SCRT is getting ready to fly
#SCRT is showing a strong technical reversal from its multi-year support, forming a clean accumulation base that signals smart money loading up.
Best Accumulation Zone (IMO): $0.24 – $0.18
Once this range holds, we could see a massive breakout kicking off a new macro bull cycle.
Targets:
$0.64 → $1.40 → $5.13+ 🚀
If momentum builds and the team keeps delivering, $5–$10 is possible in the future. This setup is low-risk, high-reward, but always manage your risk, charts show probability, not guarantees.
Smart accumulation today could turn into huge gains tomorrow.
⚠️ Not financial advice. Always DYOR & manage your risk.
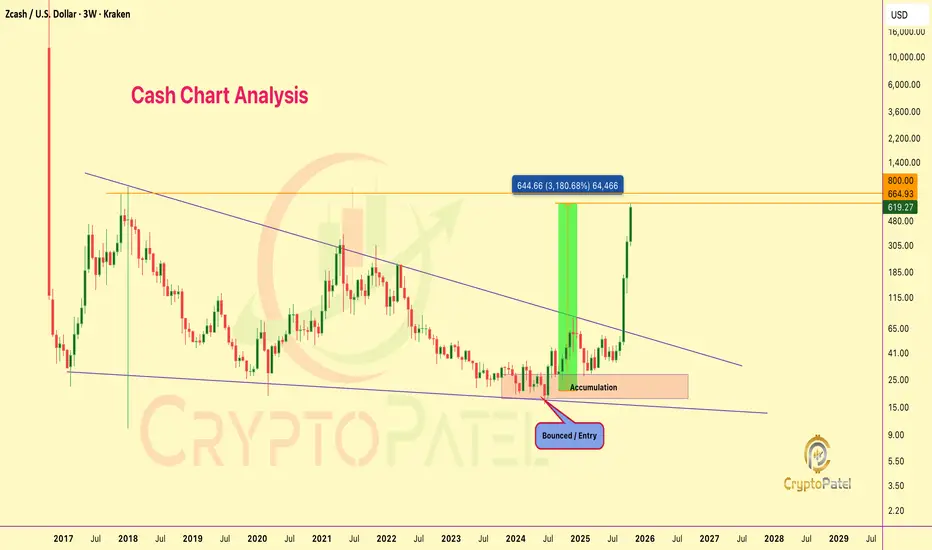
When I called $ZEC at $20, they laughed. Now it’s $662. When I called CRYPTOCAP:ZEC at $20, they laughed. Now it’s $662. Still think I’m crazy?
From our call at $20–$24, CRYPTOCAP:ZEC just went insane: Now at $662 🤯
That’s a massive 3100% GAIN from entry.
I told you legends about that $800 target, and we’re almost there!
Hope you’re counting profits and maybe ordering that new LAMBO already 🏎️
Who believed when I said #Zcash would rise again?
NFA & DYOR
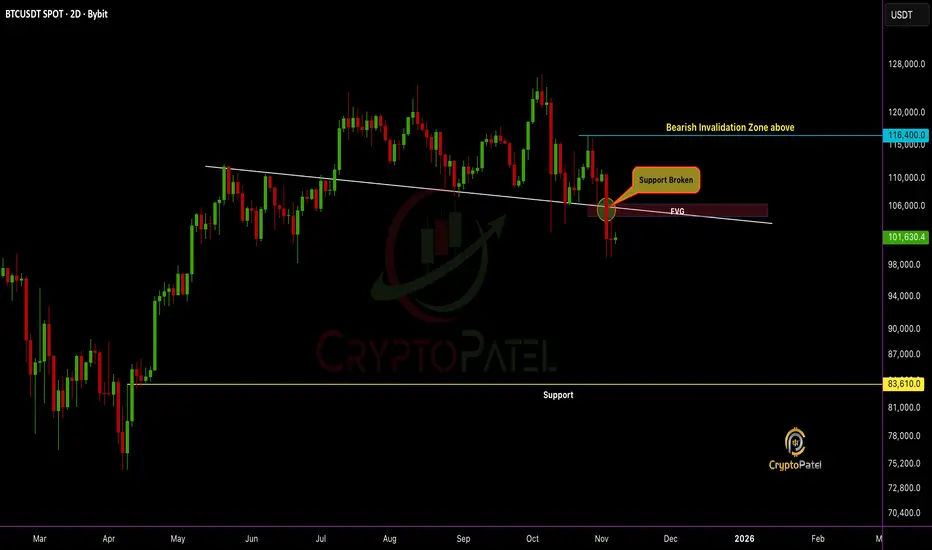
BTC Breakdown Confirmed, Structure Flipped Bearish: Next $88610?BTC Breakdown Confirmed, Structure Flipped Bearish: Next Stop $83,610?
Support is broken and the structure confirms a clear bearish shift.
#Bitcoin failed to reclaim the Fair Value Gap (FVG) zone, turning it into strong resistance.
High chances CRYPTOCAP:BTC could fill the FVG and continue the downside move toward $83,610.
Bulls remain trapped unless price reclaims $116,400, the bearish invalidation zone.
Trend bias remains bearish. Liquidity targets below are in play.
NFa & DYOR
(ETH/USD, 3-hour imeframe...(ETH/USD, 3-hour timeframe, Bitstamp):
The chart clearly shows a descending channel with price breaking below the lower boundary, confirming strong bearish momentum.
The Ichimoku Cloud is fully bearish, and price action is below all major cloud levels — confirming continuation to the downside.
My chart already shows a target point marker at the lower projection level.
📉 Target analysis (based on my chart + structure):
Current Price: ≈ $3,511
Immediate Target (TP1): Around $3,400 (shown near the “target point” on my chart)
Next Target (TP2): Around $3,300 — previous horizontal support & channel extension
Extended Target (TP3): Around $3,180 – $3,200, if bearish momentum accelerates
🔒 Stop-loss (for short trades):
Above $3,650 – $3,700 (upper boundary of current consolidation zone / channel midline)
📈 Summary:
Trend: Bearish continuation
TP1: $3,400
TP2: $3,300
TP3: $3,180
SL: $3,650 – $3,700

XAG/USD (Silver vs USD) chart on the 2-hour timeframe...XAG/USD (Silver vs USD) chart on the 2-hour timeframe:
Price is moving within a descending channel, still below the Ichimoku cloud, indicating continued bearish pressure.
The recent candle is showing a rejection from the upper band of the channel / cloud resistance area (around 47.9–48.1).
My marked two target points on the chart — both aligning with the lower parts of the descending channel.
🎯 Target Zones (Bearish Outlook)
1. First target: around 46.00 – 46.20
→ This aligns with the mid-channel support and my first “target point” marking.
2. Final target: around 42.00 – 42.30
→ This corresponds to the lower channel boundary and my second, deeper target point on the chart.
🔹 Summary
Bias: Bearish below 48.10
Entry area: 47.8 – 48.0 rejection zone
Targets:
🎯 TP1 = 46.10
🎯 TP2 = 42.20
Invalidation: A sustained close above 48.20 would weaken this bearish structure and could trigger a cloud breakout.

GBP/USD (1-hour) chart...GBP/USD (1-hour) chart:
Price is moving within a descending channel, and currently testing the upper boundary of that channel.
The Ichimoku cloud above the price suggests a bearish bias, as price remains below the cloud.
There’s a projected leg down (green arrow) marked on my chart — pointing toward the lower channel line.
🎯 Likely Target Zone
If the move respects the current channel and the upper rejection holds:
Short-term downside target: around 1.2910–1.2920, aligning with the lower channel trendline and my marked “target point.”
Intermediate resistance: near 1.3040–1.3060 (top of the cloud / channel upper edge).
Summary:
📉 Sell bias below 1.3040
🎯 Target: 1.2910–1.2920
❌ Invalidation: If price breaks above 1.3070 with strong candles (then potential reversal).

BITCOIN TECH UPDATE: BEARISH DOMINATES MUST READ🚨 BTC TECH UPDATE: BEARISH DOMINATES MUST READ 🚨
CRYPTOCAP:BTC is down 14% from my bearish short at $115,000 retest.
✅ Those who shorted, well played.
✅ Those who avoided longing at the top, capital saved.
Price Action:
#BITCOIN hit 1st support and broke below, trend remains bearish.
Next target: $94,000.
Short-Term Relief:
Expect a bounce toward $105,000–$108,000 (retest + FVG zone) before the next leg down.
Longer-Term:
$94,000 key decision zone → potential drop to $76,000 if bearish momentum continues.
Will update with precision once $94k is reached.
Sentiment: Bearish as forecasted from $115k.
Bullish Trigger:
If BTC breaks $111,500 with HTF candle close, bullish scenario activates → potential ATH toward $150,000.
Trade smart. Watch levels. Manage risk.
Your move: Ride the bearish wave or wait for the relief rally?
NFA & DYOR

BTC First Weekly BB Break Since March: This Changes EverythingFirst Weekly BB Break Since March: This Changes Everything!
Bitcoin is currently testing a key support zone around $104K, forming what appears to be the 5th major support retest in this ongoing bullish cycle.
Historical Pattern Insight:
Each of the previous four support retests (1–4) led to substantial rallies ranging from +70% to +200%, as shown in the green zones.
If the pattern repeats, the next potential upside move (Wave 5) could project CRYPTOCAP:BTC toward the $200K region, marking a ~100% upside from current levels.
New Technical Development:
This week marks Bitcoin’s first breach of the lower Bollinger Band (BB) on the weekly timeframe since March, signaling heightened volatility and potential exhaustion of the current corrective phase.
Bearish Scenario:
A confirmed breakdown below this critical support could trigger a deeper correction toward the $50K area (–55%), similar to previous cycle corrections highlighted in red.
Key Levels to Watch:
🔹 Support: $103K–$100K
🔹 Resistance: $110K, then $135K
🔹 Upside Target: $200K
🔹 Downside Risk: $50K
Indicators:
Bollinger Bands remain squeezed, indicating volatility expansion is near. The weekly mid-band continues to act as dynamic support, but a sustained close below it could shift the bias short-term.
🟩 Bullish Bias remains valid above $100K, invalidated only on a weekly close below support.
🟩 Pattern repetition or deviation here will define Bitcoin’s next macro leg.
NFA & DYOR
