ATTENTION: Bitcoin May Revisit $55K?⚠️ ATTENTION: Bitcoin May Revisit $55K: Here's The HTF Order Block You Need To Know
Don’t panic, this is not a bear market, just a retracement before the next leg up. My current plan:
▶️ Buy Zone: $65,000 – $55,000 (strong support)
▶️ Previous Exit: $122,000 (if you followed my earlier call)
*Chart Insight:*
▶️ 3W timeframe forming an Inverse Head & Shoulders, usually bullish.
▶️ But this pattern is forming near the top, not the bottom → high probability trap.
*Why I’m confident:*
▶️ Strong FVG & Order Block between $65k–$55k = prime re-accumulation zone.
▶️ Next target: $200k – $300k in the medium term.
Patience + strategy > chasing tops. Let the market come to your zones.
NFA & DYOR
Btc-e

Bitcoin From $49k to $126k Target Achieved 📢 Hope you didn’t miss this…
On April 7, 2024, I posted my CRYPTOCAP:BTC chart calling for buys below $50K.
Bids filled perfectly at $49K, and price exploded to a new ATH at $126K.
That’s a +157% move, level-to-level, exactly as projected.
No hype: Just pure technical precision and liquidity flow mastery.

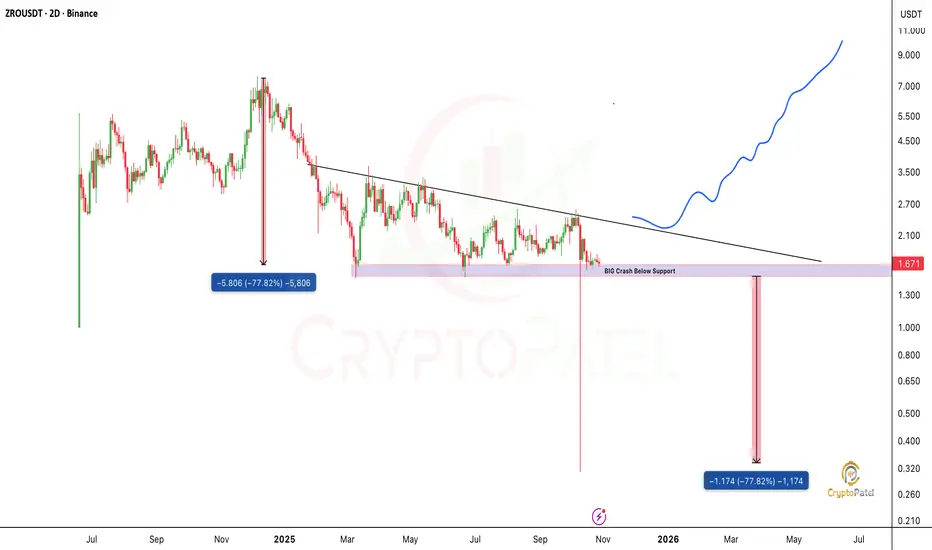
While others panic, $VIRTUAL is Breaking out. Next leg incoming!While others panic, SPARKS:VIRTUAL is Breaking out. Next leg incoming!
While the whole market is bleeding, SPARKS:VIRTUAL is quietly showing strength and breaking its long-term bear trendline, this is not just noise, it’s a confirmed shift in market structure.
Technical Outlook:
🔹 Price has flipped into bullish mode on HTF structure.
🔹 Holding above $1.35 keeps momentum alive, this is the key level for continuation.
🔹 Next resistance targets: $5 → $7 → $10 zone.
🔹 A dip below $1.35 could retest the $1.00 demand area, a golden entry for strong hands.
🔹 Only a confirmed close below $0.70 would invalidate the long-term bullish setup.
Sentiment Check:
While others panic, smart money is accumulating. The trend reversal is already in play, early positioning matters most.
SPARKS:VIRTUAL has officially flipped the script.
If price holds structure, expect a massive momentum rally once the market stabilizes.
Remember: Fear creates opportunities. Charts don’t lie, price action speaks louder than noise.
Not financial advice. Do your own research.

BTC/USDT (4h timeframe)...BTC/USDT (4h timeframe), I can summarize what’s visible and help interpret my targets:
Current price: Around $107,469
Chart setup: my using Ichimoku Cloud (Kumo) with marked zones:
Resistance level (green zone) around $107,000 – $108,000
Two target points drawn on the chart:
First target point: around $111,350 – $111,500
Second (higher) target point: around $116,500 – $117,000
✅ Summary of target levels visible on my chart:
1. Target 1: ~$111,350
2. Target 2: ~$116,700
These targets are likely based on a breakout above the Ichimoku Cloud and prior resistance zones.

XAU/USD (Gold Spot vs. U.S. Dollar) 1-hour chart XAU/USD (Gold Spot vs. U.S. Dollar) 1-hour chart on TradingView.
Here’s what I can observe:
There is a symmetrical triangle pattern (a type of consolidation pattern) drawn on the chart.
The price appears to be breaking out upwards from the triangle.
There’s an arrow drawn upward with a “target point” marked above current price levels.
To calculate the target from this breakout:
📈 Symmetrical Triangle Target Formula:
Target = Breakout Point ± (Height of the Triangle)
1. Measure the height of the triangle:
From the highest point of the pattern to the lowest point within the triangle.
Approximate values (from the chart):
High ≈ 4,080
Low ≈ 3,940
→ Height ≈ 140 points
2. Add the height to the breakout level:
Breakout ≈ 4,000
→ Target ≈ 4,000 + 140 = 4,140
🎯 Estimated Target: 4,140 USD
That matches closely with the dashed horizontal line labeled “target point” on my chart — right around 4,120–4,140.
So, my bullish target zone after breakout is approximately 4,120–4,140 USD per ounce.

$LTC to $500–$1000? Could Explode in the Next Alt SeasonCRYPTOCAP:LTC to $500–$1000? Could Explode in the Next Alt Season
CRYPTOCAP:LTC has been slow-growing, but I see strong potential here. I’m holding tight.
Imo, CRYPTOCAP:LTC could easily hit $500 during the next alt season. If it drops below or near $90, that’s a solid opportunity to accumulate for long-term gains.
A 10x from here isn’t impossible: $500–$1000 is within reach, but it will require patience.
Worth noting: CRYPTOCAP:LTC didn’t hit a new ATH after the 3rd halving, unlike the first two, which reached new highs within about 1000 days. This suggests there’s still a real chance for CRYPTOCAP:LTC to hit a new ATH within the next one Year.
Stay patient, plan your entries, and don’t get caught up in FOMO.
⚠️ Disclaimer: NFA. Crypto is risky. DYOR and only invest what you can afford to lose.

$HYPE/USDT Breakdown Confirmed: 30–60% Downside Incoming!$HYPE/USDT Breakdown Confirmed: 30–60% Downside Incoming!
Price broke critical support + completed a bearish retest. I'm positioning for a 30-60% correction from current levels.
TARGET ZONE: $20-$25
Why I'm Bearish Short-Term:
✅ Support turned resistance after break
✅ Already pumped 500%+ in 6 months - early holders are rotating out
✅ Clear distribution pattern forming
✅ Risk/Reward heavily favors shorts here
THE NUCLEAR WARNING: Almost $500M worth of tokens unlocking in the next 28 days.
This isn't FUD - this is math. That kind of supply hitting the market? You do the calculation.
Long-Term Perspective:
$20 zone could be THE generational entry for patient money. But right now? Let the distribution play out.
GETTEX:HYPE Distribution Phase Confirmed? 👇
NFA & DYOR

MicroStrategy Broken 55-SMA so Will Bitcoin follow the Same ?NASDAQ:MSTR Crashes Below 55-Week SMA
History shows: MicroStrategy weakness = early CRYPTOCAP:BTC top warning.
▶️ NASDAQ:MSTR bottom?: ~$115
▶️ CRYPTOCAP:BTC possible floor: ~$75K
Bitcoin is still ready for a new crash if it follows NASDAQ:MSTR below its 55-SMA.
BTCUSDT is at a critical point. Watch, learn, and act & Follow for high-value market updates.
NFa & DYOR

$MSTR Crashes Below 55-Week SMANASDAQ:MSTR Crashes Below 55-Week SMA
History shows: MicroStrategy weakness = early CRYPTOCAP:BTC top warning.
▶️ NASDAQ:MSTR bottom?: ~$115
▶️ CRYPTOCAP:BTC possible floor: ~$75K
Bitcoin is still ready for a new crash if it follows NASDAQ:MSTR below its 55-SMA.
BTCUSDT is at a critical point. Watch, learn, and act & Follow for high-value market updates.
NFA & DYOR

GBP/JPY 2-hour chart...GBP/JPY 2-hour chart, here’s what I can interpret based on my markings:
Range zone (pink box): approximately 203.8 – 204.4
Resistance zone (green box): around 201.0 – 201.5
Current price: ~202.18
Ichimoku cloud: price is just breaking back toward the cloud (potential short-term bullish momentum)
Marked target point: around 204.3 – 204.4
🎯 Target Analysis
If price continues its upward momentum from the bounce near 201.3 (support zone) and breaks above the cloud:
First target: 203.20 (top of the cloud / minor resistance)
Second target (main): 204.30 – 204.40 (the top of my marked range)
📉 Invalidation / Stop-loss idea
If price falls back below 201.70 – 201.50, that would invalidate the bullish setup and could signal another test of the green support zone.
Summary
Buy zone: Above 202.20–202.30 (confirmation above Tenkan/Kijun lines)
Target 1: 203.20
Target 2: 204.30–204.40
Stop-loss: 201.50

SOL/USDT (1H timeframe)...SOL/USDT (1H timeframe):
Here’s a clear technical breakdown 👇
🧭 Chart Overview:
Current price: around $200.40
Trend: Uptrend, but showing short-term pullback
Support area: $190 – $195
Resistance area: $205 – $210
🔍 Key Observations:
The ascending trendline is acting as dynamic support.
Price recently rejected near the $210 resistance zone and is pulling back toward the trendline and Ichimoku cloud.
The target points marked on my chart suggest downside retracements if support breaks.
---
🎯 Target Levels:
If price stays above the trendline/support → bullish continuation:
Target 1: $207
Target 2: $212
Target 3: $220 (major breakout target)
If price breaks below the trendline/cloud support → bearish correction:
Target 1: $195 (short-term support / first target point)
Target 2: $188 (lower target zone marked on chart)
Target 3: $180 (major downside target if correction deepens)
---
⚠ Summary:
📈 Bullish scenario: Hold above $198 → move to $207–$212.
📉 Bearish scenario: Break below $198 → drop to $195 → $188.

USD/CAD (3H timeframe) chart...USD/CAD (3H timeframe) chart 👇
🧭 Chart Overview:
Current price: ≈ 1.3979
Trend: Bearish breakdown from support and trendline.
Price has cleanly broken below both the ascending trendline and Ichimoku cloud, confirming a downside continuation.
---
🔍 Key Technical Details:
The previous support zone (1.4010–1.4040) has turned into resistance.
Momentum is bearish after retesting that area and rejecting it.
Two target points are clearly marked on my chart.
---
🎯 Target Levels:
If bearish momentum continues 👇
Target 1: 🟢 1.3900 — first major support / first target
Target 2: 🟢 1.3730–1.3750 — second major target zone (full extension of breakdown)
---
⚙ Trade Setup Suggestion:
Entry (Sell): Below 1.3980 (confirmation of continuation)
Stop Loss: Above 1.4045 (above broken support)
Take Profit 1: 1.3900
Take Profit 2: 1.3730
---
⚠ Summary:
📉 Structure = Bearish
🎯 Targets = 1.3900 → 1.3730
🔄 Resistance = 1.4010–1.4040 (sell zone if retested)

chart for GBP/JPY...chart for GBP/JPY. Based on what I’m seeing + recent technicals, here’s a target-zone scenario for my. Remember: this is a probabilistic view, not a guarantee — set my risk accordingly and use a stop.
---
🔍 Current technical context
GBP/JPY is hovering around ~ 203.0-203.5 (per recent data).
There is resistance near ~ 205.30 according to one analysis.
On the downside, support is referenced around ~ 200.67 or ~ 197.47 in one view.
The pair’s trend signals show a generally bullish macro trend, though short-term momentum might be weakening.
---
🎯 Target zones
Given my chart shows a break of a trendline (uptrend) and a move lower, here are two plausible targets depending on how the move unfolds:
If a bearish move continues (i.e., break of support around ~ 200.6) → A target around 197.50-198.00 is reasonable.
If the price instead holds support and bounces/reverses → A target near or above the resistance around 205.30-207.00 becomes possible.
---
✅ My preferred “play” based on my setup
Since my chart shows a breakdown of an ascending trendline, I lean toward the bearish target path:
Entry: At current ~ 203.0 area (assuming my chart confirms the break).
Stop-loss: Just above the recent high / trend‐line (say ~ 205.50) to manage risk.
Target: ~ 197.50-198.00 (gives about 5-6 points of drop from current).
Risk-reward: Check how many pips my risking vs this target — ensure the reward is larger than the risk.
---
⚠ Things to watch
If price breaks back above ~ 205.30 with good momentum, the bearish scenario is invalidated and my need to pivot.
Macroeconomic/fundamental events (e.g., UK or Japan monetary policy) can blow this setup either way — be aware.
The move to 197.50 might not be smooth — there may be bounces, retests of broken trendline, etc.
---
If you like, I can plot multiple target-levels (e.g., near‐term, mid-term, and stretch) on my exact chart timeframe (1-hour) and we can mark stop and risk-zones.

Will Bitcoin Ready to Next leg down toward $76000?CRYPTOCAP:BTC has completed a bearish retest at the $116K resistance zone, maintaining a bearish bias below $116K–$117K
If price continues to reject this level, I’m anticipating a corrective move toward: $105K → $93K → $76K
However, a confirmed breakout above $117K would invalidate the bearish structure and could trigger an extended rally toward $150K+.
Resistance: $116K–$117K
Support: $105K / $93K / $76K
Bias: Bearish below $116K | Bullish above $117K
Stay disciplined — structure > sentiment.
NFA & DYOR

Will TRON hit $2 in this bull run?If CRYPTOCAP:TRX loses $0.26 I'm deleting this tweet. If it holds? We're going to $2 💎
Currently: $0.26 ✅
Target: $2.00 🔜
Upside: 600%
Bulls in full control and NOT losing this level 💪
Screenshot this tweet
NFA & DYOR

Will $ZRO Dump 70% again?⚠️ MAJOR CSE:ZRO BEARISH CATALYST ALERT ⚠️
CSE:ZRO is forming a bearish flag and trading at a critical support zone, if this level breaks, a 30%-60% crash could follow within days.
Nov 20 Unlock: 25.71M ZRO (~$43M)
🔹 7.29% of circulating supply
🔹 ~22% of market cap releasing
🔹 Only 35.28% supply unlocked so far
This massive unlock could trigger heavy selling pressure on an already fragile chart.
Trade carefull, extreme caution advised until price reclaims key support.
Note: NFA & DYOR
THE ENTIRE MARKET IS ABOUT TO HARD DUMPTHE ENTIRE MARKET IS ABOUT TO HARD DUMP
If #Bitcoin holds the $107K–$104K support: next stop $150K 🚀
But if it fails… prepare for a hard dump toward the $80K zone 😳
This is the make-or-break level.
NFA & DYOR

GBP/USD – 1H Chart...✅ Clear Technical Target Zones (GBP/USD – 1H Chart)
Target Price Zone Why it matters
TP1 1.3420 – 1.3440 Nearest major resistance + previous structure level + matches my first marked target
TP2 1.3485 – 1.3500 Next resistance zone + matches my upper target line + psychological round number
---
⚠ Levels to Watch Below (Support)
Support Zone Why
1.3325 – 1.3340 Kumo (cloud) support + breakout retest zone
If price falls back into the cloud, momentum could weaken. If it stays above the breakout, bullish continuation remains valid toward TP2.
---
Quick Plan (Based on the chart only)
✅ If price pushes above 1.3420 → TP2 becomes more likely
⚠ If price rejects at 1.3420 → retracement is likely first
---
If you want, I can help my refine: ✅ Stop-loss zone
✅ Risk-to-reward
✅ Confirmation signals (Ichimoku + price action combo)

USD/JPY pair and asking for a target...USD/JPY pair and asking for a target, here’s what the technicals suggest — but keep in mind: this is not financial advice — my responsible for my trades.
---
✅ What the technicals are showing
The pair is trading above its 50-week SMA, which suggests a longer-term bullish tilt.
A key resistance level is around 153.26. A breakout above that opens the way to higher targets.
If the breakout happens, one target cited is 158.80 (via a 161.8% projection).
On the flip side, if support fails (specifically ~145.47), the bullish case weakens.
---
🎯 My suggested target
Primary target: ~ 158.80 — with the caveat that my need a clean breakout above ~153.26 to justify it.
Alternate scenario: If the pair fails to break convincingly and support breaks ~145.47, the target becomes a drop toward the support zone instead.
---
🧠 Things to watch / trade‐management points
Confirm breakout: Look for a daily / 4-hour close above ~153.26 and increased momentum.
Risk management: If my entering now, consider placing your stop-loss below support (e.g. 145-147 zone) because a break there weakens the scenario.
Measure rewards vs risk: If my risk is large (large stop), the target must justify it.
Be aware of fundamentals: Events from the Bank of Japan (BOJ) or Federal Reserve (Fed) can shift this quickly.

Silver Futures (MCX) 4-hour chart Silver Futures (MCX) 4-hour chart, and my marked a resistance zone and a downward breakout below the Ichimoku cloud and key support.
Here’s what I can interpret:
Price broke below the Ichimoku cloud, confirming a bearish trend.
There’s a clear resistance area around ₹151,000–₹153,000.
The breakdown happened below the ₹145,000–₹146,000 level.
My marked a target zone below, with a downward arrow.
✅ Likely Target Projection
Using standard technical projection (height of range = target distance):
Resistance zone top: ~₹153,000
Breakdown zone: ~₹145,000
Height: ₹8,000
If we subtract that from the breakdown area:
Target = 145,000 – 8,000 = ₹137,000
🎯 Estimated Short-term Target:
₹137,000 – ₹138,000
This aligns with my chart’s “target point” mark.
If you want to be more precise, you could:
Watch for support around ₹140,000, which might give a bounce.
If that breaks, next major support zone = ₹136,000–₹137,000.

EUR/USD chart...EUR/USD chart:
Chart timeframe: 2H (2-hour chart)
Pattern: It looks like a descending trendline breakout from a consolidation (range) zone, confirmed by Ichimoku signals and upward momentum.
Indicators: Ichimoku Cloud shows price breaking above the cloud — a bullish sign.
Target zone: my marked two “target points” with arrows on my chart.
---
To estimate the target price, let’s infer it based on the chart:
1. Current price (breakout point): ≈ 1.1667
2. Height of the range (pink box): roughly from 1.1520 to 1.1670
→ Range height ≈ 150 pips (0.0150)
If this is a range breakout, then:
Target 1 (conservative): 1.1667 + 0.0150 = 1.1817
Target 2 (extended): another projection from that = 1.1967
---
✅ Targets Summary:
🎯 Target 1: 1.1817
🎯 Target 2: 1.1967
These align with my chart’s two “target point” lines visually.

XAU/USD (Gold) chart on the 3-hour timeframe...XAU/USD (Gold) chart on the 3-hour timeframe, I can see my using the Ichimoku Cloud and have marked a range with a potential breakdown area and a target point already indicated on the chart.
Here’s what the chart suggests:
Current price: around 4031 USD
Range low (support): around 4030 USD (which is currently being tested)
Range high (resistance): around 4190–4200 USD
Breakdown target (measured move): around 3940–3950 USD
📉 Analysis:
Price has broken below the range box, indicating a bearish breakout.
The Ichimoku Cloud ahead is bearish and thick, showing potential resistance.
A measured move from the height of the range (≈ 150–170 points) projects downward to around 3940–3950 USD.
My chart already marks 3944.299 as the target point, which aligns well with this projection.
✅ Target Summary
Type Level (USD) Comment
Short-term target 3,944 Measured move target after range breakdown
Extended target 3,900–3,880 Possible continuation if bearish momentum sustains
Invalidated above 4,090–4,100 If price re-enters the range and closes above the cloud

GBP/JPY (British Pound / Japanese Yen) 1-hour chartGBP/JPY (British Pound / Japanese Yen) 1-hour chart, I have drawn a rising wedge pattern — which is typically a bearish reversal setup once the lower trendline breaks.
Here’s the detailed target analysis:
---
📉 Current price:
Around 203.50
⚠ Breakdown level (support zone):
Around 203.20 – 203.00
If the price closes below this zone, the bearish move is confirmed.
---
🎯 Target 1 (short-term target):
≈ 202.20 – 202.30
This aligns with my first target point marked on the chart — the initial measured move from the wedge height.
---
🎯 Target 2 (extended / full move):
≈ 201.20 – 201.30
This matches my second target point — the full measured projection of the wedge pattern.
---
✅ Summary:
Level Description Zone
🔻 Breakdown Point Confirm sell below 203.20 – 203.00
🎯 Target 1 First profit level 202.20 – 202.30
🎯 Target 2 Final profit level 201.20 – 201.30
⛔ Stop-loss Above recent high 204.00 – 204.20
