BTC - 15th Aug - Buy Price as shown in chart around 118 and below is 2nd wave support and buy zone for upper 3rd wave. Trend is Bullish. SPX open higher than yesterday is bullish. I am expecting BTC moving to again new ATH or at least previous high. Risk - big players may manipulate to get their liquidity ... they too need to buy before pushing price to upside.... hold 50 to 60% long in BTC and hold tight for higher levels in coming days or even for today. All US , Europe Data is +ve for US equity and BTC. Dollar Index is crashing as expected fiat money. BTC will go up for sure
BTC-M

BTCUSDT – Continuing the Uptrend, Targeting 124,000 USDBTCUSDT continues its strong uptrend, with price moving within a stable ascending channel. The nearest support is at 116,900 USD, where the price has bounced and maintained its upward momentum. Recent fundamental factors, including rising demand and positive market sentiment towards Bitcoin, are driving this growth. The next target for BTCUSDT is the resistance zone at 124,000 USD. If this level is broken, BTC could move towards 135,000 USD.
Trading Strategy: Buy when the price tests support at 116,900 USD and wait for confirmation of continued upward movement. The target is 124,000 USD, and beyond that, 135,000 USD. Place a stop-loss below 116,000 USD. As long as the price remains above 116,900 USD, the uptrend remains intact.

BTC - 14th Aug - Buy re enter level - Buy below 121 for TP -131In my previous charts i clearly commented to Book Profit.
No Price has done correction 2nd wave all most done and
is expected to take key support at support & resistance
inter change zone marked in green in chart. This area is strong support zone forming a
strong W formation and rectangle of support given breakout on
up side. I strongly expect price to take support from here and move up side mostly.
Keep buying the dips with money management.
This view is given before US Jobs data expected in less than 1 hr from now
As pointed out earlier given CPI data failed to create any impact.
In my view this Jobs data too is not important for Bitcoin but few people
listen to others and do buy or sell ... Market makers need to pull BTC from others.
Buy BTC below 121 in small qty and green area at 121300 is strong level to accumulate.
Up move could be in sub waves which we will know based on price action.
We got Buy levels for now. Price went to new ATH due to so many big whales massive
buying and they are holding ... only the weak hands keep seeing US data and other news sell.
All corrective trend have lesser volume compared to main trend.
US Dollar Index and Dollar - Fiat money will keep crashing and Bitcoin going to Moon - 150 or 180 after 131 K

BTC Update 15th august BTC recovers the inefficiency left on10th July, bouncing on the support level at 111K and returning on the last target, in the red zone.
From a technical point, this is could be forecast following the empty zone, as the wick on July 14th, which underlines a POL (point of liquidity), also supported by the heatmap liquidation.
Fundamentally, this new sphere of positivity and institutional adoption is helping BTC's rally to conclude this cycle with the utter targets.
The grow in the past cycle is been sustained- less hyped than the previous two. Both due to the high currency price of the Big coin, which makes difficult have a high percentage changes in short time, and due the consistent consolidation of the VIX index. At the same time, the entrance of new institutional players, as side general traders, investors and big whales, has stabilized a bit the market in terms of entrance and exit, make it more forecastable and stable.
New targets in the next post.
Thanks for reading,
M

BTCUSDT – Uptrend ContinuesThe chart shows that Bitcoin (BTC) is moving within a strong ascending channel , with strong support at 117,300 USD. The current pattern indicates that each time the price tests this support level, BTC bounces back strongly, showing that buying pressure is dominant. The price has continuously broken through key resistance levels and is now heading towards 130,000 USD , where it may encounter strong resistance .
Regarding the news, although there are no direct events impacting Bitcoin today, the global cryptocurrency market continues to benefit from the stability of other risk assets and growing interest in assets like Bitcoin. Expectations for cryptocurrency adoption in major countries and the increase in Bitcoin investment funds are also driving the uptrend.
Currently, BTC is facing resistance at 3,407 USD, and if it breaks through successfully, it could continue to rise towards 3,450 USD. However, strong support remains at 3,330 USD, which could lead to a bounce if there is a minor pullback.
Strategy:
Buy around 117,300 USD, with a target of 130,000 USD.
Stop loss below 117,000 USD to protect the position in case the support is broken.

Will TRON hit $1 Club?TRON rise has been nothing short of epic.
From $0.0068 at launch to $0.36 today, over 50x growth.
$1 isn’t a dream anymore… it’s getting closer every day.
Who’s ready for CRYPTOCAP:TRX to crash into the $1 club? 🚀
NFA & DYOR

BTC - 13th Aug viewPrice seems to be making sub waves inside the 5th wave where we have new ATH targets open.
In the sub waves price just took 2nd wave support and make 3rd wave and need to see 4th sub wave re test 120200 to 120400 support area or else make false move by breaking to 118 which is a possibility but i do not want or do not expect it to happen after such a good up move. Just want to caution so money management is taken care and do trade only with 50 to 60% capital all ways. buy the dips and sell the rallies with profits and with no greed for more and more without taking profits... we will get dips too... or at least higher low with proved support to take raisk instead of chasing

ILV Setup – Consolidation at Major SupportAfter a strong rally, ILV has pulled back and is now consolidating within a major support zone — setting the stage for a potential next leg higher.
Trade Setup:
• Entry Zone: $17.00 – $18.00
• Take Profit Targets:
🥇 $20.00 – $24.00
🥈 $29.00 – $35.00
• Stop Loss: Just below $16.00

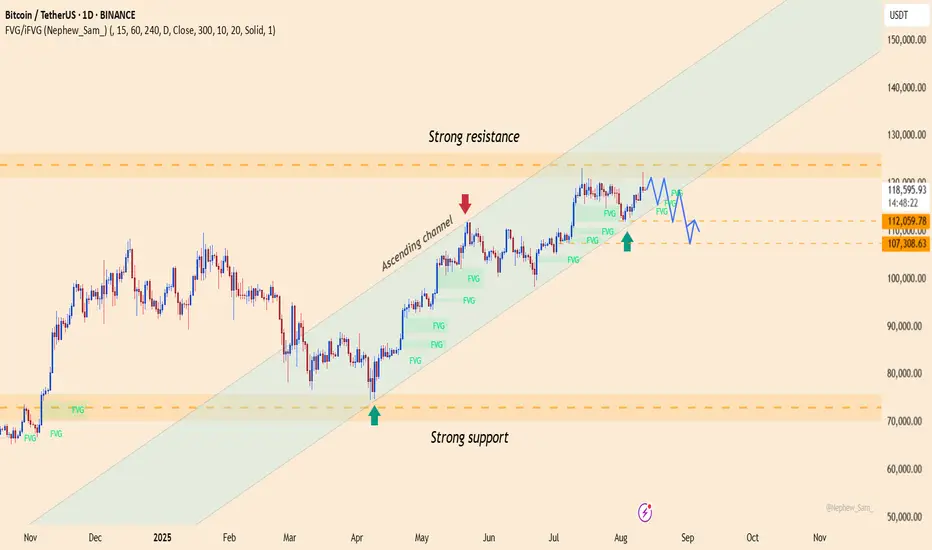
BTCUSDT – Bulls Maintain Control, Upside Scenario IntactOver the past two days , the crypto market has been supported by a series of positive developments: yesterday, U.S. PPI data cooled, easing inflationary pressure and strengthening expectations that the Fed may soon cut interest rates; today, global risk sentiment improved as U.S. and European stock indices rebounded; and most recently, Bitcoin ETF inflows continued to post net gains, signaling that institutional investors remain confident in the bullish trend.
On the daily chart , BTC is still moving within an ascending channel, with a strong resistance zone around 121,000 – 122,000 USDT. Currently, the price is consolidating right near the upper boundary of the channel, showing that buying pressure remains in control. The strong support zone lies between 112,000 – 110,000 USDT, aligning with the channel’s lower boundary.
Preferred strategy: look for buying opportunities if the price pulls back toward 112,000 – 110,000 USDT, targeting a return to 121,000 USDT and potentially new highs. The bullish trend remains intact as long as the price stays within this ascending channel.
BTC - 12thAug2025 - 4th wave bottom and 5th wave TP - 1248004th wave has fallen more because 2nd wave was also bigger. 4th wave bottom is expected in the zone marked in green where we have W formed support and this area is vital to call the trend is in bull trend and no change of character untill this area holds. my wave count is in line with all analysts so far and if this support is broken then BTC is too much manipulation, This view is shared before important US data so stay cautious in money management. Its good level to buy BTC and hold at least 60% long as its a key technical support area and potential move to new ATH from here with out further down move.

Will Dogecoin hit $2 in Coming rally ?DOGE/USDT – Technical Analysis Update
CRYPTOCAP:DOGE is maintaining a solid structural support above the $0.150 key demand zone, with price action showing consistent defense of this level. As long as this zone remains protected on higher timeframes, bullish market structure remains intact for the current bull cycle and altseason.
Accumulation Zone: $0.230 – $0.180
This range aligns with prior demand imbalances and marks an optimal spot entry zone for long-term positioning.
A sustained hold and breakout from this accumulation range could open the path toward higher liquidity targets.
Upside Targets:
Target 1: $0.50 (mid-cycle resistance & liquidity pool)
Target 2: $1.00 (psychological level)
Target 3: $2.00 (macro cycle extension)
Bias: Bullish – Favoring spot accumulation within range
Invalidation: Daily close below $0.150 would shift bias to neutral/bearish
Price structure suggests CRYPTOCAP:DOGE is coiling for a high-momentum breakout once key liquidity levels are breached.
NFA & DYOR

BTCUSDT – pressure building before the breakoutMarket context:
US trade policy eases restrictions for certain major tech companies → risk appetite improves.
Expectations of a more dovish Fed → capital flows return to the crypto market.
Sentiment & flows:
Short-term Bitcoin holdings increase by around 20 billion USD → trading activity is heating up, but profit-taking pressure is also building.
Investors are closely watching the 116,000 USDT level before adding aggressive long positions.
8H technicals:
Support: 112,600 USDT – a zone that has repeatedly triggered rebounds, maintaining the bullish structure.
Resistance: 116,000 USDT – the “gate” that could open the way to 123,000 USDT.
Bullish scenario remains favored if price closes above 116,000 USDT with confirming volume.
Key takeaway:
The market feels like it’s “winding the spring” – tight consolidation before a potential breakout.
A break below 112,600 USDT would invalidate the short-term bullish view and increase the risk of a deeper pullback.

#ETHEREUM – Macro Breakout Setup#ETHEREUM – Macro Breakout Setup 🚀
▶️ 6th time in history testing $4K macro resistance.
▶️ A clean weekly close above could ignite HTF expansion to $8K → $10K → $15K.
6 rejections in 4 years… one breakout can change it all.
NFA & DYOR

Bitcoin targets $133,000 with institutional capital inflowsBitcoin is currently trading in an upward channel, forming higher highs and higher lows, indicating a strong bullish trend.
Capital inflows from major financial institutions like JPMorgan and Citigroup are increasing into BTC, combined with expectations that the Fed will cut interest rates in September, providing positive momentum for the price. The Trump administration's cryptocurrency policies and Syz Capital reopening its BTC Alpha fund with 2,000 BTC have driven strong participation from institutional investors.
Technically, BTC has bounced off the support at $112,816 and could continue toward the resistance at $119,249. A break above this level could set the next target at $133,000 by the end of 2025. Investors should carefully monitor signals and manage risk accordingly.

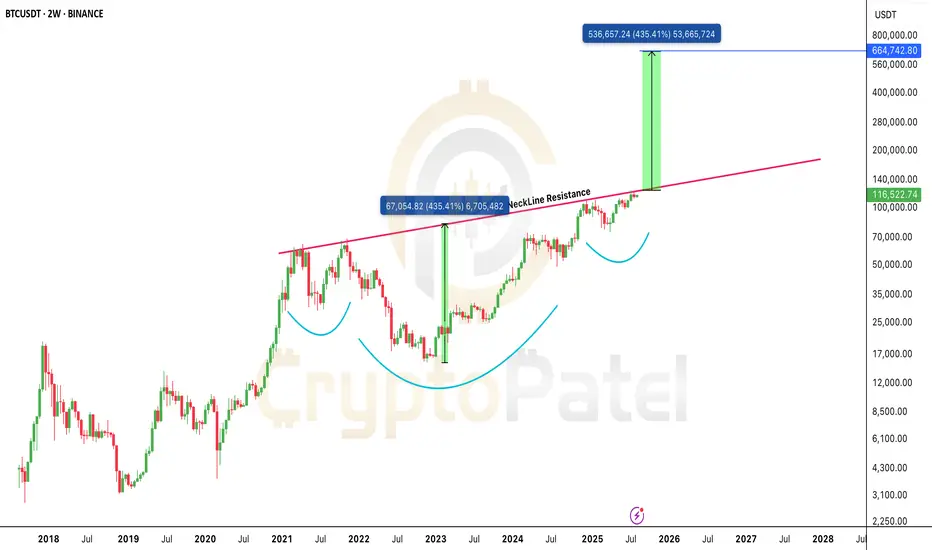
Bitcoin’s $664K Target Is Not a Joke: It’s a Chart-Based WarBitcoin is forming a massive macro structure and the neckline is the final barrier.
Break above it, and the technical target stretches to $664,000.
Yes, you read that right.
This isn’t hopium. It’s based on measured move projections from the breakout zone.
The only question now:
Does BTC explode to $664K this cycle… or in the next?
One breakout changes everything.
Watch the neckline. Stay focused.
Note: NFa & DYOR
KAITO is holding strong - breakout could lead to 500% upside!KAITO is holding strong - breakout could lead to 500% upside!
Price is hovering above a strong accumulation zone ($0.75–$0.90) after hitting the recent bottom at $0.669.
If this base holds, a breakout above the trendline + $1.25 resistance could trigger a bullish move toward:
$2/$3.5/$5+
That’s a 542% upside from the lows.
Watch for breakout confirmation. This setup looks like a Bullish reaccumulation before markup.
Not Financial Advice so DYOR

BTCUSDT – Institutional Money Returns, Signs of a Strong ReboundBitcoin is showing positive recovery signals as major capital flows are re-entering the market. Notably, Syz Capital has successfully raised $200 million to invest in BTC – a strong indicator of growing long-term confidence from institutional investors.
On the H8 chart, BTC remains in a downtrend channel but is forming an accumulation pattern around the 111,000 USDT support area. Previous FVG zones have been filled, suggesting buying pressure is absorbing supply well. Volume is also slightly increasing at the lows – indicating selling pressure is weakening.
If BTC holds above 111,000, a move toward 117,500 is likely, with potential to reach 120,000 if it breaks above the descending channel. This would confirm a clearer medium-term uptrend.

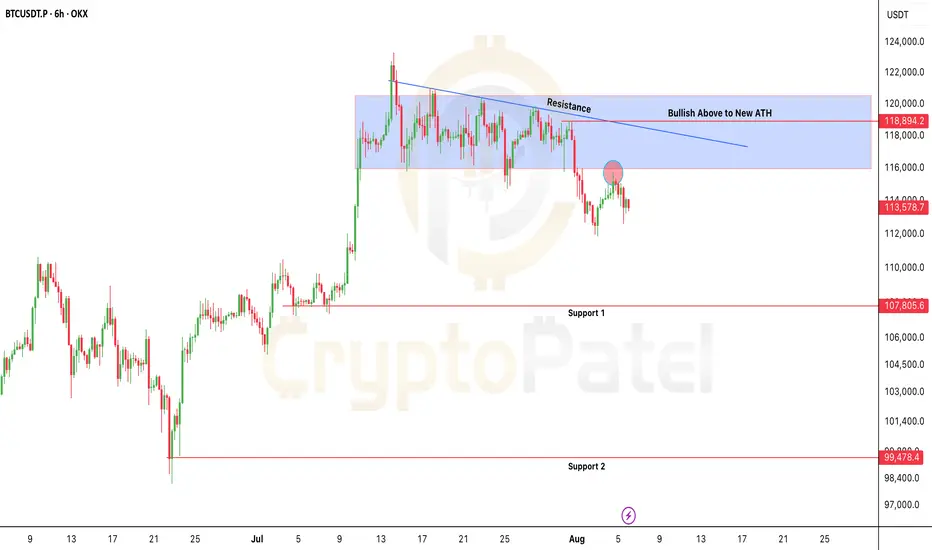
Bitcoin at Risk: $115.7K Is the Line Between Bounce or BreakdownBitcoin at Risk: $115.7K Is the Line Between Bounce or Breakdown
CRYPTOCAP:BTC is trading below key resistance ($115.7K–$118.9K) and rejected cleanly at the trendline.
As long as price holds below $115,700, bearish bias remains.
⚠️ Failure to reclaim = high risk of breakdown toward $107K and even sub-$100K levels.
Bearish invalidation only above $119K
NFA & DYOR
BTCUSDT – Bullish trend remains intactBitcoin is still trading within a long-term ascending channel. After a mild pullback to the FVG zone around 112,100 USDT, the price rebounded and is now consolidating above the ascending trendline support. If this level holds, BTC is likely to continue toward the upper channel target at 122,500 USDT.
Recent news supporting the uptrend:
Fidelity and BlackRock have continued accumulating Bitcoin-related ETF shares.
Weak US jobs data has fueled expectations of a Fed rate cut, drawing capital back into crypto.
Ethereum's upcoming hard fork upgrade is boosting overall market sentiment.
With both technical structure and fundamentals aligned, BTC remains bullish as long as it stays above 112,100.

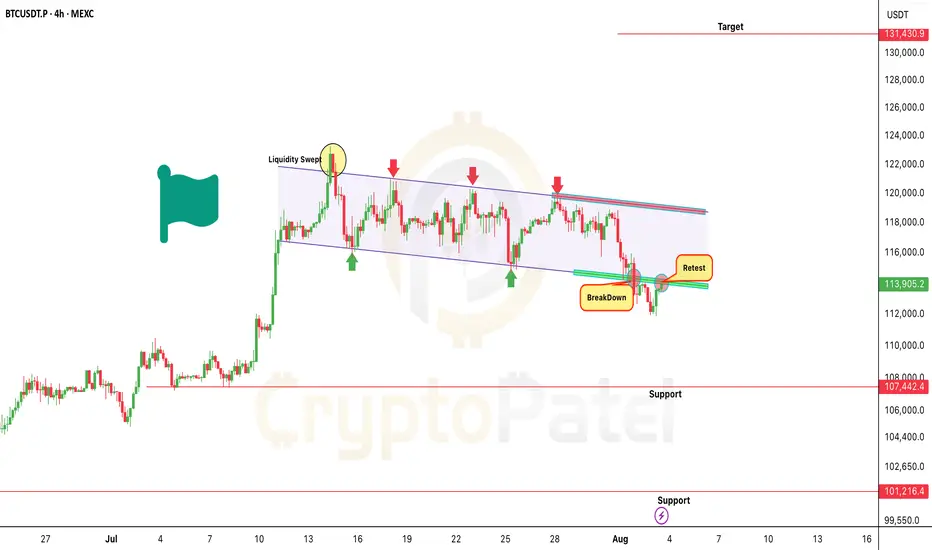
Bitcoin Breakdown or Bull Trap? $100K or $131KAs previously shared CRYPTOCAP:BTC had a potential to tap $114K when it was around $120K.
But now, $114K support has broken, and price is currently trading in the bearish retest zone post-breakdown.
Bearish Targets: $107,000/$101,000
Important Note:
Watch $115,700 zone closely- This could be a liquidity sweep trap.
If any HTF candle (4H/D) closes strongly above $115,700, it invalidates the bearish structure and may flip into a bull flag breakout.
Key Levels:
Bullish Flip Zone: $115,700 (Close Above HTF = Exit Shorts)
Trend Reversal Trigger: HTF close above $119,000 → Can open door to $131,000
Remember:
Trade with confirmation, not assumption.
Always respect key levels and adapt if market structure shifts.
NFA & DYOR
Urgent Bitcoin Update: BTC Must Hold $110K🚨 Urgent Bitcoin Update: BTC Must Hold $110K – Or Risk Dropping Below $100K
BTC is trading near $113,900, sitting right on key support at $112K–$110K.
This zone is crucial- Holding it could lead to a rally toward $150K ATH.
But if BTC breaks below $110K, expect downside pressure with possible moves to: $100K / $93K / $83K
Price has also broken below the ascending trendline- a bearish sign unless bulls step in.
I mentioned exiting around $122K–$123K: Hope you booked profits ✅
Now, just observe how BTC reacts between $110K–$112K.
Note: NFA & DYOR

BTCUSDT – Bitcoin consolidates amid silent institutional buying Bitcoin is fluctuating between 114K and 116K USDT within a long-term ascending channel, supported by a wave of positive news. Weaker-than-expected U.S. labor data has fueled hopes that the Fed may pause its rate hikes — boosting sentiment for risk assets like BTC.
At the same time, major regulatory developments such as the SEC’s “Project Crypto” and the GENIUS Act by the CFTC are laying the groundwork for legalizing the crypto market. Notably, over 30,000 BTC were accumulated by MicroStrategy and institutional funds within just 48 hours — signaling strong capital inflows.
On the daily chart, BTC is forming an inverse cup-and-handle pattern, with 107,280 acting as key support. If the price holds and breaks above 120,872 USDT, a rally toward 130K may follow. However, if inflows weaken, a short-term pullback toward 112K could occur before the next upward move.

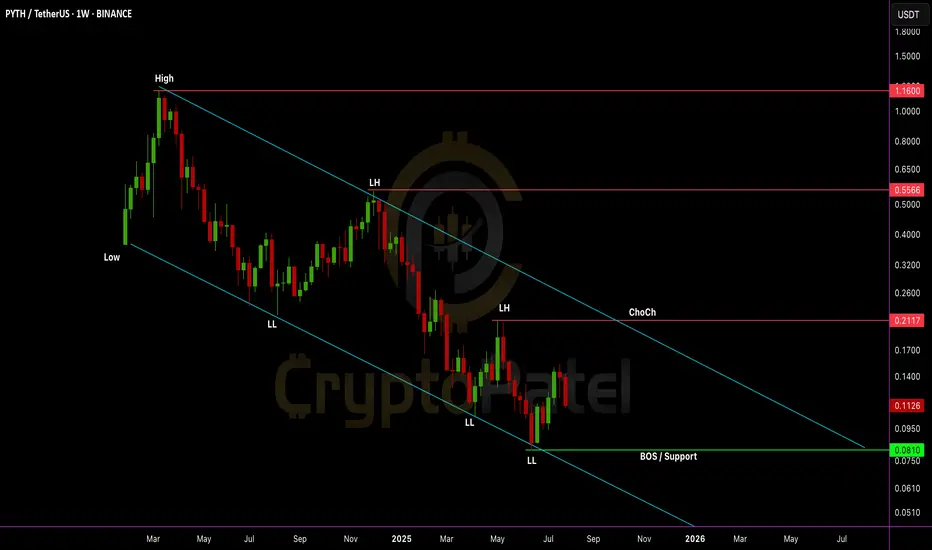
Will $PYTH go to $1 or drop even lower?Will EURONEXT:PYTH go to $1 or drop even lower?
Chart is still bearish with LL + LH structure.
But $0.0810 is a key level. If it holds, a trend reversal is possible. Accumulation zone: $0.085–$0.110
Risky entry, but R:R is huge. Hold = 10x potential to $1+
Break below $0.0810 = new LL incoming.
NFA & DYOR