$BTC Technical Breakdown – As Predicted!CRYPTOCAP:BTC Technical Breakdown – As Predicted!
I already warned you at $110K to exit or short — and guess what?
We’re now up with 8% profit from that exact call!
#Bitcoin broke structure with a Bearish Divergence, and the trendline is looking weak.
If this war doesn’t stop, I expect further downside below $100K.
Key levels to watch:
🔻 Support 1: $73,500
🔻 Support 2: $48,700
If $100K breaks, don’t be surprised to see $90K → $80K → even $70K.
Don’t say I didn’t alert you.
I clearly told you to short or exit at the top.
Booked profits? Let me know below 👇
BTC

BTC goes wild. But there’s worse. With PipGuard.“BTC goes wild. But there’s worse. With PipGuard.”
Hola, hi my friends! How are you doing? Hope you're doing amaziiiing!
Today we’re having a little chat about Bitcoin, shall we?
I admit it: this time I messed up and took the USDT spot chart instead of USD… but heeey, I’m lazy and it doesn’t really matter. What counts is the trend, RIIIGHT?
But first… boost me and drop a comment <3
📈 The trend is your friend... until it messes with you
🔼 If it goes up, it goes up
BTC is still in a strong bullish trend long term.
Nothing new? Maybe, but if it keeps going… it’s aiming for new highs. Simple.
And if not today, then tomorrow. Your loss if you miss it.
🧠 Always keep one eye on assumptions and the other on objectivity. The market will thank you.
🔽 If it drops... better be ready
And if it decides to go down?
Here come the targets: 102k , 100k , and that delicious 94k I’d love to see.
Why? Because even crypto needs a break.
And each level is potentially a reversal point , you know that already, right?
🧱 Supports, resistances... and your debts
• Resistance: 109k (rounded like those 100€ you still owe me haha)
• Serious support: 78k
• Cuddly support: 88k
• The rest is noise.
• Trend still strong, yes. But if you’re not watching… someone else will watch your wallet.
🔥 The market today? On fire, as always
• BTC did its usual trick: touched 106k , then dropped below 103k
• Liquidations? BOOM 💣: over 450 million dollars in longs
• The market shook like a noob on their first short
🌍 War, hacks, and chaos: BTC loves it
• Israelis flying around Iran bombing targets
• Iranians firing back missiles
• Israeli hackers broke into Nobitex and BURNED 90M in crypto
• The White House is silent, but the US has a “Bitcoin Reserve”
• Result? BTC pumps, dumps, pumps again… you tell me
🐍 Juicy GOSSIP
• In New York, two crypto bros kidnapped an Italian guy from Rivoli and tortured him for 17 days to get his wallet password
• Electroshock. Power saw. “Wild” sessions with madams & friends
• All this between parties, bondage, and wheelchairs
• The guy, alive by miracle, is now the new symbol of “ never give your key to anyone ”
📊 Technical Recap
🧱 Resistance: 109k
🪨 Supports: 88k / 78k
💣 Liquidations: +450M long
📉 Price Range: 106k ➝ below 103k
🌍 Geopolitics: Real bombs & BTC
😈 Gossip: Crypto-bros under pressure 😱
😂 The curtain drops…
My fingers hurt. And not just from typing… oops, I said it? I did.
If you had fun, boost and comment .
If not… next time I’ll give you support at 69k, that’ll teach you.
A hug from your loyal lunatic, PipGuard 🤣🧨
Compression Before Expansion: Market Awaits Its Next MoveBTCUSD – Compression Before Expansion: Market Awaits Its Next Move
Bitcoin is trading within a compressed structure after rejecting key resistance and retesting support. While the overall sentiment remains cautious, the technical setup is beginning to show signs of strength — if buyers can reclaim control.
🧭 Macro Check-In: Calm Before the Crypto Storm?
No rate cut from the Fed yet, but markets are starting to price in the possibility of a pause in Q3 or Q4.
ETF inflows slowing, but institutional positions are not closing — suggesting long-term conviction remains.
Political momentum in the US is shifting towards crypto adoption, with Bitcoin emerging as a talking point in election debates.
Dollar index (DXY) continues to chop, giving crypto room to breathe if inflation data remains mild.
In short: liquidity is building, but the trigger hasn’t fired — yet.
📊 Chart Structure (H1–H4): Levels That Matter
BTC is holding just above 103,100, a key level where previous demand stepped in.
The mid-range resistance lies at 104,184 — this needs to break for bulls to gain short-term control.
Above that, eyes are on 106,047, then 107,586 (top of the descending channel).
EMA alignment is still bearish → wait for structure shift, not FOMO.
📌 Trade Map
🔵 Buy Setup
Zone: 103,100 – 103,300
Condition: Bullish reaction + rejection wick / engulfing
SL: 102,600
TP: 104,184 → 106,047 → 107,586
🔴 Sell Setup (Only if trap triggers)
Zone: 107,500 – 107,800
Condition: Rejection + volume fade
SL: 108,200
TP: 106,000 → 104,500
🧠 Trader Insight
“When the chart compresses, smart money positions early.”
Bitcoin is not trending — it's accumulating or distributing. Retail is waiting for breakout. Smart traders are preparing for both scenarios.
Watch the reaction, not the prediction.
Stay objective. Let levels lead the logic.

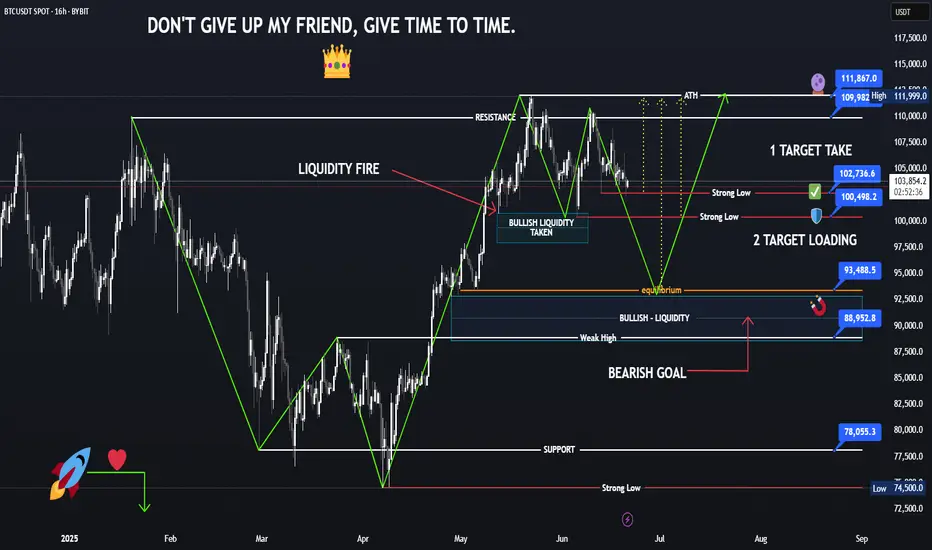
BTCUSDT – Holding Support, Bullish Signs EmergingBitcoin remains within a descending channel but continues to defend the strong support area around 101,296 USDT — a level that previously triggered a sharp rebound. On the H4 timeframe, price is consolidating sideways, forming an accumulation range. If this support holds, a bounce toward the 105,356 USDT zone is likely.
As of June 19, Binance holds 41% of global BTC trading market share, providing deep liquidity and tight spreads. This market condition favors a potential short-term recovery in BTC.
A breakout above the key resistance zone at 105,000–106,000 USDT could open the door for a broader upside continuation.

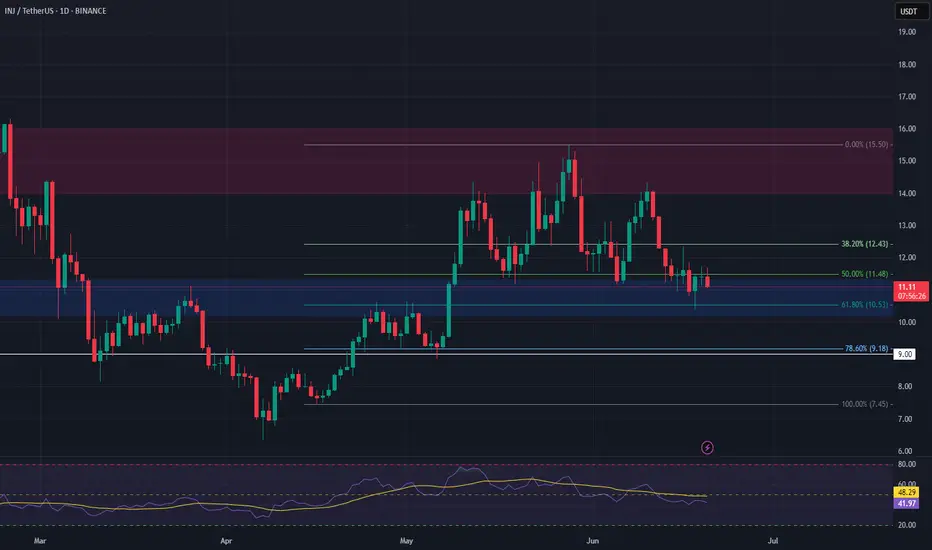
INJ Long Swing Setup – Approaching Fibonacci & Major SupportInjective (INJ) is nearing a key support zone that aligns with the 61.8% Fibonacci retracement level. This confluence area around $10.20–$11.30 offers a strong setup for a potential long swing trade.
📌 Trade Setup:
• Entry Zone: $10.20 – $11.30
• Take Profit Targets:
o 🥇 $14.00 – $16.00
o 🥈 $20.00 – $23.00
• Stop Loss: Daily close below $9.00
Will Bitcoin Hit $80k Before $171,000 ?Bitcoin is Forming a Inverse Head & Shoulders on the 2D chart...
And if this plays out — we could be looking at a move to $171,000
Here’s what you need to know:
Structure Breakdown:
▪️ Left Shoulder: Completed
▪️ Head: Completed
▪️ Right Shoulder: (in progress)
Neckline: ~$112.5K-$115k
Breakout above neckline = $171K target
That’s a +49% upside move from here.
But here’s the catch...
When too many spot the same pattern — whales love to trap.
Fakeouts, stop hunts, liquidations — you’ve seen it before.
❌ If BTC drops below $100K (Right Shoulder base), this setup flips bearish fast.
Key Support Zones:
▪️ $93,940 (Fib 0.382)
▪️ $80,780 (Fib 0.786)
Trade with confirmation, not emotion.
Respect your invalidation levels and protect capital.
What’s your play if we tap $112K? 👇
NFA & DYOR

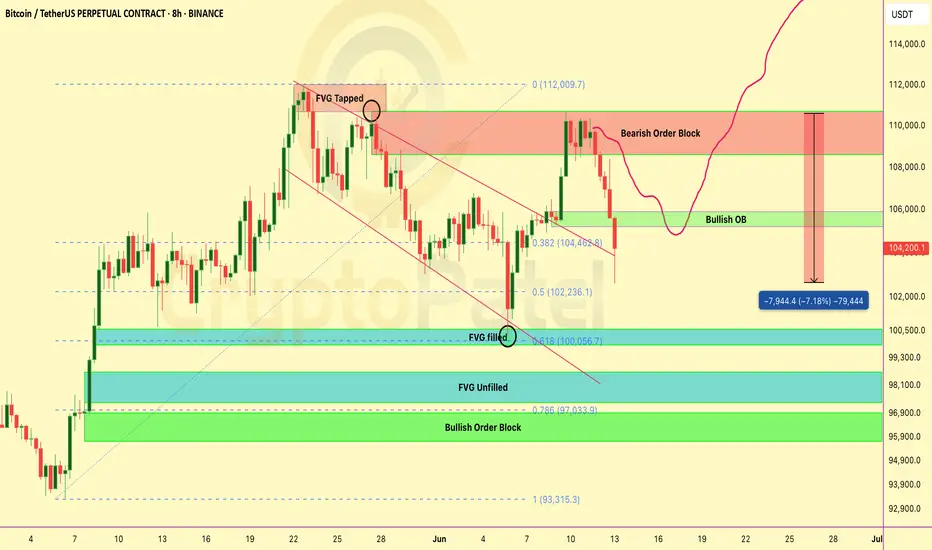
BTC Traders: Crucial Levels Incoming 🚨 BTC Traders: Crucial Levels Incoming 👇
Bitcoin is hovering around $105,399 — and things are heating up.
$106K = Resistance.
A clean break could send us to the Bearish Order Block ($108K–$108.95K).
But here’s the danger zone:
🟥 OB = Last drop's origin.
Rejection here = major sell-off risk.
🔻 $102K = Liquidity pool.
Lose this level, and sub-$100K is on the table.
Current Bias:
– Hold below OB = Bearish
– Reclaim OB = Relief bounce
– Drop below $102K = Trend Accelerates Down
What’s your game plan here?
💬 Comment your next move
🔁 Retweet if useful
🔖 Bookmark for later

Bitcoin Ready to Blast or Waiting under $100k?BTC is currently trading near $105,399, showing a corrective bounce after a recent sell-off.
Resistance Ahead – $106k:
Price is approaching a key resistance level. A break above could lead to a short-term move toward the Bearish Order Block at $108000–$108950.
🟥 Bearish Order Block (OB):
This is the supply zone that initiated the previous drop. If price fails to break and hold above this OB, we could see renewed selling pressure and continuation of the downtrend.
🔻 Liquidity Pool – $102k:
This level holds resting sell-side liquidity. A failure to hold this area may trigger a sweep — and if $102K breaks, it could unlock deeper downside potential, possibly sending BTC below $100K.
Summary Outlook:
▪️ Rejection from OB = strong bearish continuation
▪️ Break of $106K = short-term bullish move toward OB
▪️ Break of $102K = high probability of sub-$100K levels
▪️ Overall bias remains bearish unless price reclaims and holds above the OB zone with strength.
NFA & DYOR
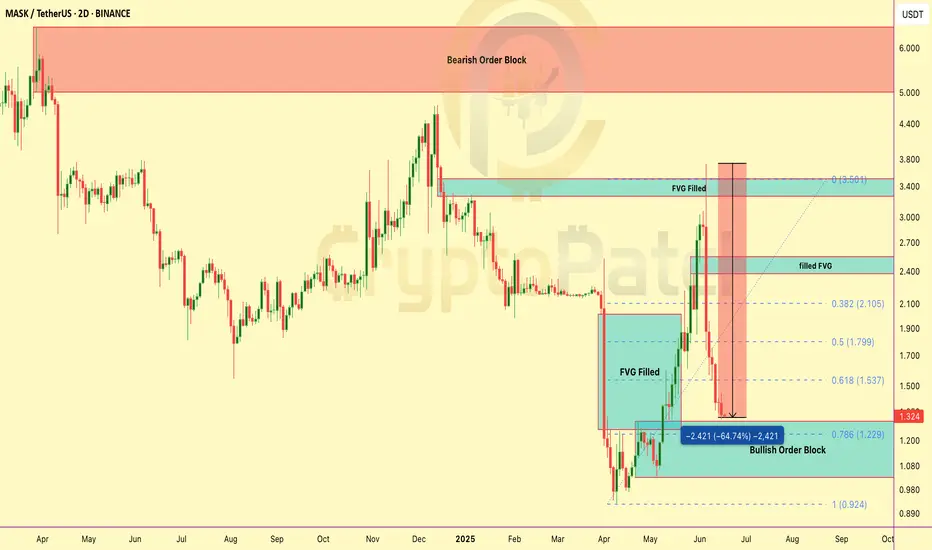
$MASK dropped 65% in 12 days — but I’m still buying, here’s why?NASDAQ:MASK Crashed 65% — I Sold at the Top, Buying at the Bottom, and Aiming for 10x
The NASDAQ:MASK token has crashed -65% in just 12 days — that’s a massive drop, and honestly, no one saw it coming. Even I didn’t expect this much of a dump.
But remember — no one can predict the market 100%.
✅ I did post a chart earlier to short NASDAQ:MASK around $3.50, and that call hit perfectly. If you took that short, it was a high-profit setup.
Now here's the important part
I mentioned earlier — if price drops below $1.50, that’s a good entry point for long-term spot buyers (NOT for leverage).
Personally, I’ve started accumulating from $1.30, and if we see a deeper dip, I’ll be buying more for the long run.
My long-term target for NASDAQ:MASK is $10+.
NFA — always DYOR
TRX Long Swing Setup – Waiting for Pullback After Bullish RallyTRX has seen a strong rally over the past few days, and we’re now watching for a retracement into support. The $0.260–$0.262 zone offers a potential long spot entry as price cools off.
📌 Trade Setup:
• Entry Zone: $0.260 – $0.262
• Take Profit Targets:
o 🥇 $0.278
o 🥈 $0.292
• Stop Loss: Daily close below $0.249

HYPE Long Swing Setup – Approaching Key Support ZoneHYPE is under pressure but now nearing a major support level, presenting a potential opportunity for a bounce. We’re eyeing the $39.00–$40.00 zone for a long entry as buyers may step in at this key area.
📌 Trade Setup:
• Entry Zone: $39.00 – $40.00
• Take Profit Targets:
o 🥇 $42.18
o 🥈 $43.90
• Stop Loss: Daily close below $38.31

BTCUSDT – Selling Pressure is IncreasingThe price is retesting a strong resistance zone around 110,464 USDT, where heavy selling pressure previously emerged.
The likely scenario is that the price forms a Lower High pattern and then breaks the uptrend line → confirming a bearish trend.
Potential support area: 101,236 USDT, where price previously reacted.
Strategy:
Priority is to wait for sell opportunities around the 110,000–110,500 zone if a clear reversal signal appears.
Target at 101,200 USDT. Stop-loss placed above the resistance zone at 111,700 USDT.
News Supporting the Bearish Outlook:
The SEC has delayed approval of the spot Ethereum ETF, triggering negative sentiment in the crypto market.
Capital is flowing out of the market due to expectations that the Fed will maintain high interest rates for a longer period.

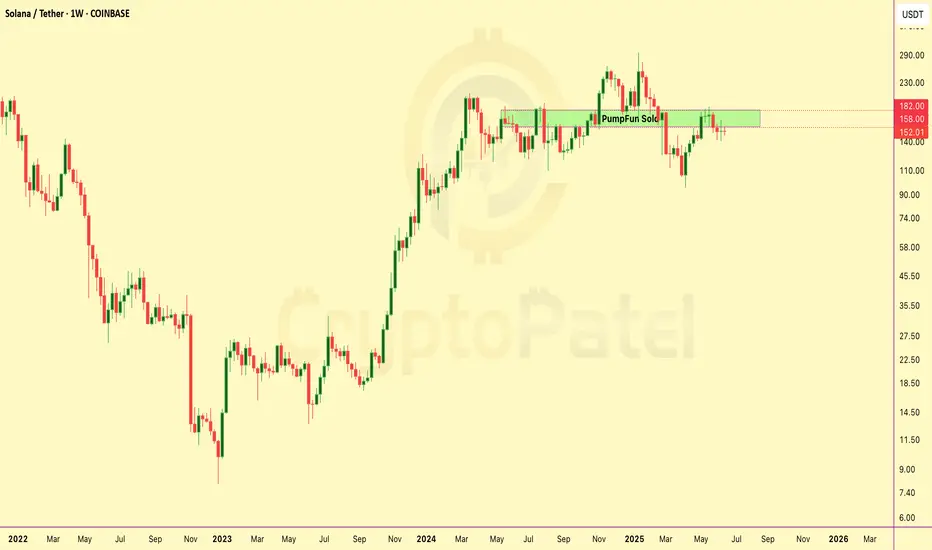
Pump.fun Sells $741M in SOL After X Suspension – What’s Really?Pump.fun Sells $741M in SOL After X Suspension – What’s Really Happening?
PumpFun (@pumpdotfun), a popular Solana-based meme token launch platform, was recently suspended from X — but they’ve been making major moves behind the scenes.
Since May 19, 2024, the platform has sold around 4.1 million SOL, worth nearly $741 million, at an average price of $180.
Here’s the full breakdown:
🔹 264,373 SOL sold for $41.64 million USDC at $158
🔹 3.84 million SOL, worth $699 million, sent to Kraken at $182
Why is Pump.fun selling so much?
Is this an exit strategy, or are they just managing risk?
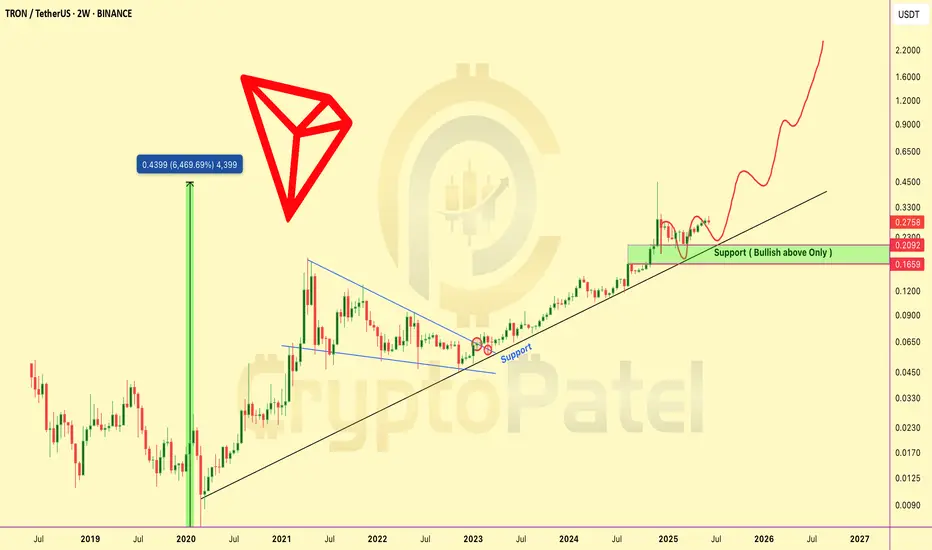
TRX NEXT EXPLOSION INCOMING? TRX NEXT EXPLOSION INCOMING?
TRX is showing a strong bullish setup after breaking out of a long-term consolidation pattern.
🔹 Price has cleanly broken out of a multi-year descending structure
🔹 Retested the key support zone around $0.21–$0.23
🔹 Still respecting the long-term ascending trendline from 2020
🔹 Historical move: 6,469% rally in the previous cycle — current structure suggests similar potential
Key Technical Levels to Watch:
🟩 Support Zone: $0.209–$0.230
🟩 As long as TRX holds above this level, bias remains bullish
🟩 This is a breakout + retest scenario.
🟩 Potential Upside Targets: $0.65 → $1.20 → $2.20+
The chart structure is indicating the possibility of a strong uptrend continuation, with bullish momentum building on higher timeframes.
TRX is technically strong and could be gearing up for a major leg higher if key support holds.
Add it to your watchlist. NFA & DYOR
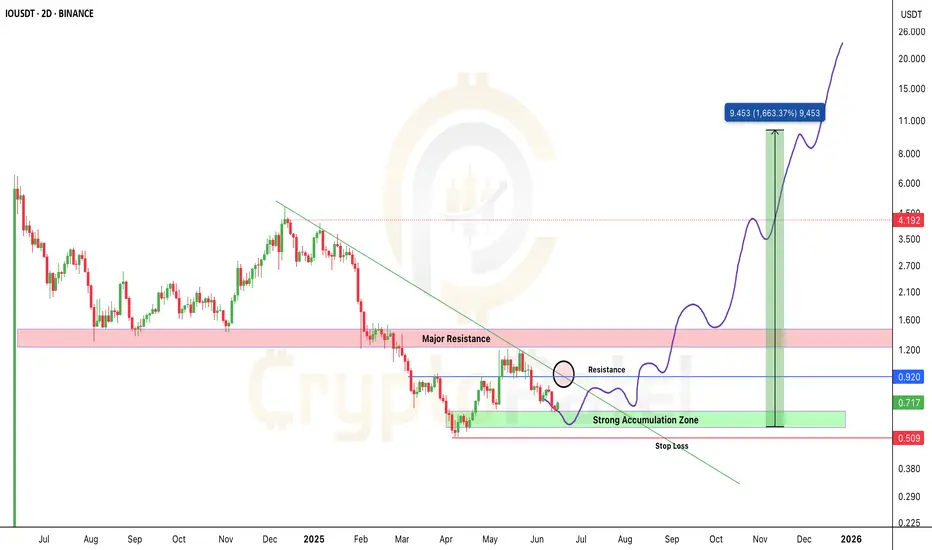
$IO Could Be the Next 100x AI Coin?SEED_ALEXDRAYM_SHORTINTEREST2:IO Could Be the Next 100x AI Coin — Don’t Miss This Supercloud Revolution
SEED_ALEXDRAYM_SHORTINTEREST2:IO is showing early signs of strength after bouncing from the key accumulation zone ($0.51–$0.73).
Structure still bullish.
A breakout above $0.92 = confirmation for next leg up.
If volume kicks in, SEED_ALEXDRAYM_SHORTINTEREST2:IO has macro breakout potential.
▶️ Entry Zone: $0.51–$0.73
▶️ Breakout Trigger: $0.92
▶️ Resistance Zone: $1.20–$1.60
▶️ Target: $5/$9/$15/$20
▶️ ROI Potential: 10x / 20x
❌ Invalidation: Break below $0.50
🔥 Long-term holders and breakout traders — don’t miss this.
io.net is turning idle GPUs into a supercloud to power AI, ML & big data — without relying on AWS or GCP.
✅ 90% cheaper than trad cloud
✅ 16,000+ GPUs live
✅ Built on Solana
✅ Backed by Multicoin, Delphi, Solana Ventures
🔰 Token Utility: Pay for compute | Staking rewards | Governance rights
This is DePIN + AI — a powerful combo. If adoption scales, SEED_ALEXDRAYM_SHORTINTEREST2:IO could be massive.
📢 If this analysis helped you, please RT & drop your thoughts in comments 👇
Let’s spread the alpha.
NFa & DYOR
ZKJ COIN DUMPING HARD — What’s REALLY Going On?ZKJ COIN DUMPING HARD — What’s REALLY Going On?
The price of Polyhedra Network’s $ZKJ has dropped sharply — falling over -87% in just a few days. But what’s really causing this?
A big reason is the token unlock on May 19 — over 15.5 million ZKJ tokens (worth around $30 million) were released into the market. That’s a lot of new supply, and many holders started selling.
At the same time, trading volume fell by 40%+, meaning fewer buyers and more pressure on price.
In total, ZKJ is down about 95% from its all-time high — and panic selling made things worse.
But here’s something most people are missing:
The project itself is still strong.
They have partners like Google Cloud, Revolut, Bima
zkPyTorch is live
📅 Heads up: Another big unlock is coming on June 19, so stay alert!

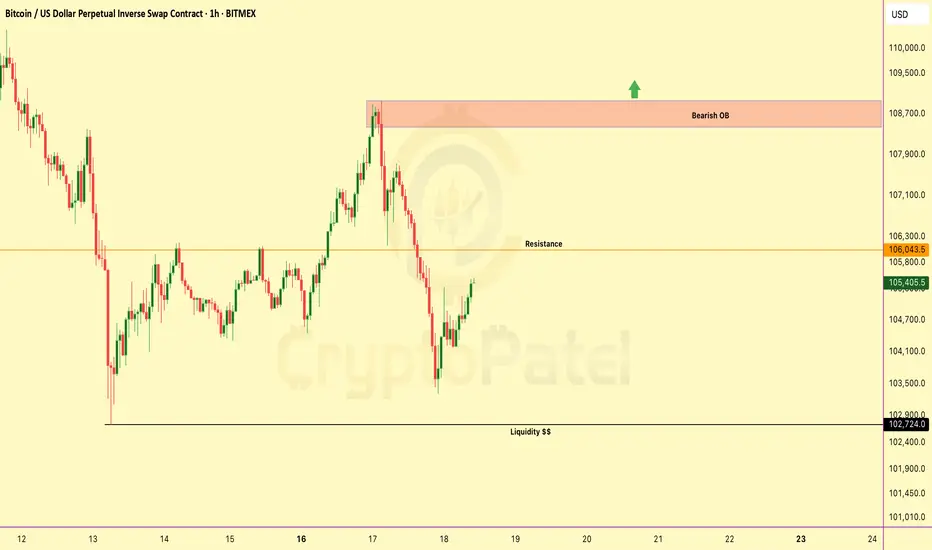
BTC Decision Point – Are You Watching This?BTC Decision Point – Are You Watching This?
Bitcoin is reclaiming momentum after sweeping liquidity at $102.7K. It's now pushing toward major resistance at $106.1K.
But the real battle? The bearish OB at $107.2K–$108.9K — where price nuked last time.
✅ Break above = clear skies toward new ATHs
❌ Rejection = another trip to $102K or even Under $100K
🔁 Retweet if this helped
💬 Drop your bias below: Long or short?👇

BTC Near $100K – Breakdown or Bounce?BTC Near $100K – Breakdown or Bounce?
BTCUSD – Will Bitcoin Hold ₹100K Support Equivalent? Signs of Weakness Amid Global Caution
🧭 Global Market Context
Bitcoin is facing some serious resistance after failing to hold above the $108K zone. And just as Indian markets react to global cues, BTC is showing signs of stress too.
🔺 US bond yields are climbing again – bad news for crypto risk appetite
🧊 Spot Bitcoin ETFs continue to attract inflows, but not strong enough to push new highs
💵 The US Dollar (DXY) is gaining strength again as investors flee risk — and that puts pressure on Bitcoin
Add to that the recent institutional sell-off, and it’s clear: BTC may need to “cool off” before another rally.
📉 Technical Picture (1H)
Bitcoin is showing a classic lower-high, lower-low pattern. A clear downtrend is in motion:
Price is below all key EMAs (34/89/200), with every rally being sold off
Important resistance sits at 106,000 – 107,000
Major support levels are now at 102,821, then 101,539, and if pressure continues — 100,419 (₹83+ lakh level for reference)
Momentum indicators like RSI are flat. No strength yet. And without a solid bullish candle from support, buyers may stay away.
🔎 Strategy Plan for Indian Traders
🔻 Short-term SELL Setup
Entry: 106,000 – 107,000
SL: 107,500
Targets: 102,821 → 101,539 → 100,419
🧠 Ideal for short-term traders looking to follow the trend
🔹 Medium-term BUY Setup (only if price reacts from 100K zone)
Entry: 100,500 – 100,800
SL: 99,800
Targets: 102,800 → 104,400 → 106,000
⚠️ Wait for bullish confirmation — avoid bottom fishing blindly
📌 Final Thought
Bitcoin is in a danger zone right now. If it loses grip on $100K support, we may see panic selling from leveraged traders. But this zone also holds opportunity — a strong bounce could spark a fresh rally.
🧘 Trade with patience. Don't chase. Let the market come to you.

BTCUSDT – Rebound from 104,200, recovery opportunity emergingBTCUSDT has bounced back from the 104,200 support zone with a potential double bottom pattern, signaling the return of buying pressure. The price is consolidating around the 106,000–107,000 area. If this zone holds, the probability of retesting the previous high at 110,500 is high.
The EMA34 and EMA89 are narrowing – a sign of weakening selling pressure.
Supporting news:
The Fed kept interest rates unchanged, U.S. CPI slightly declined, and capital inflows from ETFs like BlackRock are returning to the market, creating momentum for recovery.

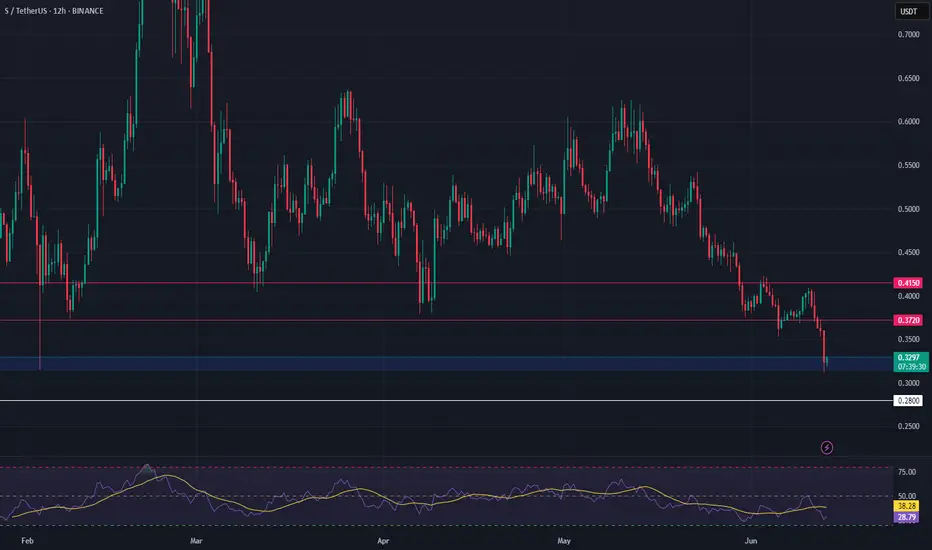
S Long Swing Setup – Retest of February Lows at Key SupportS is pulling back and now approaching a critical support zone, testing the February 2025 lows near $0.31. This area marks a key level for potential accumulation, offering a favorable long setup.
📌 Trade Setup:
• Entry Zone: $0.315 – $0.330
• Take Profit Targets:
o 🥇 $0.372
o 🥈 $0.415
• Stop Loss: Daily close below $0.280
$ETH BLOODBATH: -15% Dump! Next Stop $2100? CRYPTOCAP:ETH BLOODBATH: -15% Dump! Next Stop $2100?
I shorted right from $2862 — nailed the move.
Now trading below critical $2550 support.
👉 Hold $2550? Reversal towards $3000-$4000 possible.
👉 Lose it? We likely fill $2100-$2200 FVG — 0.618 fib at $2116.
$2860 remains THE level to watch for a New ATH.
💬 Comment your ETH target!
🔁 Retweet if this helps your gameplan.

BITCOIN ANALYSIS UPDATE — READ THIS CAREFULLY!🚨 BITCOIN ANALYSIS UPDATE — READ THIS CAREFULLY! 🚨
Hope you followed our last BTC analysis — and DID NOT open any longs at the top.
If you followed: Congrats — you either made big profits on the short, or at least saved your money by not longing.
✅ We clearly warned when BTC was around $110K — more correction was coming.
Result? Bitcoin is now 7% DOWN since that call.
❗ Now the situation is DANGEROUS:
👉 BTC broke my Bullish Order Flow at $105K.
👉 If this $105K support doesn’t hold soon → we may see a deep correction towards $90K.
$105K is the level to watch like a hawk.
👉 Iran-Israel news just accelerated the fall — but we already predicted this move before the news.
🚫 NEVER gamble with your hard-earned money.
✅ Always wait for solid confirmation before entering trades.
👉 Stay smart. Stay safe. Stay patient.
💬 Comment your thoughts below.
🔁 Forward this to your crypto friends — they NEED to see this!
BITCOIN ANALYSIS UPDATE — READ THIS CAREFULLY! BITCOIN ANALYSIS UPDATE — READ THIS CAREFULLY!
Hope you followed our last BTC analysis — and DID NOT open any longs at the top.
If you followed: Congrats — you either made big profits on the short, or at least saved your money by not longing.
We clearly warned when BTC was around $110K — more correction was coming.
Result? Bitcoin is now 7% DOWN since that call.
Now the situation is DANGEROUS:
👉 BTC broke my Bullish Order Flow at $105K.
👉 If this $105K support doesn’t hold soon → we may see a deep correction towards $90K.
$105K is the level to watch like a hawk.
Iran-Israel news just accelerated the fall — but we already predicted this move before the news.
🚫 NEVER gamble with your hard-earned money.
✅ Always wait for solid confirmation before entering trades.
Stay smart. Stay safe. Stay patient.
Comment your thoughts below.
Forward this to your crypto friends — they NEED to see this!
