BTCUSDT Set to Explode: Strong Uptrend Ahead!Hello everyone, today we’ll analyze an exciting opportunity with BTCUSDT, evaluating its strong uptrend and the potential to reach new highs.
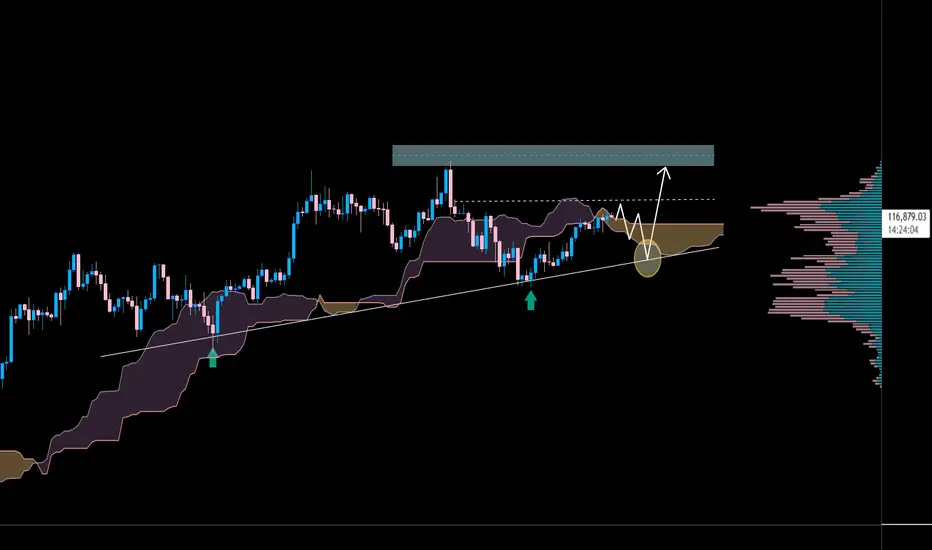
BTCUSDT is trading on a strong upward trendline , with support levels at 110,500 and a high target of 123,700. The chart shows a breakout from an important resistance zone, with the price also positioned above the Ichimoku cloud , reinforcing the bullish trend.
Capital inflows into Bitcoin ETFs and the Fed’s decision to cut interest rates have created a favorable environment for Bitcoin , making the possibility of reaching new highs even stronger.
With favorable technical signals and macroeconomic factors , BTCUSDT is likely to continue its strong upward movement. However, always check support levels to manage risk effectively.
Wishing you successful trading!
BTC
Bitcoin Market Report – Liquidity Grabs Before Next ExpansionThe market is showing clear signs of engineered volatility, with strong impulsive moves followed by rapid retracements. This behavior reflects liquidity targeting, where price sweeps both sides before resuming its broader path.
Current conditions suggest Bitcoin is in a redistribution stage, with momentum alternating to trap short-term participants. The repeated liquidity grabs signal that larger players are accumulating positions while clearing out weaker hands.
The overall structure points to continued testing of lower liquidity pools before any major directional expansion. Once this phase is complete, the market is likely to enter a more decisive trend, supported by the buildup of institutional flow and reduced volatility pockets.
In short, Bitcoin is cycling through liquidity collection and preparation, positioning itself for a larger move as market balance shifts.

Btc 1H long ideaHere's a detailed description of the information presented:
• Financial Instrument: The chart is for Bitcoin (BTC) priced against USDT (Tether), a stablecoin. The "Perp Perpetual Mix Contract" suggests this is a futures or derivatives contract that doesn't expire.
• Timeframe: The chart is set to 1-hour (1H), meaning each candlestick represents one hour of price movement.
• Trading Position: A long position is currently open, indicated by the green and red boxes. A long position is a bet that the price will increase.
• Entry Point: The white horizontal line marks the entry price at 116,980.2.
• Take-Profit Target: The top of the green box, labeled "Target," is at 119,810.0. The potential profit for reaching this target is 3,517.2 USDT, which is a 3.02% gain.
• Stop-Loss: The bottom of the red box, labeled "Stop," is at 114,658.0. This is the price level where the trade will automatically close to limit losses. The potential loss is 1,646.4 USDT, or a 1.42% drop.
• Risk/Reward Ratio: The text "Risk/Reward Ratio: 2.14" indicates that the potential profit is 2.14 times greater than the potential loss. This is a key metric used by traders to evaluate if a trade is worth the risk.
• Price and Indicators:
• The current price is shown as 117,210.1.
• The chart includes various indicators and tools, such as moving averages (the blue and yellow lines moving with the price) and a volume histogram at the bottom (red and green bars).
• There are also horizontal white lines that likely represent significant support and resistance levels.
In summary, the image provides a clear visualization of a planned crypto trade, outlining the specific entry, stop-loss, and take-profit levels, as well as the associated risk/reward profile.

BTC Price Action: Bulls vs BearsBTC Price Action: Bulls vs Bears
Bitcoin has shown a gradual recovery after a prolonged corrective phase, with market structure leaning toward a constructive buildup. Fundamentally, sentiment is influenced by global macro conditions—investors are watching U.S. monetary policy signals, while stable demand from institutions and long-term holders continues to provide a supportive backdrop. On-chain activity remains steady, with balanced exchange inflows and outflows suggesting no extreme directional pressure in the near term.
From a technical perspective, the market has shifted momentum from bearish flows into a developing bullish sequence. The recent break of structure on the 4H timeframe highlights strengthening upside intent, though price is still moving within a broader accumulation phase. Current flows suggest the possibility of a short-term dip for liquidity before continuation to higher levels, aligning with the overall constructive weekly outlook.

BTC LONG AND HAVING SUPPORT OVER THE CHANNEL Chart Overview
• Pair/Timeframe: BTC/USDT – 4H
• Exchange: Bitget
• Pattern: Breakout from a falling wedge / descending channel, shifting momentum bullish.
• Indicators:
• EMA 9 (yellow) and EMA 20 (blue) are crossing bullishly.
• Volume spike supports the breakout.
⸻
Price Action
• BTC broke out of the descending trendline (blue) and retested support before moving higher.
• Currently trading at 110,780 USDT (+1.46%).
• Strong bullish momentum is visible with higher lows forming since Aug 31.
⸻
Trade Setup
• Entry: Around breakout zone (near 110,000 – 110,500).
• Stop Loss (SL): Below 108,500 zone (highlighted red zone).
• Targets:
• TP1: 114,658 USDT
• TP2: 115,980 USDT
⸻
Key Levels
• Immediate Support: 109,383 – 108,534
• Major Support Zone: 107,200 – 107,386
• Immediate Resistance: 111,998 – 113,217
• Target Resistance: 114,658 (TP1) and 115,980 (TP2)
• High Reference: 117,340 – 117,345
⸻
✅ Summary: BTC has broken out of a falling wedge on the 4H chart with strong bullish confirmation. If price sustains above 110k, it could move toward 114.6k (TP1) and 116k (TP2). Losing 108.5k support would invalidate this bullish setup.

Btc long 1H TimeframeKey Observations:
1. Chart Type & Indicators:
• Timeframe: 1 Hour (1H)
• Indicators: EMA 9 (yellow), EMA 20 (blue) for short-term trend tracking.
2. Price Action:
• Current Price: 109,260 USDT
• Recently bounced sharply after a strong dip, showing bullish recovery.
3. Pattern:
• There’s a visible ascending triangle (orange lines), which usually indicates bullish continuation if price breaks upward.
• Price has broken out of the small ascending trendline with momentum.
4. Trade Setup (Long):
• Entry Zone: Around 109,260 USDT
• Target (TP):
• First resistance near 111,998 USDT
• Next major resistance around 113,217–113,431 USDT
• Stop Loss (SL): Around 107,200–107,386 USDT
5. Volume:
• Noticeable increase in buy volume at the breakout, confirming bullish pressure.
⸻
✅ Summary:
This is a long position setup based on breakout from an ascending structure. If BTC holds above the 109,000–108,500 support zone, it has potential to test 112k–113k levels. Stop loss is placed below the recent swing low (~107.2k).

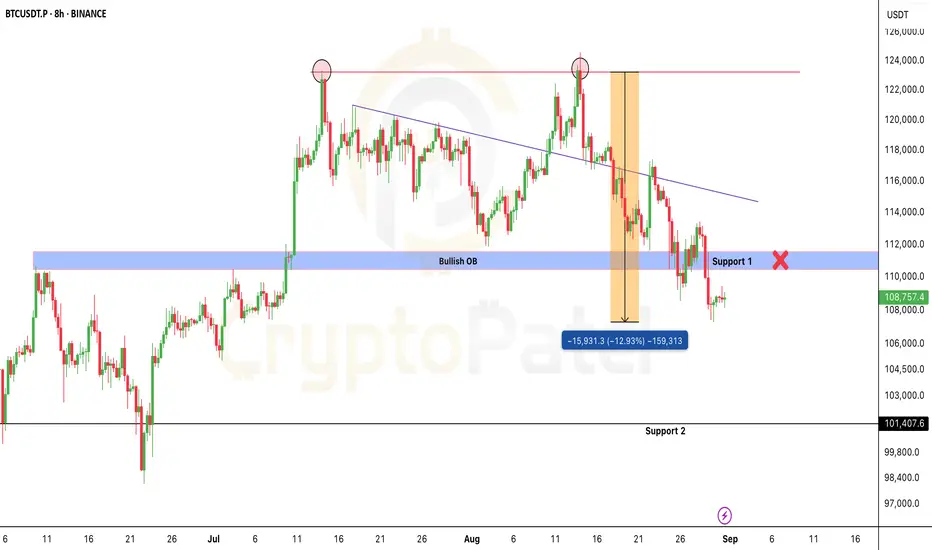
Bitcoin Chart Analysis And Bearish overview #BTC Bearish Outlook
Bitcoin stays bearish below $113,400.
No H4 close above = downtrend intact, targeting the $100K psychological level.
Break $100K support, and liquidity near $90K becomes the next magnet.
Key levels:
$113,400 → HTF resistance
$100,000 → Psychological support
$90,000 → Demand zone
Already 13% down from our short entry, hope you caught the move. 🫡
NFA & DYOR
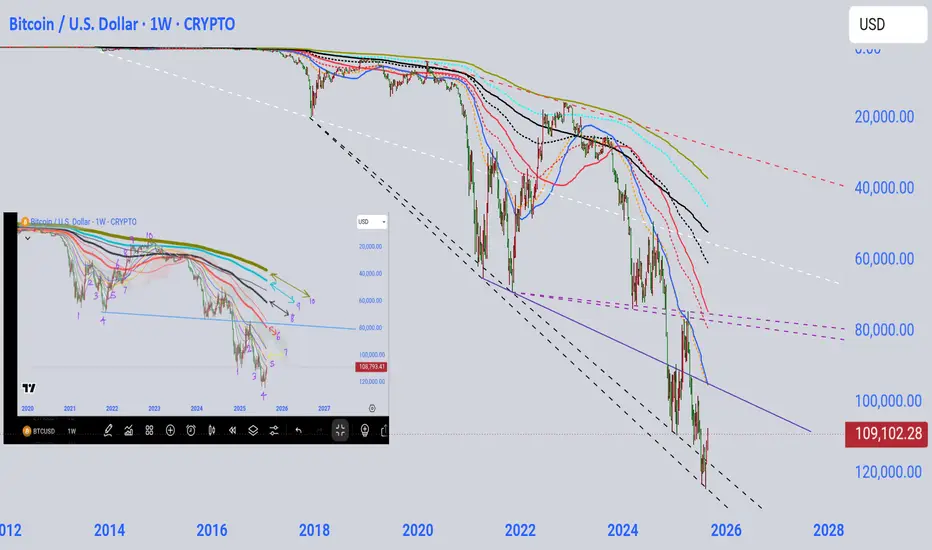
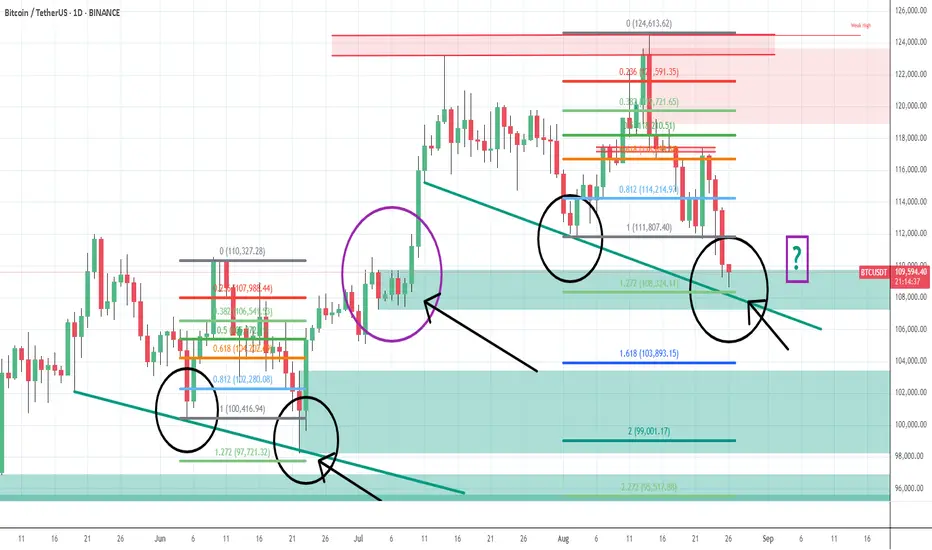
Btc heading towards 79k, cycle's bottom reversal below thatBtc's this bear moves seems started
And on approx, half of this cycle's top or ATH has to be taken into consideration for a rough calc
However 80k & 79k are psychologically confident values and btc looks like heading towards there
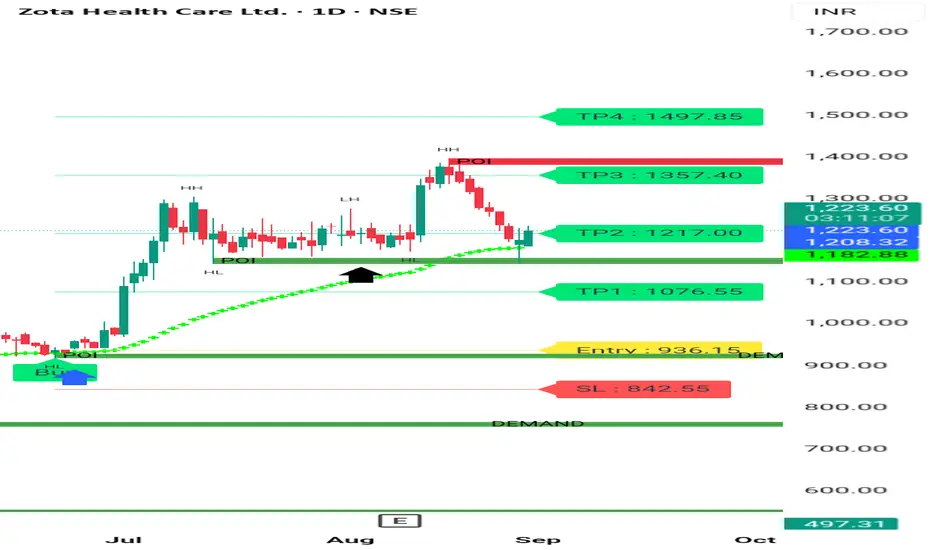
ZOTA HEALTHCARE BULLISH CHART Zota healthcare is good Growth company. It's a good buy at cmp for swing trading of 5%-6% profit. It's taking Reversal after Retracement. U can look into this. Thanks .
Consult your financial advisor before making any position in stock market.
BTC - 29th Aug - collect more qty on every dipswe have monthly expiry and max pain at the top around 117K not sure exactly as it keeps changing some times. I expect any of the mentioned support levels to hold since it went up with demand followed by good data from US and positive equity... long BTC with required enough enough margins so no one can liquidate even during sleeping... weak hands loose btc to whales during dips... collect btc qty on dips... take care, cant predict the exact support levels big players thinking .... But every big players buy every dip when good volume seen for sure
BTCUSD Long Setup – Trend Continuation Play📌 Trade Details
Entry: 113,256.5
Target: 115,317.7
Stop Loss: 111,874.4
📊 Trade Rationale
✅ Trend Continuation: Price has respected the ascending trendline multiple times, indicating strong buyer interest.
✅ Break of Structure: Recent higher highs and higher lows confirm bullish momentum.
✅ Support Flip: Zone around 113,050 acted as resistance earlier and is now being retested as support.
✅ Volume Confirmation: Rising volume supports the bullish continuation bias.
✅ Clean Risk–Reward: With SL below structure and TP near major resistance, this setup offers a favorable RRR.
🎯 Target Zone
The target aligns with the next strong supply zone at 115,300+, where sellers may re-enter.
⚠️ Risk Management
Always size positions wisely, as crypto remains highly volatile. Protect your capital first.
Disclaimer:
This idea is for educational purposes only and not financial advice. Do your own research before entering any trade.

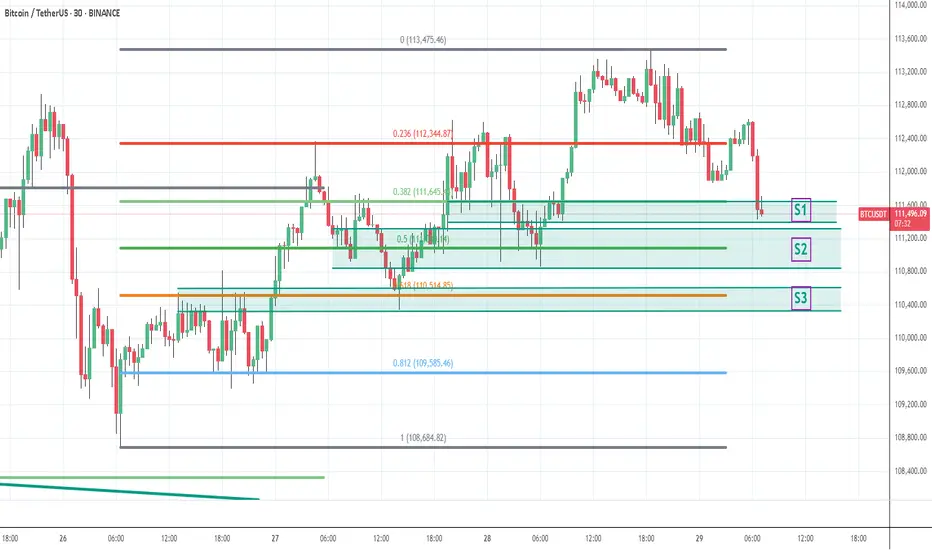
BTC - will bounce and move up only from today low - 26th AugBTC price has reached a crucial technical area from where price will most likely bounce and move up only and wont fall further much. explained in chart with fib levels and what happened in history
Buy BTC for 10K up move - Price Action confirmationLast few days multiple false news were spread in middle of correction.
Deliberate sell off by big players to trap the retailers etc etc
joined with US FOMC meetings etc only played down side which is
not technical.
I predict price tracing back to 124K asap.
Bitcoin is Digital Gold. At the same time keep long qty with liquidation level as
low as 105 or 100 or 95 K so no one can liquidate you....
Keep Booking profits and re enter at every dip.... rock it my friends

BTC Consolidating, Ready to Blast Towards 130K?BTC/USDT is still holding within its uptrend channel , with strong support around 112.3K and key resistance at 123K–125K. After hitting an all-time high near 124.5K, the price pulled back to 112–115K for consolidation, building a base for the next rally.
On the news side, the market is getting strong support as the US officially allows Bitcoin in 401(k) retirement plans and has set up a Strategic Bitcoin Reserve . At the same time, spot Bitcoin ETFs continue to attract massive inflows, pushing total assets above $150 billion in just 18 months. This shows rising institutional confidence, despite short-term corrections.
The preferred scenario now is to look for buy opportunities around 112–115K , targeting a rebound to 123–125K, and if that breaks, the next destination could be 130–135K.
On the flip side, a defensive strategy should be considered if BTC falls below 110K, as this is a crucial level for maintaining the medium-term uptrend.

Bitcoin is Bullish or Bearish - 20th Aug 2025First, In my previous charts mentioned take long with money management. I didnt expect this much of fall and i had to cut my longs to hold the rest. Technically no answer for this fall since its mad short selling and group games or big players selling to get liquidity before they buy. They are buying at every dips in very large qty. Exchanges buy sell as well to kill and eat others
Price is at previous tested proved support. Any analyst can only suggest buy this dip and to be 100% security allow price to test the support again and then buy based on reaction. Support and Resistance are tested and will hold or breakout as well right. In my view for Bitcoin every previous proved support should not break since whales buy and rise the price. Not sure who is that whales selling causing support to break. In news I didnt see or knowing how is that big player sold causing price to drop this much. Stay Safe, I am doing my best or suggesting what I am also doing. God Bless Bitcoin traders.

BTCUSDT: Holding Support, Waiting for a Breakout to 127,500Bitcoin continues to move within an uptrend structure, with the 112,200 USDT zone acting as a key support, aligning with the ascending trendline. The repeated rebounds from this level indicate that buying pressure remains steady.
On the upside, the 127,500 USDT zone stands as a strong resistance that must be broken to extend the bullish momentum. As the price approaches this area, traders should closely monitor the reaction to determine whether a breakout or a short-term pullback will occur.
Overall, the technical structure still favors the bulls. A sensible strategy is to accumulate during retracements around 112,200 – 114,000, and hold positions for a short-term target at 127,500. If this level is breached, the bullish wave will be further reinforced.

BTCUSDT: Continued Growth in the Short TermBTCUSDT is currently trading within a stable price range, with a clear uptrend channel forming. After bouncing off the strong support at 116,000 USD, BTCUSDT is likely to continue its bullish momentum, with the first target set at 123,000 USD.
The latest news from the cryptocurrency market shows a growing confidence in Bitcoin, driven by positive signals from major financial institutions. Recent price corrections have created good buying opportunities for investors. The global economic situation, particularly the weakening of the USD and increasing institutional adoption of Bitcoin, is driving BTC's value higher.
Trading Strategy:
Buy: Enter a buy position when the price approaches the 116,000 USD support level again or breaks above 117,000 USD.
Stop-loss: Set a stop-loss below the 116,000 USD support level to protect in case of a reversal.
With the current market structure and supportive factors from both news and technical analysis, the bullish trend of BTCUSDT is highly likely to continue in the near term.

BTC - 18th Aug Before US Open - Dump & Pump or Dump ?History was repeating exactly till half of 5th wave but market considered new ATH as possible profit booking and sold off instead of going in to parabolic up move. The exact place where it has to start the parabolic up move it got dumped. Either its due to CME close and few market players doing false move or its sure dump or lack of buying at these high price or ETH got importance instead of BTC. In this cycle ETH, SOL and XRP and few mother crypto pulling the liquidity and BTC missing those money. Need to wait and watch today and this week. Right now price is still at swing low from where it can move to new ATH to 127 and 130K.

ETH on the road to $10,000? Let’s break it down🔥 ETH on the road to $10,000? Let’s break it down 👇
Here’s why ETH looks stronger than ever:
1️⃣ Big Money Flowing In
🔹 ETFs & public companies bought 4.4M ETH ($20B) this quarter.
🔹 Whales & Web3 firms added another 2M ETH.
🔹 That’s more than 5% of total supply absorbed in just months.
2️⃣ Record Network Growth
🔹 DEX trading volume at new highs.
🔹 Daily transactions & active wallets breaking records.
🔹 Stablecoin supply at ATH.
👉 Demand for Ethereum’s network is exploding.
3️⃣ Massive Supply Crunch
🔹 30% staked, 8% with institutions, 25% with long-term holders.
🔹 5% permanently lost.
🔹 Only 12% left on exchanges, shrinking fast.
🔹 Inflation rate just 0.5%, even lower than Bitcoin.
With retirement funds opening ETH access, rate cuts coming, and pro-crypto regulations, the demand will only increase while supply dries up.
Short-term dips may shake out weak hands… but the bigger picture is clear: ETH is heading above $10K this cycle.
Note: NFA & DYOR

BTC - TP 130K - History repeating with more bullish trendIn my previous chart I clearly said we are going to see 3rd wave as per history pattern seems to be repeating as per ABC pattern worked exactly. In chart clearly shown 3rd wave, 4th wave and one top followed by accumulation (right now happening) after 3rd wave and before parabolic 5th wave exactly happenings. From ABC to 4th wave its exact price move repeating and I wish and expecting the 5th wave in parabolic move and reach the FIB extension shown in chart for 130K logic. since its more bullish may be TP may be higher than 130K as well. Right now price is in accumulation phase after one top followed by wave3 top.
Do not lose your 50 to 60% BTC qty in any false moves. And do not take 100% long qty as well
Maintain Money Managment strictly.
Factors Supporting Crypto - mainly BTC and ETH
1) Fiat money printing causing $ index and US dollar weak
2) Strong US data, Euro zone data and no recession in any country now
3) All trade tax with Europe and China and most of the countries are good
4) Pension money flow in crypto in US + new adoption by corporates one after another
5) New IPO focusing on BTC and nonstop ETFs fund flow as usual

BTC - 17th Aug Asia Night view - Bullish TP1 -120700Explained my view in chart text it self. Its Bullish and expecting 120700 and 121600 minimum first to see if any resistance ome or not... not point is selling now and just need to be 50 to 60% capacity long in BTC now

$BTC at make-or-break zoneCRYPTOCAP:BTC at make-or-break zone
Holding above $116K = bullish reaction likely → next leg higher Toward New ATH
Losing this support = bearish breakdown → eyes shift to $100K liquidity pool.
Market structure is clear: support defends or capitulation begins.

BTC - 17th Aug - Buy @ 117K during re test of supportBitcoin reacts and respects Fib levels and as expected seen taking support at very crucial and stronger support area around 117 K. Its a confluence of support area. 1) 10th Aug Strategy bought BTC at this area, 2) resistance line broken area converting to support. 3) FIB golden line area. Price is coming for re test of the support and expecting very good buying interest today 17th Aug. Its a must buy time in Bitcoin today. Buy with all required Money Management.
Last few days ETFs funds inflow only seen so many people are accumulating only,
