What BTC has to offer now - Swing Trade opportunityBINANCE:BTCUSDT.P
DELTAIN:BTCUSD.P
BYBIT:BTCUSDT.P
BTC played our level perfectly giving about 8.5% return in three days
Now what can be done next - LETS DISCUSS
After touching our level 94000 which was a 0.5 retracement zone BTC is down 1500 points
I am expecting bearish momentum in the upcoming days
LOGIC - To sustain the upwards trend in the long term BTC has to test its 0.6 retracement zone in 1 month tf which is around 74700 level, I could be 100% wrong but the global environment is not so good which might act as a catalyst for the downwards momentum.
Leverage recommended 5x or below (Level based on Delta Exchange Chart)
Short at Current market price = 92600
Stop loss = 97600
Target 1 = 87500 (RR 1:1)
Target 2 = 80608 (RR 1:2.4)
Target 3 = 74700 (RR 1:3.6)
RR ratio = 1:3.6
Total point to capture = 17850
Stop loss point = 5050
Disclaimer: The content is for educational purposes and should not be considered a recommendation to buy or sell any security.
Btcshortsetup

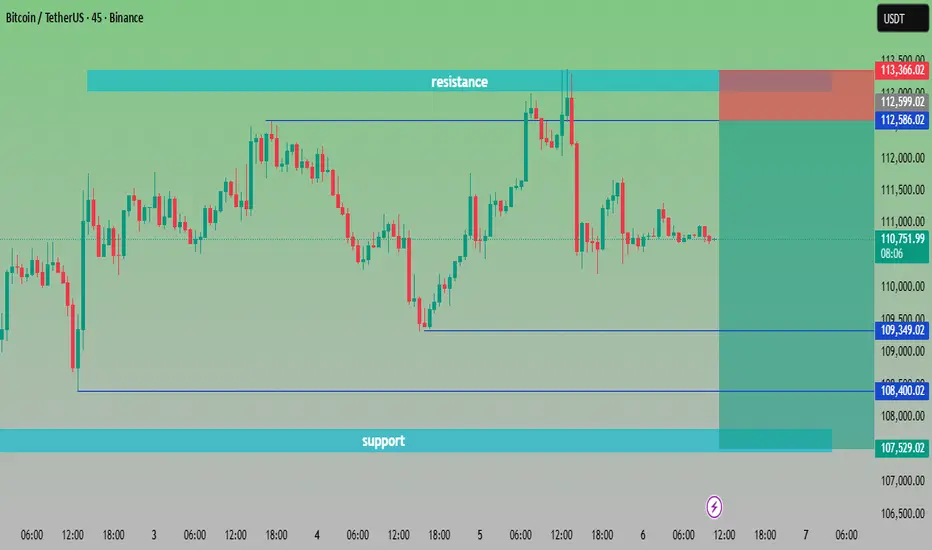
“BTC/USDT at Crossroads | Key Levels to Watch🔎 Chart Analysis – BTC/USDT (45m)
Resistance Zone: Around 112,586 – 113,200 USDT. Price has tested this area multiple times but failed to break out, confirming strong selling pressure.
Support Zone: Around 107,529 – 108,400 USDT. Buyers have consistently defended this zone, making it a key demand area.
Current Price: 110,720 USDT, sitting in the middle of support and resistance.
📌 Scenarios:
Bullish Case 🟢🚀 – If BTC breaks above 112,586 USDT, momentum could push toward 113,500+ USDT.
Bearish Case 🔴📉 – If BTC fails to hold 109,349 USDT, price may retest the deeper support around 107,500 USDT.
⚖️ Trading Plan Idea:
Long Entry: Above 112,600 breakout ✅
Short Entry: Below 109,300 breakdown ❌
Target Zones:
Upside 🎯 → 113,500+
Downside 🎯 → 107,500
BTCUSD 4 HR ANALYSIS | SHORT TRADE🚀 Bitcoin (BTC) Price Analysis - 4-Hour Timeframe 📊
Chart Overview:
Current Price: $96,935.44
Timeframe: 4-Hour chart
Date Published: December 20, 2024
Key Features:
Trend Channe l: The chart illustrates a red ascending channel that represents the previous upward trend in Bitcoin’s price.
Support and Resistance Levels:
Resistance Level : Identified at $99,612.38
Support Level : Identified at $89,438.39
Price Movement : Recently, there has been a significant price drop depicted on the chart.
Potential Drop: A green arrow indicates a potential price drop of 9.30%, equating to -$9,171.21.
Discussion Point : The chart poses the question, “Can Bitcoin drop 10% from next week (23 Dec 2024)? Comment what you think?
Analysis :
The ascending trend channel suggests that Bitcoin has been in an upward trend.
The recent price action shows a breach of this channel, hinting at a possible trend reversal.
Key support at $89,438.39 needs to be monitored, as a break below this level could confirm further downside.
The potential 9.30% drop indicates market uncertainty, potentially leading to a larger correction.
Conclusion: Monitor the key support and resistance levels closely. The breach of the ascending channel and the significant price drop could suggest a trend reversal, warranting caution for bullish positions. Stay tuned for updates as we approach the critical date of December 23, 2024.
Note - This is Only for education purpose.
Follow and give Like

Btc getting ready ?Btc getting ready ?........ btc may touch 16550 and may give a scalping shorting opportunity of 400 points towards 16k
This shorting opportunity may be valid only if it gives a rejection around 16550 and also if it closes below the trend line

SHORT BTCShorting BTC could be good at 31900-31950 with minor SL above 32550 for target of 30500 to 30300

BITCOIN again ready for $33,000All the key points, aspects, confirmations are clearly mentioned on the Chart. Kindly do your own research once before entering.
THANK YOU

BTC POSSIBLE DOWNTREND BTC is already in a strong downtrend and now is in a sideways zone. So, I analyze the next possible move using simple S/R. If there is anything else feel free to comment.
NOTE: DO YOUR OWN ANALYSIS BEFORE ANY INVESTMENT
Thank You

BTC/INR SELLThe top-down analysis of BTC/INR according to price action. Don't Put maximum reward on this short. Try 1:2 or 1:3 reward ratio.
BShort

BTCUSD Correction wave ( Short-term corrective wave)The ascending channel has already broken and created lower low.
Now it has created 0.786 retracement of AB leg. Expected extensions of AB leg is the target which is cleared in 1 / 1.27 /1/618 and 2 Fibonacci levels.
Please manage your trade with a Stop at C level.
** for Educational purpose only
