BTCUSD 4H –Demand-to-Resistance Reversal Setup (Structured Long)Market Context
BITSTAMP:BTCUSD is currently reacting from a 4H demand zone after a sharp corrective move from the recent swing high. Price has printed a clear liquidity sweep below prior lows and is now attempting a reclaim of short-term structure.
Technical Breakdown
Strong 4H Demand (D) holding near the 88.9k–89.2k region
Clear reaction + displacement from demand, suggesting active buyers
Price is attempting to reclaim the 4H resistance flip zone (R)
EMA ribbon compression followed by early expansion → momentum shift
Structure aligns with a mean reversion → continuation move
Trade Plan (Illustrative)
Entry: On confirmation above 4H resistance / demand retest hold
Invalidation: Below demand zone low
TP1: ~93.4k (first opposing structure / imbalance fill)
TP2: ~97.7k (daily resistance / premium zone)
R:R remains favorable as long as demand holds and structure is respected
Bias
Neutral → Bullish while price holds above demand
Failure to hold demand invalidates the setup and opens downside continuation
Notes
This is a structure + supply/demand based idea, not a prediction
Best confirmation comes from lower timeframe acceptance and volume expansion
News events may increase volatility—manage risk accordingly
📌 This idea is for educational purposes only. Always manage risk and wait for confirmation.
Btctrade

BTCUSD – 1H | Liquidity Run → Distribution →Mean Reversion ScenePrice delivered an impulsive expansion into premium after sweeping internal liquidity from the range lows. That move was displacement, not acceptance.
We are now stalling at a prior H1 supply / EQH zone near the range high. Structure here is weak: wicks, overlap, and loss of momentum hint at distribution rather than continuation.
Narrative
Liquidity taken above recent highs
Price taps premium supply
Expect a lower high / range failure
Smart money likely reallocating shorts
Execution Bias
Shorts favored below the blue level
Invalidation only on clean H1 acceptance above supply
Downside Targets
Range mid → internal liquidity
Range lows
External sell-side resting near deep discount zone
Until price shows acceptance above supply, this remains a sell-the-rally environment.
Expansion up was the trap. Mean reversion is the play.

BTC 1H: Rejection at Supply, Bearish Continuation RiskChart Analysis (1H BTC/USD):
Major Supply Zone (~90,000–90,200):
Price was strongly rejected from this area, confirming it as a key overhead resistance. Sellers remain active here.
Fair Value Gap (FVG) / Mid Resistance (~89,000–89,500):
The red FVG zone above current price acts as a likely pullback target, but also a strong sell zone if revisited.
Current Structure:
After the rejection, BTC broke down and is consolidating below short-term EMAs, indicating bearish momentum on the 1H timeframe.
Key Support Zones:
Near-term demand: ~86,700
Major downside target: ~84,600
Loss of the 86.7k support increases probability of a deeper move toward 84.6k.
Projected Path:
The dotted projection suggests a possible pullback into resistance (87.8k–89k) followed by continuation lower, unless price reclaims and holds above the FVG.
Bias:
Below 89k: Bearish / sell rallies
Above 90.2k: Bearish bias invalidated, trend may shift bullish

BTC out of box and retest done.. going upBitcoin long position is on the way. Btc is now out of critical box expected now to get reward same like range of box. So as marked it can go upto trendline to test it and completes the range on buying side in short term then after trendline hits we need to see for next move.

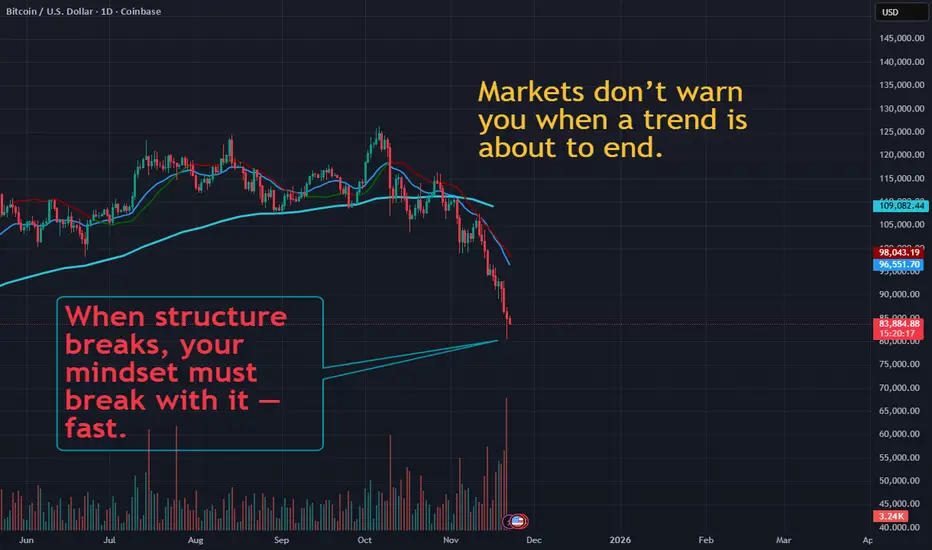
Bitcoin: Trend Breaks Fast — Mindset Breaks FasterMarkets don’t warn you when a trend is about to end.
They just stop rewarding impatience.
Bitcoin is giving a masterclass in that right now.
🔎 Technical Context
Price broke below both the 20 & 50 EMA, and momentum flipped hard.
The 200 EMA, which held beautifully during previous pullbacks, has now failed.
Structure shifted from higher highs → lower highs, and now a violent lower low.
Sellers are in control — not because of panic, but because buyers stopped defending.
Volume spike confirms capitulation behaviour, not a normal pullback.
This isn’t a dip.
This is a trend break.
🧠 Mindset Lesson
This is where traders separate into two groups:
1. The hopeful
They keep buying every dip, assuming BTC “must bounce.”
They confuse belief with evidence.
They lose money fighting momentum.
2. The disciplined
They accept trend changes without emotion.
They don’t cling to past moves.
They follow price, not predictions.
A trend break teaches the most important trading skill:
👉 Let go quickly. Re-enter slowly.
Your job isn’t to be loyal to Bitcoin.
Your job is to read what price is saying — not what you want it to say.
👉 When structure breaks, your mindset must break with it — fast.
💡 Save this. Follow for daily mindset + price-action education designed to build discipline and clarity.
BTC # Bitcoin Free fall still pending....Here as per critical box range trading btc bitcoin can free fall if it breaks below . And ot will try to sweep stoplosses of previous weekly low. As marked in chart you can notice this easily that how btc can free fall to hunt more stop losses.
So trade accordingly to see weather it only hunts stop losses and reverses or it will take a continuous fall.

Btc buying side preparing for liquidity sweep SMC ICT appliedAs per recent structure BTC has taken support at previous order block and also 200 ema, with hammer. So seems like going for liquidity sweep of sellers.

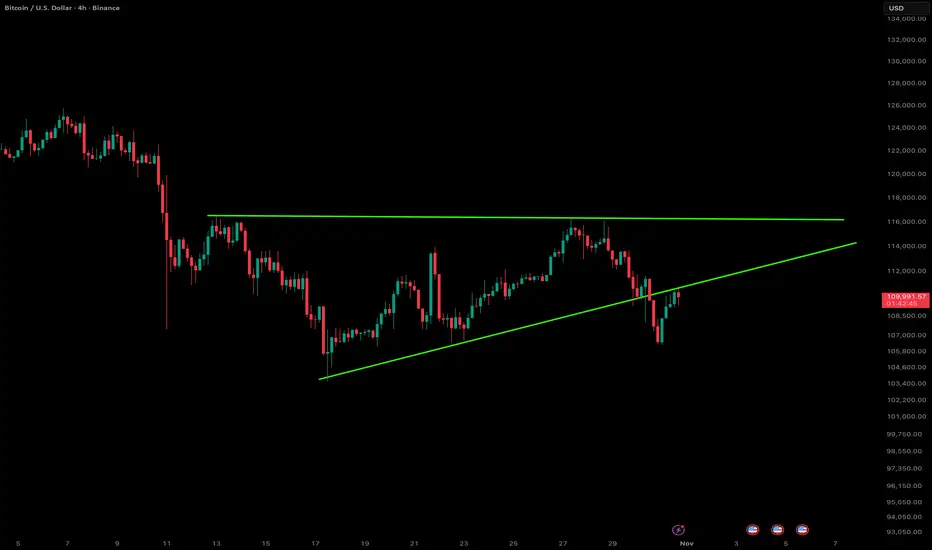
Bitcoin – Breakdown from the Ascending TriangleBitcoin just slipped below the ascending triangle support on the 4-hour chart, signaling a potential shift in short-term momentum. The structure had been forming higher lows toward the $115K resistance zone, but sellers stepped in hard near the top, breaking the trendline that’s been guiding the uptrend since mid-October.
The move comes amid broader weakness across the crypto market — BTC has shed about 3.7% this month, while altcoins like XRP and ETH are also struggling. Despite the pullback, Bitcoin still holds an impressive 18% gain for the year, so the bigger picture remains constructive.
Macro pressure seems to be weighing on sentiment — investor caution around interest rates, inflation, and the Fed’s next move is keeping volatility elevated. If upcoming data tilts toward another rate cut, we could see renewed upside momentum. But for now, price action suggests a possible retest of lower zones before bulls can re-establish control.
Overall, a clean technical breakdown in the near term, but the broader trend isn’t broken yet. Let’s see if bulls can reclaim that triangle support in the next few sessions.
DONT FORGET TO CHECK MY PROFILE BELOW 👇👇👇
BTC - Long1. The colored horizontal areas show Fibonacci retracement levels, which traders use to spot possible support and resistance zones where the price might reverse or continue its move.
2. The 0% level is at the top (115,943) and the 100% level is at the bottom (109,523).
3. The price is currently near 113,207 and close to the 50% (112,732) and 61.8% (111,975) retracement levels.
4. Volume bars at the bottom show how much Bitcoin is being traded at each time.
5. If price bounces from the 50% or 61.8% levels (these are green and blue zones), traders can consider buying (long entry), hoping the price will go up. Always watch for a reversal candle or increased volume at these levels before entering.
6. Place your stop-loss just below the 61.8% level. For example, below 111,975.
7. Set your first target near the 38.2% level (113,490) and second target near the 23.6% level (114,428).
8. If price breaks below the 61.8% level with strong volume, avoid buying and look for a sell setup instead.
9. This setup uses common trading concepts like Fibonacci, support and resistance, and volume confirmation. Remember to wait for confirmation signals and manage risk with stop-loss orders.

BTC/USD – Structure Played Out Perfectly | Major CHoCH ConfirmedAs marked in the previous analysis (shown on the right), BTC/USD respected the channel structure and delivered the expected downside move after confirming both Minor and Major CHoCH (Change of Character) levels.
Price reacted beautifully within the ascending channel, failing to hold the upper trendline resistance and then showing a clear structure shift — confirming bearish momentum.
This move validates the power of multi-timeframe structure + CHoCH confirmation, which provided an early sign of the reversal.
✅ Bearish CHoCH confirmation at the channel top.
🔹 Strong rejection from upper trendline resistance.
📉 Price broke structure and followed the projected path precisely.
⚙️ Next major support zone sits near 108,500 – 109,000 USD.
🧭 Possible short-term consolidation before continuation.
#BTC #PriceAction #SmartMoneyConcepts #CHoCH #TechnicalAnalysis #CryptoTrading #HenishMavani
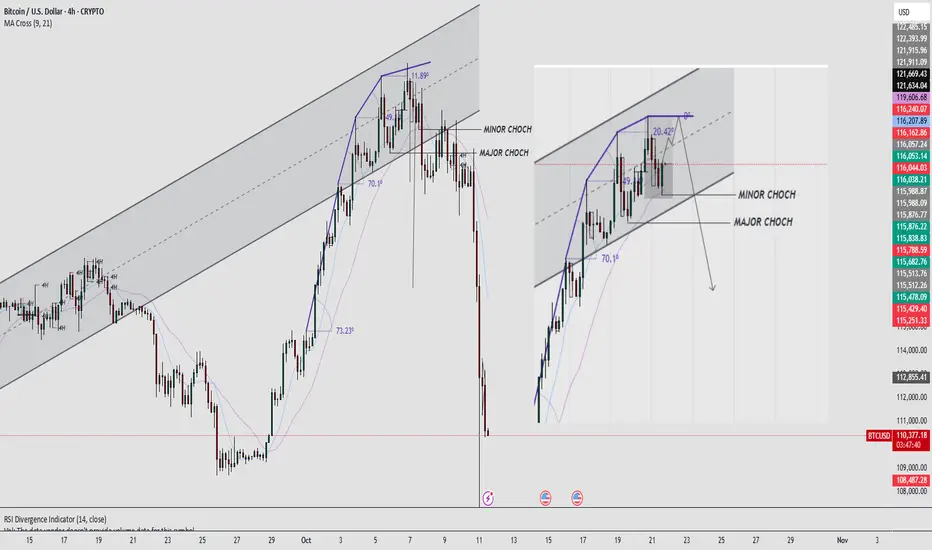
BTC/USD: Structure Shift Confirmed - Bearish CHoCH Break"The previous analysis highlighted the Minor and Major CHoCH levels as key lines in the sand for the recent uptrend. The market has now decisively broken BELOW both levels.
This action confirms a Bearish Change of Character in the market structure (on the chart), signaling a failure of the current bullish order flow.
Minor CHoCH Break : Confirmed the initial weakness and short-term pullback.
Major CHoCH Break : Confirms the structural shift, indicating that the corrective move is likely to be deeper than a simple consolidation.
We should now anticipate a shift in price action: making Lower Highs and Lower Lows . The previous support levels may now act as resistance. Looking for the next key demand zones for a potential bounce, but the immediate bias is now BEARISH ."

Bitcoin Testing Resistance with Potential Pullback AheadKey observations:
Range Breakout: Earlier, Bitcoin broke out of a consolidation zone (marked box), which triggered the recent upward move.
Resistance Zone: Price is hovering near the 5.15%–5.42% gain zone, where selling pressure has historically emerged.
Pullback Signal: The drawn arrow suggests a possible rejection at this resistance, pointing to a corrective move down toward the 3% zone.
Momentum Check: If BTC fails to hold above this resistance, a retracement is likely. However, a strong breakout could open the door toward 6% gains.
📌 Conclusion:
Bitcoin is at a decision point. Rejection at resistance could bring a pullback toward 2.8%–3.0%, while a breakout above 5.4% would continue the bullish momentum.
BTC - LONGBitcoin has broken above the 200 EMA, confirming bullish bias.Price is supported by the 10 & 20 EMA crossover (short-term bullish trend). As long as BTC holds above $115,000, upside targets are $117,600 and then $120,000. If it loses $115,000, caution — the bullish setup may fail.

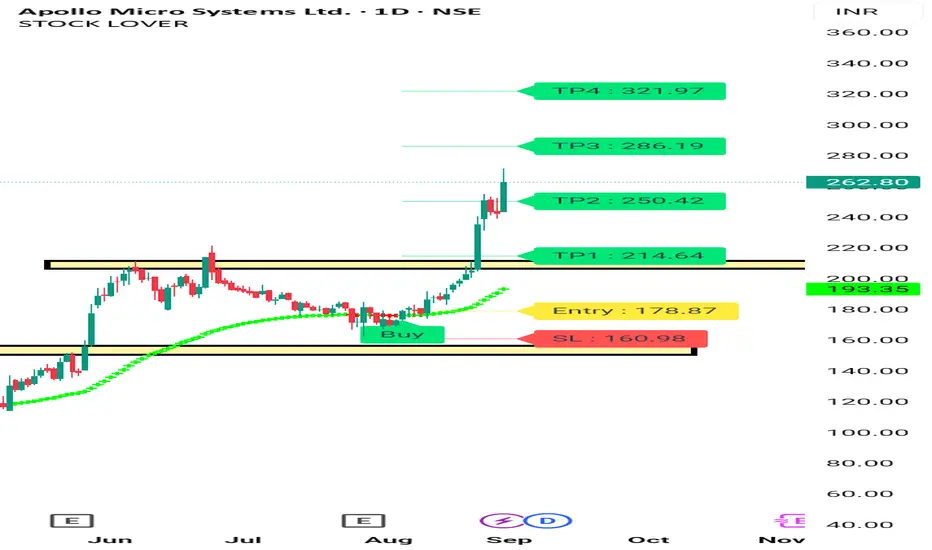
APOLLO MICRO SYSTEM BULLISH CHART APOLLO micro system chart posted on tradingview on 24 Aug , it's moved 12% Since then. It's win a order . Chart Shows u movement before news . Keep Following Us and Enjoy. For More, watch my Profile.
Consult your financial advisor before making any position in stock market. My all views are for educational purposes only.
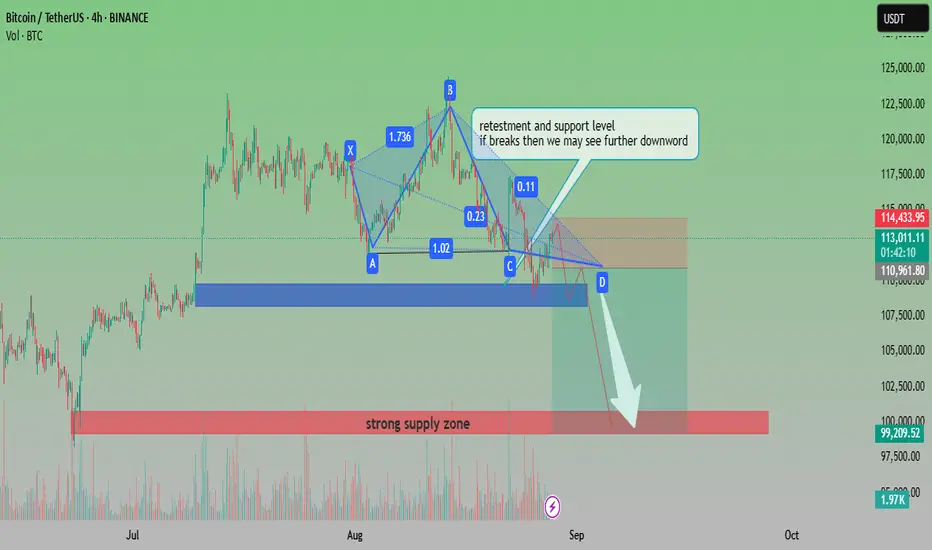
BTCUSDT Bearish Pattern with Key Support RetestAnalysis:
The chart shows Bitcoin (BTCUSDT) forming a harmonic pattern that signals potential bearish continuation. Price is currently retesting a critical support and resistance level around the 113,000–114,000 zone. If this level fails to hold, further downside movement is expected.
Pattern Formation: The harmonic structure (XABCD) suggests a bearish setup.
Support Zone: Around 110,900–111,000, a crucial level to watch.
Downside Target: If support breaks, the price could move toward the 99,000–100,000 strong supply zone.
Volume: A noticeable volume build-up supports potential continuation to the downside.
📉 Outlook: Bearish bias. A breakdown from current retest levels may accelerate selling pressure toward the 100k psychological zone.
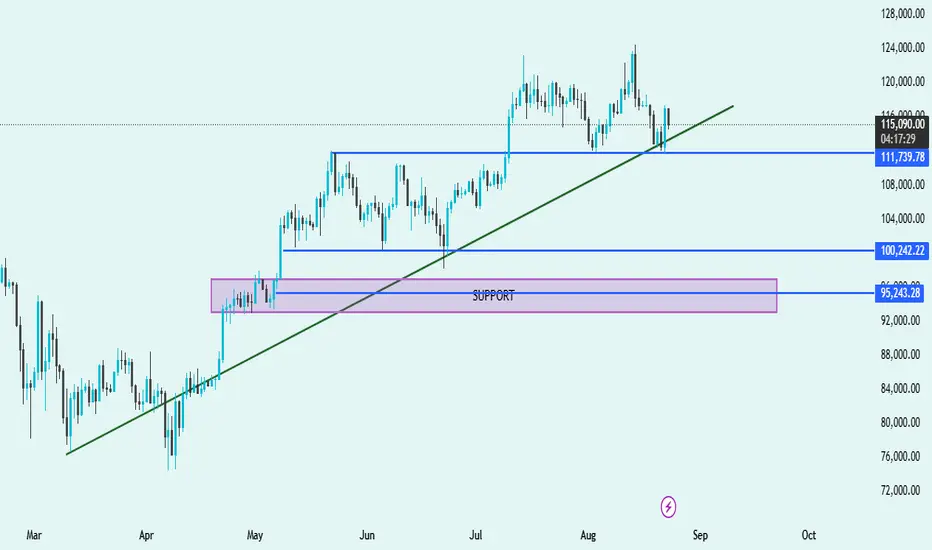
BTC/USDT Technical Analysis – Key Levels & Trend Outlook📊 BTC/USDT Technical Analysis – Key Levels & Trend Outlook 🚀📉
🔹 Trend Structure
Price is currently trading above the trendline, suggesting bulls are still in control, but momentum has weakened.
🔹 Support Zones
Immediate Support: 🔵 $111,739
Price recently tested this level and bounced, showing demand from buyers.
Key Mid-Support: 🔵 $100,242
Strong historical level where buyers stepped in multiple times.
Major Demand Zone: 🟪 $95,243 – $96,500
Highlighted purple support box; this is a critical accumulation zone where bulls are likely to defend strongly.
🔹 Resistance Levels
Near-term resistance: Around $120,000 – $124,000 (recent swing highs).
A breakout above this zone could fuel a new bullish rally.
🔹 Market Outlook
✅ Bullish Bias as long as price respects the green trendline and stays above $111,739.
⚠️ If the price breaks below $111,739 and the trendline, expect a deeper pullback toward $100,242 or even the major demand zone $95,243.
🚀 A breakout above $120K will signal strong continuation to new highs.
📌 Summary:
Trend: Uptrend ✅
Key Supports: $111,739 → $100,242 → $95,243
Resistance: $120,000 – $124,000
Bias: Bullish above $111K, cautious below 🔻
"Bitcoin Eyes $100K Re-Entry: Retest, Support Zone, Then Push ?Chart Analysis
1. Price Structure & Trendlines
The chart displays a former upward trendline that has been broken, leading to a corrective pullback.
Following that, price is perched within a “retest zone” (the red-shaded rectangle), which aligns with both historical horizontal resistance—now turning into support—and an area of previous consolidation. This is a classic setup: price often retests key breakout levels before resuming its move.
2. Support Levels
The main support is clearly drawn around the $100K zone, highlighted by a grey bar below the retest zone. This is a psychological and structural area to watch for potential strong buying.
Immediate support appears near $110K–$112K, as noted by the lower edge of the red retest area—this zone has shown to catch corrections before in technical analysis and news reports
AInvest
Mudrex
Barron's
.
3. Resistance & Upside Targets
If the retest holds, the chart charts a potential bounce toward the upper rising trendline and beyond, potentially aiming for the $126K–$130K region, as marked by Fibonacci retracement levels.
This aligns with several external forecasts suggesting resistance or target zones in that range
AInvest
Mudrex
Barron's
.
4. Potential Price Path & Scenarios (Denoted by Red Arrows)
Bearish Scenario: Price may dip down into the retest zone, test support, and—if the breakdown occurs—continue lower toward $100K—a key area of interest.
Bullish Scenario: The support holds, leading to a V-shaped recovery that propels price back above $115K, potentially triggering a rally toward $122K–$130K.
Summary Table
Key Zone / Level Significance & Note
$110K–$112K Critical near-term support; breakdown risks move toward $100K
AInvest
Mudrex
Retest Zone (~$114K–$115K) Area combining horizontal support and trendline; serves as pivot for next move
Mudrex
AInvest
$120K–$123K Major resistance where a breakout could fuel continuation toward $127K–$130K
Mudrex
Barron's
Broader Context & Market Sentiment
Bitcoin is currently consolidating after setting new highs near $124K
MarketWatch
The Economic Times
Barron's
Cointribune
.
Analysts observe that sustaining above the $110K–$112K band is essential to the bullish case; falling below it could invite deeper downside
Barron's
Cointribune
AInvest
.
Conversely, a decisive move above $120K–$123K could validate continuation toward $127K–$130K, and even higher—some forecasts extend to $135K and beyond
Mudrex
Indiatimes
Barron's
CoinCodex
.
Final Thoughts
Your chart beautifully illustrates the classic “retest after breakout” dynamic:
Hold above the retest zone? Look for a rebound toward $120K+, with the potential for a full bullish revival aiming for $130K.
Break below $110K–$112K? Watch for a possible move toward $100K—a critical support level.
Stay alert to macro catalysts too—like Federal Reserve interest rate signals, institutional inflows (ETFs), and regulatory developments—which could steer the next leg substantially

Bitcoin is Bullish or Bearish - 20th Aug 2025First, In my previous charts mentioned take long with money management. I didnt expect this much of fall and i had to cut my longs to hold the rest. Technically no answer for this fall since its mad short selling and group games or big players selling to get liquidity before they buy. They are buying at every dips in very large qty. Exchanges buy sell as well to kill and eat others
Price is at previous tested proved support. Any analyst can only suggest buy this dip and to be 100% security allow price to test the support again and then buy based on reaction. Support and Resistance are tested and will hold or breakout as well right. In my view for Bitcoin every previous proved support should not break since whales buy and rise the price. Not sure who is that whales selling causing support to break. In news I didnt see or knowing how is that big player sold causing price to drop this much. Stay Safe, I am doing my best or suggesting what I am also doing. God Bless Bitcoin traders.

BTC/USD Eyeing Breakout Toward $121.5K – Supply Zone Retest ?Current Price: ~$119,872 showing consolidation just above the 0.618 Fibonacci retracement level.
Structure: Price has bounced from the supply zone (~118.4K–118.6K) and is currently pushing upward.
Ichimoku Cloud: Price is trading within a cloud breakout attempt, indicating potential bullish momentum.
Fair Value Gaps (FVG): Two unfilled FVGs above suggest liquidity targets at ~$120.6K and ~$121.5K.
Support Levels:
Strong Support: ~$115.8K–116.5K.
Local Supply Zone Support: ~$118.4K.
Target: Main upside target sits at $121,533, aligning with a prior high and liquidity pool.
Trade Plan (Long Setup):
Entry: $119,700 – $119,900 (current consolidation zone)
Stop Loss: Below $118,400 (below supply zone)
Take Profit 1: $120,600 (first FVG target)
Take Profit 2: $121,533 (major resistance/liquidity target)
Risk/Reward Ratio: ~2.8
Notes: Wait for a bullish confirmation candle or 1H close above $119,900 before entering. Avoid chasing if price spikes without retest.
This plan follows the chart’s bullish structure and aims to ride the move into the untested liquidity areas above.
If you want, I can also give you a short scenario plan in case price rejects here. That would make this a full two-way trade setup.

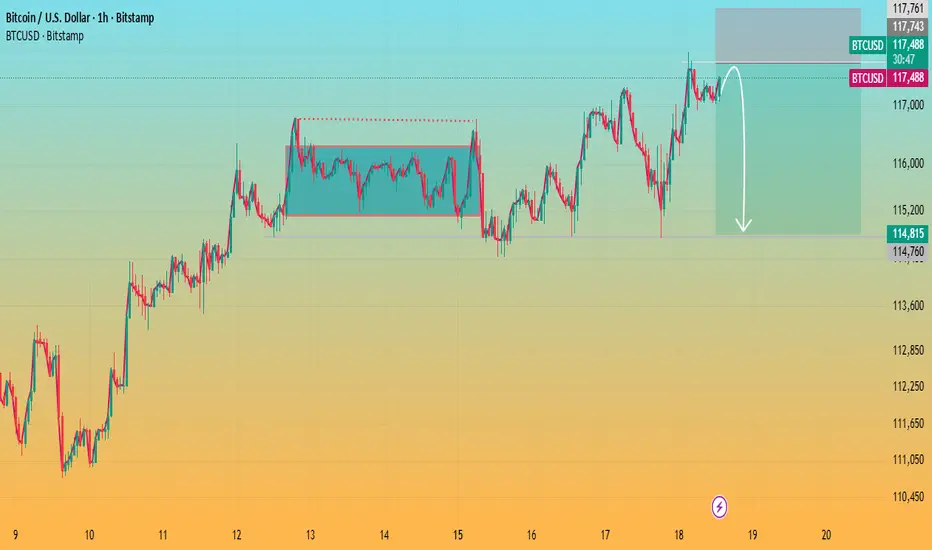
BTCUSD Eyes Lowest Support Retest-Weakness PersistsThis 15-minute chart on BTCUSD reflects sustained bearish conditions, with clear rejection patterns and sell momentum guided by Leola Lens SignalPro overlays.
🔍 Technical Structure Highlights
🔻 Multiple SELL signals continue to appear below compression zones — indicating persistent supply.
🟡 Caution Labels marked each major swing low, capturing high-probability trend reversal zones, but no structural breakout followed.
🟥 Price remains trapped beneath both adaptive red and white base trendlines, confirming dominant downside bias.
🟩 A brief BUY signal appeared inside a narrow range, but failed to follow through — highlighting overall market weakness.
🔁 What to Watch
A clean move above $113,374 is needed to shift momentum toward the $114,800–$116,000 resistance band.
If rejection holds, price may rotate back toward the lower support zone near $112,713, or further.
🧠 This chart illustrates a structure-first approach using Leola Lens SignalPro. For educational analysis only. Trade safe.
#BTCUSD #Bitcoin #Crypto #LeolaLens #StructureTrading #SmartContext #PriceAction

BTC - revised TP is 130K - Logic explainedI agree two times support for completion of wave 4 got broken but due to news flow other wise logic given in previous charts are based on confirmation of support. Now this may not go wrong. First resistance is at 116K and mean revision level is 118, once we cross these two level every analyst agree we will make new ATH and that level is 130 as per my calculations for wave 5. This is minimum level and it can be more higher as well like 150 , 180K which many people talking with their logics which i agree too. I am saying 130 is minimum we will see this year 2025 by sooner for sure.

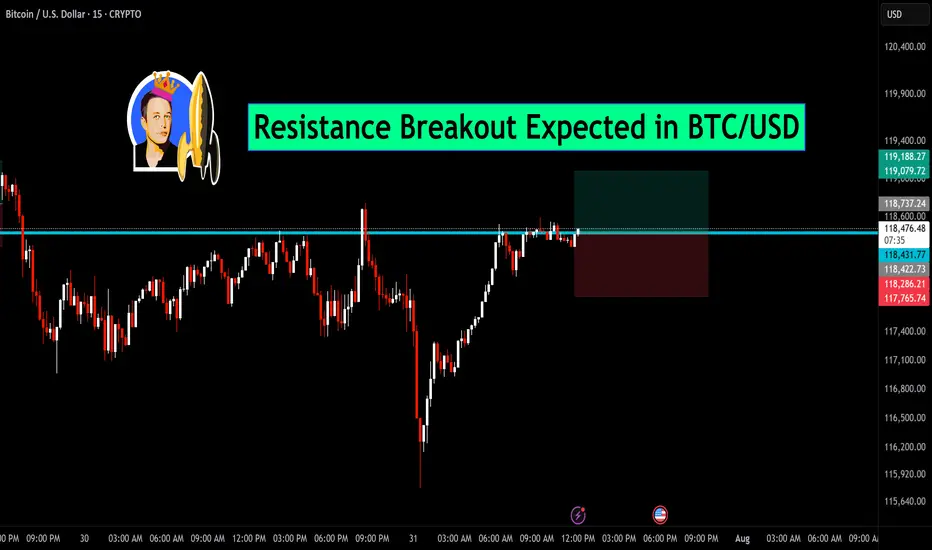
Resistance Breakout Expected in BTC/USDBitcoin is currently testing a key horizontal resistance near the $118,600 zone. After a sharp recovery from recent lows, the price is consolidating just below this level, indicating a potential breakout.
🔍 Chart Insights:
Price action forming higher lows, showing strength.
Breakout above the marked resistance may trigger a strong bullish move.
Tight consolidation near resistance suggests bulls are preparing for a push higher.
📈 Trade Setup:
Entry: Above $118,600 breakout
Target: $119,188 and beyond
Stop-loss: Below $118,200
If price sustains above resistance with volume confirmation, BTC/USD could witness fresh momentum on the upside. Stay alert for the breakout candle.
BTC - TP 127200 confirmed coming !!! 29th july viewEveryone are in same page with respect to wave 5 is in progress and we will be seeing new high.
Inner waves of 5th wave is clear now with support formed and ABC corrective move of 2nd wave seems to be completed price moving up. when price respect fib levels and align with wave theory then we can predict the targets. 3rd, 4th and 5th are plotted based on the first 2 move and this will happen for minimum possibilities. so with this data points I am predicting TP of 127200 for BTC very soon in short term.
