BTCUSDT LONG Trade Of The YEARLonging BTC here for a swing isn’t a bad idea.
TP: ~100k
SL: 78k
BTC is underperforming GOLD and Retail is FOMO’ing into gold & traditional assets.
Narrative shifting to crypto is dead this cycle
Fear & Greed shows crypto traders are scared.
that’s exactly the signal.
that’s when smart money steps in.
I’m taking the long.
— Ommeva
Btctrading


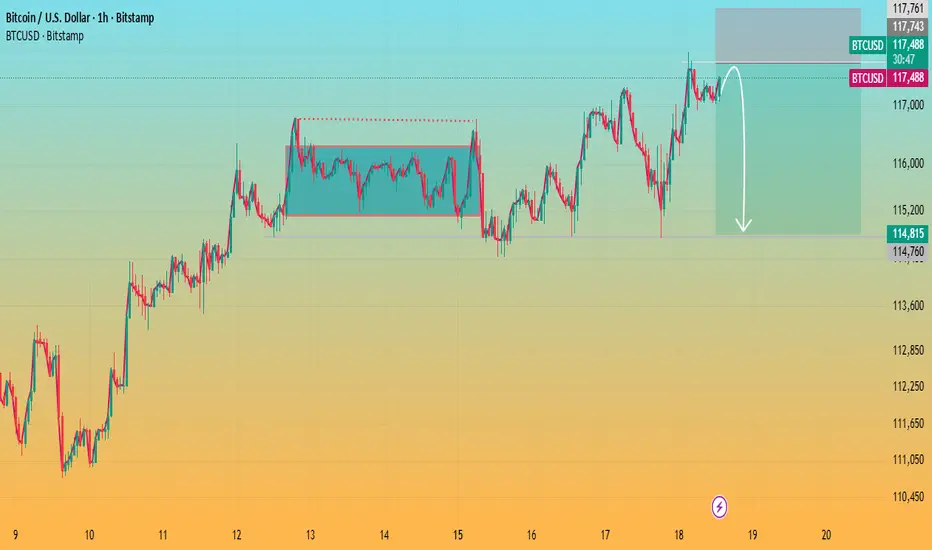
BTCUSD – 1H | Liquidity Run → Distribution →Mean Reversion ScenePrice delivered an impulsive expansion into premium after sweeping internal liquidity from the range lows. That move was displacement, not acceptance.
We are now stalling at a prior H1 supply / EQH zone near the range high. Structure here is weak: wicks, overlap, and loss of momentum hint at distribution rather than continuation.
Narrative
Liquidity taken above recent highs
Price taps premium supply
Expect a lower high / range failure
Smart money likely reallocating shorts
Execution Bias
Shorts favored below the blue level
Invalidation only on clean H1 acceptance above supply
Downside Targets
Range mid → internal liquidity
Range lows
External sell-side resting near deep discount zone
Until price shows acceptance above supply, this remains a sell-the-rally environment.
Expansion up was the trap. Mean reversion is the play.

BTC 1H: Rejection at Supply, Bearish Continuation RiskChart Analysis (1H BTC/USD):
Major Supply Zone (~90,000–90,200):
Price was strongly rejected from this area, confirming it as a key overhead resistance. Sellers remain active here.
Fair Value Gap (FVG) / Mid Resistance (~89,000–89,500):
The red FVG zone above current price acts as a likely pullback target, but also a strong sell zone if revisited.
Current Structure:
After the rejection, BTC broke down and is consolidating below short-term EMAs, indicating bearish momentum on the 1H timeframe.
Key Support Zones:
Near-term demand: ~86,700
Major downside target: ~84,600
Loss of the 86.7k support increases probability of a deeper move toward 84.6k.
Projected Path:
The dotted projection suggests a possible pullback into resistance (87.8k–89k) followed by continuation lower, unless price reclaims and holds above the FVG.
Bias:
Below 89k: Bearish / sell rallies
Above 90.2k: Bearish bias invalidated, trend may shift bullish

Weekly Analysis of BTC with Buy/Sell scenarios...We analyzed three weeks back that BTC would be in range for some time before taking any further move, And BTC is following same analysis and trapped within a small range since then. BTC prediction of last week also worked perfectly well and market kept in consolidation mode itself. BTC is still in consolidation zone and may spend some more days. It may develop ABC pattern or reversal at identified daily FVG level, if price has to change its delivery and take turn from here. This zone is kind of make or break. If price is not able to sustain and breakdown, then it may witness ~65-70K levels as well.
We hope for reversal from this level as price is developing the pattern at higher time frame.
1. Price has taken liquidity or 82K and almost touched 80K.
2. It has inversed 1Day FVG and now price is consolidating in the range between EMAs.
3. We may expect price retracement till 1D iFVG and then reversal.
4. Before to that we may see sweep of 92900 (1D CISD) level and then a retracement short trade till 1D FVG
5. Most probably price will take liquidity of FVG/RDRB level and create MSS/CISD/TS/iFVG in LTF.
6. Price should show rejection/reversal in respective LTF (5m/15m) at FVG zone.
7. Take the trade only once clear entry model i.e. turtle soup. iFVG break, CDS or MSS happens on LTF
All these combinations are signaling a high probability and ~8R trade scenario.
Note – if you liked this analysis, please boost the idea so that other can also get benefit of it.
Also follow me for notification for incoming ideas.
Also Feel free to comment if you have any input to share.
Disclaimer: This analysis is for educational purposes only and does not constitute investment advice. Please do your own research (DYOR) and check with your financial advisor before making any trading decisions.

BTCUSD Liquidity Sweep Setup Before Bearish ContinuationBTCUSD Liquidity Sweep Setup Before Bearish Continuation
Overview
BTCUSD continues to display persistent downside pressure across the mid-term structure. Price action on the 3H timeframe shows a sequence of lower highs and lower lows, reflecting sustained bearish control. Despite short periods of stabilization, the overall market environment remains distribution-driven.
Market Structure
Recent price behavior confirms multiple break-of-structure (BOS) events, each reinforcing the broader downward momentum. Every attempt at upward expansion has been met with supply absorption, indicating that buyers are failing to regain initiative. The consolidation developing in the current region suggests an accumulation of short-term liquidity, but without structural evidence of reversal.
Supply & Liquidity Context
Price is positioned directly beneath a key supply zone highlighted on the chart. This zone remains unmitigated and acts as the primary area where counter-trend reactions are likely to be absorbed. The tightening range beneath this level indicates liquidity buildup, commonly preceding engineered sweeps by institutional players.
The current model suggests that the market may execute a short-term liquidity run above local highs before resuming its downward trajectory. Such a move would align with previous behavior in this trend cycle, where short-term rallies were primarily used to deliver liquidity into higher-timeframe supply.
Downside Expansion Risk
Should the market complete a liquidity sweep into the supply zone, the next phase of downside continuation becomes probable. The structural projection on the chart anticipates a revisiting of the lower demand region around 74,300 – 75,000, an area aligning with previous inefficiencies and untested demand.
This target supports the continuation of the broader bearish structure unless a significant shift in order flow emerges.
Summary
BTCUSD remains positioned within a well-defined bearish cycle, characterized by repeated structure breaks and unmitigated supply zones controlling price. Current compression suggests the market is preparing for another liquidity-driven move. Unless buyers regain structure above the key supply region, the market retains a high probability of extending toward lower demand zones.

BTC Swing 8R reversal scenario....BTC moved as per our plan throughout last 10-15 days and crashed to ~ 90K levels, now it has reached to its critical level of reversal, which is weekly FVG CE area. Price has already shown change in delivery at 4H level. All these making it a really good contender for a long swing trade which may even lead to all time high.
1. Price has tested CE of weekly strong FVG and formed CISD at 4-hour level.
2. Now it is testing CISD imbalance area to form proper entry model…
3. We may wait for MSS to occur in this area in 15 minutes for more precise entries.
4. Most probably price will take liquidity of FVG/RDRB level and create MSS/CISD/TS/iFVG in LTF.
5. Price should show rejection/reversal in respective LTF (5m/15m) at FVG zone.
6. Take the trade only once clear entry model i.e. turtle soup. iFVG break, CDS or MSS happens on LTF
All these combinations are signalling a high probability and ~8R trade scenario.
Note – if you liked this analysis, please boost the idea so that other can also get benefit of it.
Also follow me for notification for incoming ideas.
Also Feel free to comment if you have any input to share.
Join me on live stream for real time update.
Disclaimer: This analysis is for educational purposes only and does not constitute investment advice. Please do your own research (DYOR) and check with your financial advisor before making any trading decisions.

BTC/USD: Structure Shift Confirmed - Bearish CHoCH Break"The previous analysis highlighted the Minor and Major CHoCH levels as key lines in the sand for the recent uptrend. The market has now decisively broken BELOW both levels.
This action confirms a Bearish Change of Character in the market structure (on the chart), signaling a failure of the current bullish order flow.
Minor CHoCH Break : Confirmed the initial weakness and short-term pullback.
Major CHoCH Break : Confirms the structural shift, indicating that the corrective move is likely to be deeper than a simple consolidation.
We should now anticipate a shift in price action: making Lower Highs and Lower Lows . The previous support levels may now act as resistance. Looking for the next key demand zones for a potential bounce, but the immediate bias is now BEARISH ."

Bitcoin Testing Resistance with Potential Pullback AheadKey observations:
Range Breakout: Earlier, Bitcoin broke out of a consolidation zone (marked box), which triggered the recent upward move.
Resistance Zone: Price is hovering near the 5.15%–5.42% gain zone, where selling pressure has historically emerged.
Pullback Signal: The drawn arrow suggests a possible rejection at this resistance, pointing to a corrective move down toward the 3% zone.
Momentum Check: If BTC fails to hold above this resistance, a retracement is likely. However, a strong breakout could open the door toward 6% gains.
📌 Conclusion:
Bitcoin is at a decision point. Rejection at resistance could bring a pullback toward 2.8%–3.0%, while a breakout above 5.4% would continue the bullish momentum.
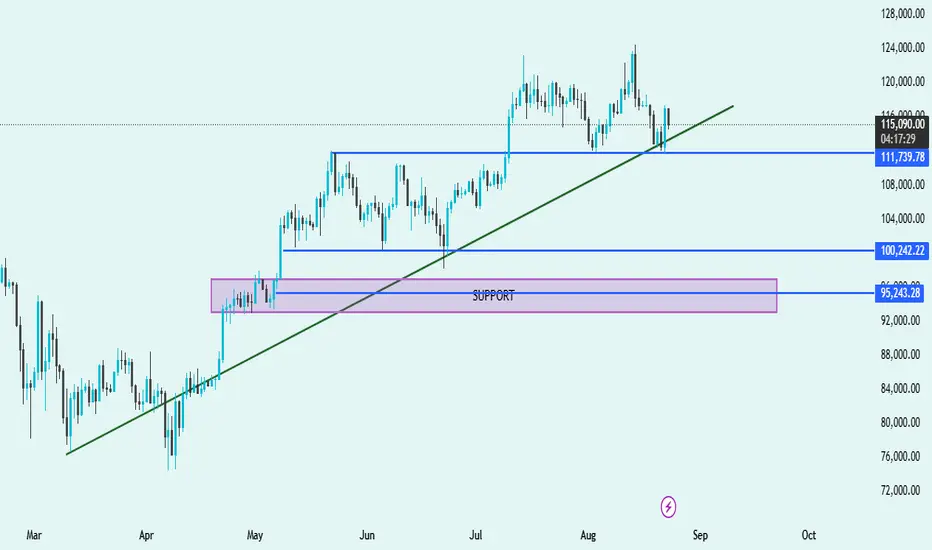
BTC/USDT Technical Analysis – Key Levels & Trend Outlook📊 BTC/USDT Technical Analysis – Key Levels & Trend Outlook 🚀📉
🔹 Trend Structure
Price is currently trading above the trendline, suggesting bulls are still in control, but momentum has weakened.
🔹 Support Zones
Immediate Support: 🔵 $111,739
Price recently tested this level and bounced, showing demand from buyers.
Key Mid-Support: 🔵 $100,242
Strong historical level where buyers stepped in multiple times.
Major Demand Zone: 🟪 $95,243 – $96,500
Highlighted purple support box; this is a critical accumulation zone where bulls are likely to defend strongly.
🔹 Resistance Levels
Near-term resistance: Around $120,000 – $124,000 (recent swing highs).
A breakout above this zone could fuel a new bullish rally.
🔹 Market Outlook
✅ Bullish Bias as long as price respects the green trendline and stays above $111,739.
⚠️ If the price breaks below $111,739 and the trendline, expect a deeper pullback toward $100,242 or even the major demand zone $95,243.
🚀 A breakout above $120K will signal strong continuation to new highs.
📌 Summary:
Trend: Uptrend ✅
Key Supports: $111,739 → $100,242 → $95,243
Resistance: $120,000 – $124,000
Bias: Bullish above $111K, cautious below 🔻
"Bitcoin Eyes $100K Re-Entry: Retest, Support Zone, Then Push ?Chart Analysis
1. Price Structure & Trendlines
The chart displays a former upward trendline that has been broken, leading to a corrective pullback.
Following that, price is perched within a “retest zone” (the red-shaded rectangle), which aligns with both historical horizontal resistance—now turning into support—and an area of previous consolidation. This is a classic setup: price often retests key breakout levels before resuming its move.
2. Support Levels
The main support is clearly drawn around the $100K zone, highlighted by a grey bar below the retest zone. This is a psychological and structural area to watch for potential strong buying.
Immediate support appears near $110K–$112K, as noted by the lower edge of the red retest area—this zone has shown to catch corrections before in technical analysis and news reports
AInvest
Mudrex
Barron's
.
3. Resistance & Upside Targets
If the retest holds, the chart charts a potential bounce toward the upper rising trendline and beyond, potentially aiming for the $126K–$130K region, as marked by Fibonacci retracement levels.
This aligns with several external forecasts suggesting resistance or target zones in that range
AInvest
Mudrex
Barron's
.
4. Potential Price Path & Scenarios (Denoted by Red Arrows)
Bearish Scenario: Price may dip down into the retest zone, test support, and—if the breakdown occurs—continue lower toward $100K—a key area of interest.
Bullish Scenario: The support holds, leading to a V-shaped recovery that propels price back above $115K, potentially triggering a rally toward $122K–$130K.
Summary Table
Key Zone / Level Significance & Note
$110K–$112K Critical near-term support; breakdown risks move toward $100K
AInvest
Mudrex
Retest Zone (~$114K–$115K) Area combining horizontal support and trendline; serves as pivot for next move
Mudrex
AInvest
$120K–$123K Major resistance where a breakout could fuel continuation toward $127K–$130K
Mudrex
Barron's
Broader Context & Market Sentiment
Bitcoin is currently consolidating after setting new highs near $124K
MarketWatch
The Economic Times
Barron's
Cointribune
.
Analysts observe that sustaining above the $110K–$112K band is essential to the bullish case; falling below it could invite deeper downside
Barron's
Cointribune
AInvest
.
Conversely, a decisive move above $120K–$123K could validate continuation toward $127K–$130K, and even higher—some forecasts extend to $135K and beyond
Mudrex
Indiatimes
Barron's
CoinCodex
.
Final Thoughts
Your chart beautifully illustrates the classic “retest after breakout” dynamic:
Hold above the retest zone? Look for a rebound toward $120K+, with the potential for a full bullish revival aiming for $130K.
Break below $110K–$112K? Watch for a possible move toward $100K—a critical support level.
Stay alert to macro catalysts too—like Federal Reserve interest rate signals, institutional inflows (ETFs), and regulatory developments—which could steer the next leg substantially

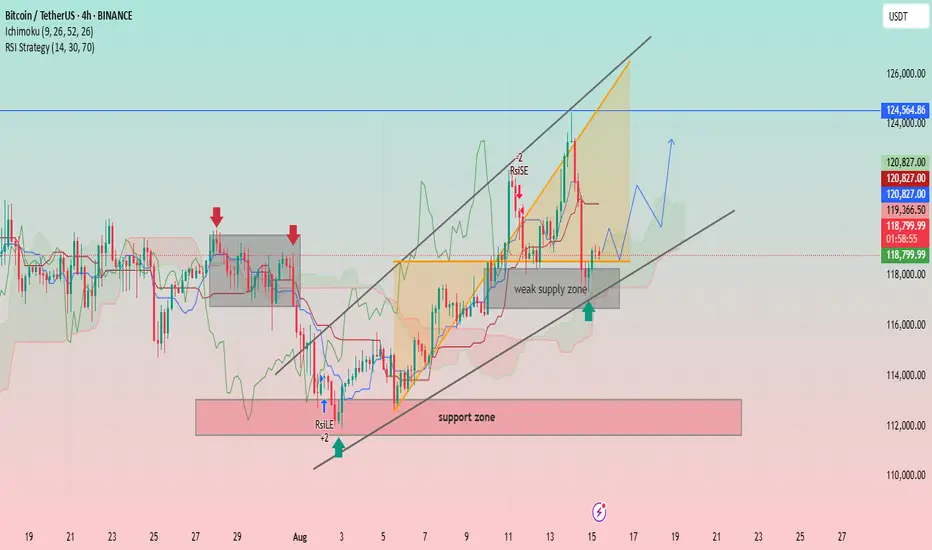
BTC/USDT: Bullish Momentum and Key Support LevelsUptrend Channel: The price is trading within an ascending channel, denoted by two parallel black trendlines. This suggests a bullish trend is in play.
Support and Resistance:
A significant support zone is identified between approximately 112,000 and 114,000 USDT.
A weak supply zone is marked around 118,000 USDT. The price has recently tested this area and found some support.
A strong resistance level is visible at approximately 124,564.86 USDT.
Indicators:
Ichimoku Cloud (9, 26, 52, 26): The price is currently trading above the cloud, indicating a bullish sentiment. The cloud itself appears to be thin and slightly bullish, suggesting potential for continued upward movement.
RSI Strategy (14, 30, 70): The Relative Strength Index (RSI) is used as a strategy, with a "RSILE" signal (likely "RSI Low Entry") marked with a "+2" and a red arrow, suggesting a potential buy signal near the support zone in early August. A "-2" signal is marked near the top of the channel, indicating a potential overbought condition or reversal signal.
Price Action and Projections:
The price recently experienced a sharp decline from the upper trendline, indicating profit-taking or resistance at that level.
The price is currently near the lower trendline and the "weak supply zone," which appears to be acting as support.
A potential future price path is drawn with a blue arrow, suggesting that the price may consolidate or bounce off the current support area and move higher towards the upper boundary of the channel.
Another potential path is drawn with a red arrow, showing a possible further drop towards the lower trendline before a bounce.
BTCUSD - Consolidation Breakout & RetestBitcoin has successfully broken out of its consolidation zone on the 15-minute chart. After a strong breakout above the horizontal resistance, we are now seeing a textbook retest of the breakout level, which may act as a fresh support.
✅ Bullish confirmation if price sustains above the breakout zone
📍 Resistance turned support at ~118,700
🎯 Upside momentum likely to continue if this retest holds

BTC/USD Bullish Reversal Breakout Pattern BTC/USD Bullish Reversal Breakout Pattern 🚀
Technical Analysis:
🔹 Trend Reversal: The chart shows a clear inverse head and shoulders pattern highlighted with orange circles — a strong bullish reversal signal after a downtrend.
🔹 Breakout Zone: The neckline resistance around 108,000 USD has turned into support (marked as “SU00QT” due to a typo, assumed to be “SUPPORT”). Price action is consolidating just above this zone.
🔹 Trendline Support: The upward blue trendline confirms bullish structure, with price forming higher lows. Recent price action is bouncing off this trendline, showing strength.
🔹 Bullish Confirmation: Green arrows indicate strong bullish rejections from key levels, aligning with breakout retests.
🔹 Target Projection: The measured move from the inverse head and shoulders pattern projects a target towards the 114,000 USD resistance zone 📦 highlighted above, suggesting a potential 5-6% upside move 📊.
Conclusion: As long as price holds above the 108,000 support zone and the ascending trendline, BTC/USD remains bullish with potential continuation towards 114,000 USD. A breakout above minor consolidation could trigger a strong bullish rally 💥.
🛑 Invalidation: A sustained break below 106,000 USD would invalidate the bullish structure and may lead to further downside.

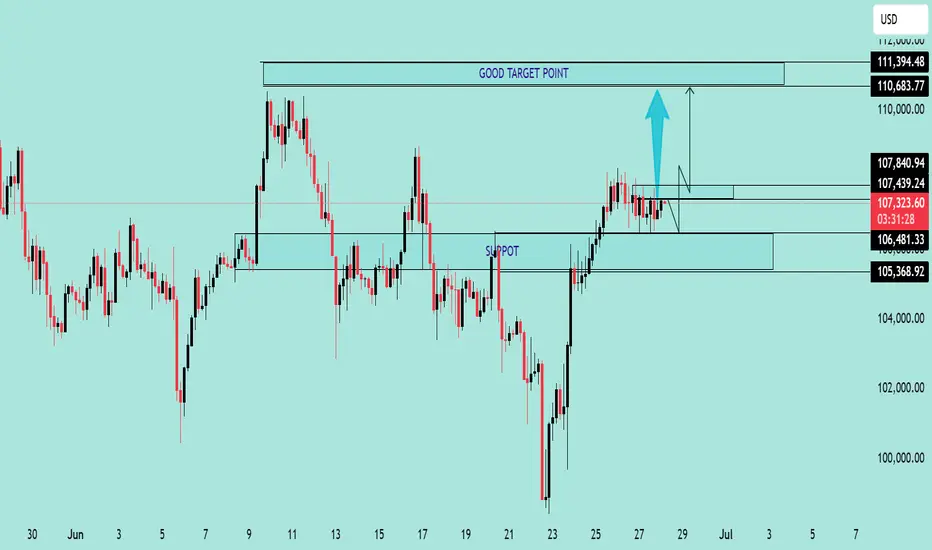
BTC/USD Consolidation Breakout SetupChart Overview:
The BTC/USD chart shows a strong bullish impulse followed by a consolidation phase just below a key resistance level, suggesting a potential bullish continuation.
🔹 Key Technical Zones:
📍 Support Zone:
105,368 – 106,481 USD
This area acted as a strong demand zone where price reversed aggressively.
📍 Resistance Level:
107,439 – 107,840 USD
Price is currently consolidating just below this resistance, indicating a buildup for a breakout.
🎯 Target Zone:
110,683 – 111,394 USD
A clean breakout above resistance could push price into this target area.
🔹 Technical Signals:
✅ Bullish Flag Formation:
After a strong impulse move, BTC is forming a sideways range, indicating bullish accumulation.
⬆️ Breakout Potential:
A confirmed breakout and retest above 107,840 could validate a move toward the 111K region.
⚠️ Invalidation Point:
A drop below 106,481 would invalidate the bullish bias and may trigger a deeper pullback.
📌 Conclusion:
As long as BTC holds above the 106,481 support and breaks above the 107,840 resistance, bullish momentum is expected to continue toward the 111K zone. Traders should watch for a breakout confirmation and manage risk accordingly. 💹
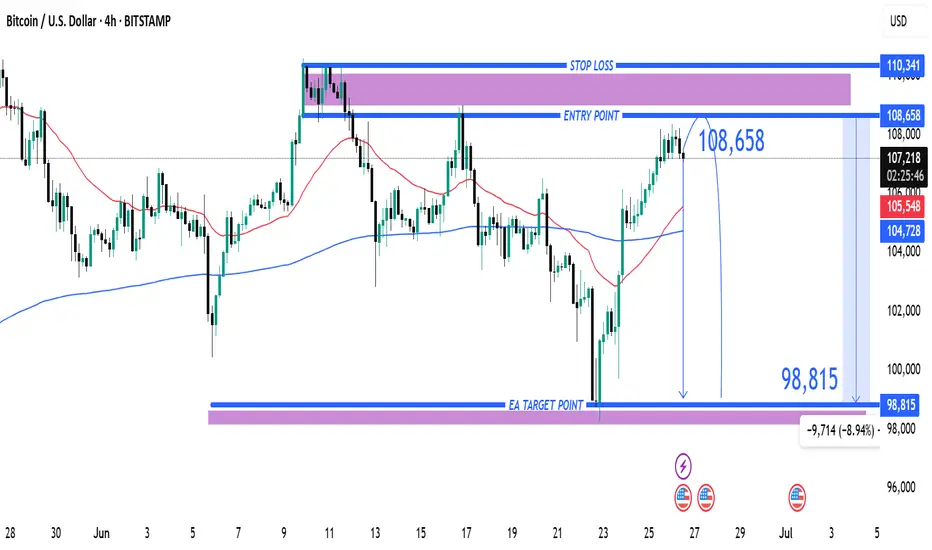
Entry at $108,658 with Target at $98,815 and Stop Loss at $110,31. Entry Point: 108,658
This is where the trader expects to enter a short position.
Price is projected to reverse near this level.
2. Stop Loss: 110,341
Located above the entry point.
If price hits this level, the short trade is invalidated, limiting losses.
3. Target (Take Profit): 98,815
This is the EA Target Point, about 9,714 points (~8.94%) below the entry.
Represents a favorable risk-reward ratio.
---
🔄 Trade Idea Summary
Trade Type: Short (Sell)
Risk: ~1,683 points (110,341 - 108,658)
Reward: ~9,843 points (108,658 - 98,815)
Risk-Reward Ratio: ~1:5.85 (which is strong)
---
📊 Technical Indicators in Use
Moving Averages:
Likely 50-period (red) and 200-period (blue) MAs.
The 50 MA is below the price, indicating short-term bullishness.
However, the trade idea goes against this short-term trend, suggesting a reversal strategy.
---
🔍 Interpretation & Strategy
This chart implies the trader expects resistance near 108,658, possibly due to historical highs or supply zones.
The bearish outlook expects a significant drop to 98,815, possibly supported by macro patterns (like head & shoulders, or bearish divergence—not shown here but could be inferred).
The purple zones highlight high-probability reversal or reaction areas (support/resistance zones).
---
⚠️ Things to Watch
Invalidation: If price closes above 110,341 on a 4H/1D chart, the trade setup fails.
Confirmation: A strong bearish candlestick at or near the entry zone would strengthen the case.
Market Context: News, economic data, or BTC ETF inflows/outflows can quickly invalidate technical setups.
BTC/USDT 4H Analysis – Bullish Cup Formation 📈 BTC/USDT 4H Analysis – Bullish Cup Formation ☕🚀
🔍 Chart Overview:
The 4-hour chart of Bitcoin against USDT on Binance displays a clear "Cup" pattern, suggesting a strong bullish continuation setup. The price action reflects a rounded bottom forming after hitting a solid support zone.
🟣 Key Zones:
🔻 Support Zone: ~$101,000–$103,000
Strong buying interest was observed here with a sharp wick rejection, forming the bottom of the cup.
🔺 Resistance Zone: ~$110,000–$112,000
This area has acted as a historical rejection zone and now stands as the next major target for bulls.
📊 Technical Insights:
The price is gradually curving upward, respecting the rounded cup pattern, often a precursor to a breakout.
A clean break above the resistance zone may trigger continuation toward new highs, possibly above $112,000.
The price is currently at ~$107,700 and gaining momentum with higher lows forming consistently.
🎯 Price Projection:
📌 Target: $111,500–$112,000
📉 Invalidation: Break below the $103,000 support
💡 Conclusion:
If the bullish momentum continues and breaks past resistance, we can expect a powerful upside breakout. Traders should watch for volume confirmation near the resistance zone for potential entry or breakout trades.
📍Pattern in Play: Cup Formation
⚠️Watch for pullbacks before breakout attempts.

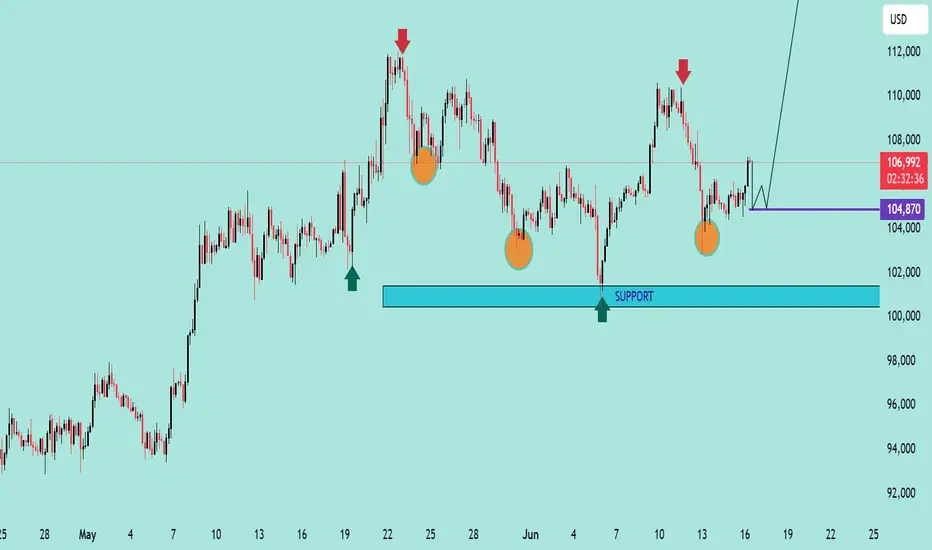
BTC/USD Potential Reversal & Bullish Breakout SetupBTC/USD Potential Reversal & Bullish Breakout Setup 🔄🚀
Technical Analysis Overview:
🔹 Pattern Formation:
The chart displays a potential Triple Bottom pattern (🟠), a classic reversal signal forming at the $104,870–$100,000 support zone 🛡️. This structure suggests a strong base is being established for a potential upside move.
🔹 Support Zone:
📉 The price has consistently bounced off the major support area around $100,000–$104,870, indicating strong buying interest.
🔹 Resistance Zone:
📊 The key resistance level lies around the $114,000–$115,000 range 🔵, which has been tested multiple times in the past (🔴 arrows) and could act as a future profit target.
🔹 Price Action & Projection:
Currently, price is trading near $107,025 and is showing signs of bullish continuation after forming a higher low. If the price consolidates above the $104,870 zone and holds support, we could see a potential breakout targeting the $114,000 resistance 📈.
📌 Key Takeaways:
✅ Triple Bottom formation signals trend reversal.
🔄 Bullish structure confirmed above $104,870.
🎯 Next target: $114,000 if breakout holds.
⚠️ Watch for potential consolidation before continuation.
Bitcoin Bounce & Breakout PlayChart Analysis:
🔹 Support Holding Strong:
BTC is respecting a key support area (~$105,600), which previously acted as resistance (marked by recent ATH).
🔹 EMA 70 (Blue Line):
Price is hovering above the EMA, adding bullish confirmation.
🔹 Bullish Projection Path:
The chart shows a projected bullish move toward the sell zone near $113,200 – $113,300, representing a potential 4.4% gain from the breakout.
🔹 Key Zones:
Support Zone: $105,600
Supply Zone: $100,500
Sell Zone (TP Zone): $113,200+
📌 Outlook:
If BTC breaks and holds above the resistance (~$107,000), a strong upward rally could follow.
Entry near support or on breakout, with tight risk management, offers a favorable risk/reward.
✅ Entry Options:
Breakout Entry:
Trigger: Break and close above $107,200
Confirmation: Retest and hold above the breakout zone
Entry: $107,300 – $107,500
Support Bounce Entry:
Trigger: Pullback to support zone (~$105,600) with bullish reversal candle
Entry: $105,600 – $105,800
🎯 Target Zones (TP):
TP1: $110,400 (minor resistance)
TP2: $113,200 – $113,300 (major sell zone)
TP3 (aggressive): $114,000+
🔻 Stop Loss (SL):
For breakout entry: SL below $106,200
For bounce entry: SL below $105,200 or $104,800 (structure break)
📈 Risk–Reward Ratio:
Approx. 1:2.5 to 1:3+ depending on entry and target
🧠 Trade Management:
Move SL to breakeven after hitting TP1
Partial profit booking at TP1
Trail remaining with manual or dynamic SL (e.g., below EMA or recent low)
⚠️ Risk Notes:
Avoid chasing price without breakout confirmation
Watch for fakeouts and heavy selling near TP zones
Adjust position size based on your risk tolerance

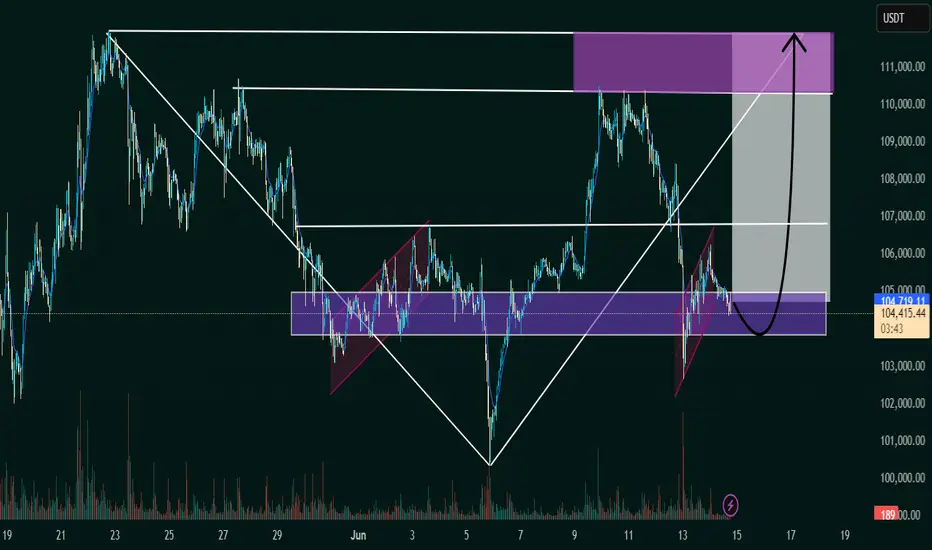
BTC/USDT Bullish Reversal Zone AnalysisSupport Zone:
The horizontal purple box (~104,000 USDT area) has acted as a strong support/resistance flip zone multiple times.
Falling Wedge Breakout:
The price action broke out of a falling wedge pattern earlier, confirming bullish momentum.
Flag Formation (Current):
A smaller bullish flag/pennant appears to be forming, and a breakout above could trigger a strong upward move.
Projected Move:
The black arrow indicates a potential bounce from this support zone, with the price targeting the 111,000–112,000 USDT zone (highlighted in the top purple box).
Volume Spike:
Notable volume spike near the bottom supports the idea of accumulation and possible reversal.
📈 Conclusion:
If the support zone holds and price breaks above the minor flag, a bullish continuation is likely toward the 111,000–112,000 resistance area. Traders should watch for confirmation of a breakout and volume increase for validation.
$BTCUSDT quick short setup. OPENED CRYPTOCAP:BTC Short
Stop Loss : High $106300
Target : $104k
$102.5k

Inverse Head and Shoulders Breakout Signals Bullish The chart under review presents a classic Inverse Head and Shoulders pattern, a reliable and widely recognized bullish reversal formation in technical analysis. This structure typically forms after a downtrend, indicating a potential shift in market sentiment from bearish to bullish.
The pattern is composed of:
Left Shoulder: A modest price decline followed by a temporary upward correction.
Head: A deeper price decline forming the lowest point in the pattern.
Right Shoulder: A higher low that mirrors the left shoulder, followed by another upward movement.
The neckline, which acts as a critical resistance level, is clearly illustrated at approximately 106,840.37 USDT. A confirmed breakout above this neckline suggests the completion of the reversal pattern and validates the potential for a sustained bullish movement.
---
2. Breakout Confirmation
The current price action confirms a successful breakout above the neckline, with the market currently trading around 107,586.58 USDT. This breakout is a key signal for bullish continuation, provided it is supported by increased volume and follow-through price action.
From a technical standpoint, the breakout is reinforced by:
A clean violation of neckline resistance
Price consolidation near breakout zone before a strong upward thrust
Higher lows preceding the breakout, indicative of growing buying pressure
This confluence of technical signals strengthens the case for an upward price trajectory in the near term.
3. Projected Price Targets
Upon confirmation of the Inverse Head and Shoulders breakout, target levels can be derived using the measured move technique. This involves projecting the vertical distance from the head to the neckline upward from the breakout point.
Target 1 (Initial Resistance):
108,878.29 USDT – This level represents a potential short-term resistance where price may consolidate or retrace slightly before continuing.
Target 2 (Measured Move Completion):
110,752.24 USDT – This is the ultimate price target derived from the height of the head-to-neckline structure. Reaching this level would represent the full realization of the reversal patt
4. Key Support and Risk Levels
Risk management is a critical component of any trading strategy. The following support levels should be closely monitored:
106,840.37 USDT (Neckline Support):
Former resistance turned support. Holding above this level post-breakout is essential for sustaining bullish momentum.
105,997.09 USDT:
Acts as a secondary support level and potential stop-loss region for conservative traders.
If price fails to hold above the neckline and falls back below these levels, the breakout could be classified as a false breakout, warranting caution.
5. Strategic Implications for Traders
This setup provides a favorable risk-to-reward ratio for long entries, particularly for traders seeking to capitalize on momentum-based patterns. An optimal trading approach could involve:
Entry: Near the neckline breakout or on a minor retest of 106,840.37 USDT
Stop-Loss: Below 105,997.09 USDT or under the right shoulder to account for volatility
Take-Profit Zones: Partial profits near 108,878.29 USDT, with final target at 110,752.24 USDT
6. Final Remarks
This chart illustrates a textbook example of a bullish reversal pattern in play. While the technical outlook is favorable, traders should remain cautious of potential invalidation scenarios, especially in highly volatile or news-driven markets. Confirmation through volume analysis and supportive macro/fundamental conditions can further enhance confidence in the bullish thesis.
Overall, the current setup indicates a well-structured opportunity for upward price movement, with a clearly defined entry, risk, and reward framework.
Let me know if you'd like this tailored for a trading journal, client report, or automated strategy setup.
