BTCUSD prediction market fail to break support zone.Market fail to break support zone so we entered Trade in same direction with lower time confirmation
Btcusdanalysis

BTC 3H Market Structure Breakdown – Bearish Target at 85,300”BTCUSD 3H Chart Analysis
1. Structure & Trend
Price is moving inside a rising channel (blue trendlines).
But the upper zone contains a Bearish Order Block (OB) between 94,614 – 96,882, causing repeated rejections → bearish reaction zone.
✅ 2. Current Market Behavior
Price has formed a red consolidation box near the top of the channel → indicates distribution.
The market rejected strongly from the OB and is failing to break above the resistance.
This suggests downside momentum is building.
✅ 3. Key Levels
Bearish OB Resistance
94,614 – 96,882
Support Target
85,314.98 (marked as Target Point)
This matches a 9.7% drop projection shown on the chart.
✅ 4. Strategy Breakdown
A) Smart Money Concepts (SMC)
Price tapped into Bearish Order Block → expecting sell-side reaction.
Liquidity above recent highs has already been taken → likely move downward toward sell-side liquidity below.
B) Price Action
Series of lower highs forming inside the red box.
Weak bullish momentum after rejection.
Possible breaker structure forming.
C) Trendline & Channel Strategy
Price may retrace down to the bottom of the rising channel, which aligns with the 85,300 target.
D) Volume & Momentum
(Not shown visually, but interpretation)
Rejection candles show strong selling pressure near the OB zone.
✅ 5. Probable Move (Based on Chart Plan)
📉 Expected scenario:
A breakdown from the consolidation box → fall toward 85,314 support (channel bottom + target zone).
📈 Bullish invalidation:
A breakout above 96,882 would invalidate the bearish setup and open room for new highs.
📌 Conclusion
The chart shows a bearish setup from a high-timeframe order block with a clear downward projection. All strategies—SMC, price action, channel trading, and liquidity concepts—point toward a potential drop to 85.3k if the red box structure breaks down. BINANCE:ETHUSDT BINANCE:DOGEUSDT BINANCE:XRPUSDT BINANCE:XRPUSDT BINANCE:SUIUSDT BINANCE:LINKUSDT CRYPTOCAP:TOTAL BINANCE:BNBUSDT BINANCE:SOLUSDT BINANCE:FARTCOINUSDT.P BINANCE:ZECUSDT

BLOOD BATH IN BITCOIN Bitcoin is going to crash within 1/2 days only if sustains below 106,400 USD. We can plan for sell side after closing below the level. CRYPTO:BTCUSD . Mark the level and simple wait for the confirmation.

BTC - S & R levels. Buy some long qty now at support nowBTC is at support and profit booking and weak hands giving up qty. I have not see any big players stopped accumulation..... price is at good or reasonable buy levels for atleast one to 3 months i expect price to see new ATH again. few groups booking profits at every new ATH for buying back at support and safer levels.... Buy now for good investments with atleast 2 weeks to 2 months time period for great profits or else book profits as u wish

BTC SWING PLAY LONGChart Overview and Data
• Asset: BITCOIN/TETHERUS PERPETUAL CONTRACT.
• Time Frame: The chart shows data up to "16 Oct" (likely the date the screenshot was taken). The primary candles visible span from approximately June to October of the current year, with the x-axis extending into 2026, suggesting a daily (1D) or weekly (WEEK) candlestick view, though the top-left corner indicates "1D - WEEK", which might mean the current view is Daily (1D) within a larger Weekly (WEEK) analysis context.
• Price: The current price is approximately $107,705.3, and the asset is down $3,007.6 (-2.72%) for the period shown.
• Trading Action: There are prominent SELL and BUY buttons at the top left, with current bid/ask prices of $107,691.3 (SELL) and $107,691.4 (BUY).
Technical Analysis Elements
Candlestick Pattern
• The chart uses candlesticks to represent price action over time.
• The recent price action (around August to October) shows a period of consolidation or a slight uptrend that has recently seen a significant drop, as indicated by the large red candlestick currently forming (the one far to the right).
Indicators and Lines
• Moving Averages: Several moving average lines (blue and purple, and possibly a thinner red line) are overlaid on the candlesticks, typically used to identify trend direction.
• Support and Resistance:
• Support Zones (Red Boxes/Lines): Several horizontal red lines and a large red-shaded area beneath the current price action indicate potential support levels where traders expect buying interest to emerge. Key price points marked by red lines are around $106,973, $103,204, $101,297, and the "Low" at $98,125.2. Further support is indicated by the lowest red line at $89,076.1.
• Resistance/Target Zone (Yellow/Green Box): A prominent yellow horizontal line at $126,220.2 (labeled "High") acts as a significant resistance level or a potential upside target. The large green-shaded area above the current price, extending up to $161,047.0, appears to represent a profit target or a long-term trading objective for a potential long position.
Trade Setup Indication
• The chart appears to be illustrating a potential short trade setup, or a breakdown scenario, given:
• The large red-shaded area below the current price, which could be a projected target zone for a short position.
• The significant price drop in the last candle, breaking below recent support.
• Small arrows and boxes near the consolidation area (around July/August) also suggest previous or ongoing trade indications.
Axis and Additional Information
• Y-Axis: Represents the price of BTCUSDT, ranging from approximately $84,800 up to $161,047.
• X-Axis: Represents time, spanning from approximately July to April 2026.
• Volume: A smaller chart pane at the bottom shows volume data, represented by red and green vertical bars, which helps gauge the strength behind price movements.

BTC/UsDT Short sideHere is a description of the downside scenario as depicted:
1. The Short Entry Point: The short trade is set up to begin at the approximate current price level, which is around $122,000 to $123,000. This suggests a trader is anticipating that the current strong bullish move has reached its peak and a reversal is imminent.
2. The Stop-Loss (Risk):
• The top boundary of the red box, which extends into the red area above the entry, represents the stop-loss level.
• This red area is relatively small compared to the profit target, suggesting a favorable Risk/Reward ratio.
• The stop-loss price appears to be around $126,864.5 (the highest point in the image is $126,864.5). If the price moves above this level, the trade would be closed for a manageable loss.
3. The Take-Profit (Reward/Target):
• The lower boundary of the red box, which extends significantly downwards, represents the take-profit or target area for the short trade.
• The profit target line appears to be around the $108,500 to $108,800 level, which is a key low from late September.
• This is where the trader would expect to close the trade for a profit if the anticipated downside move materializes.
4. The Context: The "downside chart" fundamentally represents a trade where the trader is betting on a significant price decline back toward the prior support levels after the large recent rally.
In summary, the downside chart (the red box) illustrates a hypothetical short position where a trader is risking a small amount of profit from the recent rally to potentially capture a much larger drop in price, targeting the strong support zone established just before the recent V-shaped recovery.
The term "downside chart" in this context refers to the short trade setup that has been drawn on the chart, which is visualized using the large red shaded box.
This setup represents a trader's prediction that the price of BTCUSDT will reverse and fall significantly from its current high.
Here is the breakdown of the downside trade setup:
• Entry Point (Current Price): The trade is initiated for a short position (selling) near the current market price, which is around $122,379.1. This is the belief that the recent powerful rally is exhausted and a reversal is starting.
• Stop-Loss (Risk): The area above the entry point, colored in the brighter red on the chart, represents the Stop-Loss level.
• The stop-loss price appears to be around $126,864.5 (the high shown in the top right).
• This is the level where the trade would be automatically closed to limit the loss if the price continues to rise against the short position.
• Take-Profit (Reward/Target): The large green shaded area below the entry represents the Take-Profit or profit target for the short trade.
• The target price is set significantly lower, near the prior support/lows from late September, likely around the $108,500 to $108,800 range.
• This is where the trader expects to close the short position to realize a profit.
• Risk/Reward Ratio (R:R): By comparing the distance from the entry to the stop-loss (the risk, in red) versus the distance from the entry to the take-profit (the reward, in green), the trade demonstrates a favorable Risk/Reward ratio. The reward (green box) is visually much larger than the risk (top red portion), suggesting the trader is attempting to risk a small amount to potentially gain a large profit.
In summary, the downside chart is the visual representation of a bearish trading strategy, expecting a move down from over $122k to the support area near $108k.

BTCUSD – Short-term Down Channel...BTCUSD – Short-term Down Channel, Accumulation Before a Potential Rally
Hello traders,
On the H4 timeframe, BTC is currently moving within a short-term descending channel. After touching a strong support level, selling pressure has started to weaken. However, the 107.4k zone has not yet been retested, and it is quite likely that price will revisit this area once more.
Technical View
During the past week, BTC traded in a very “technical” manner – with clear ranges, precise reversal points, and a consistent descending channel structure.
Key Support: around 107.4k, aligning with the Long Entry Zone.
Short-term Resistance: 110k – 111k, where price tends to react during recovery moves.
Fundamental View
From a fundamental perspective, there are not many factors suggesting that BTC will continue a deeper decline. Moreover, historical data shows that October is often a period when BTC and the broader crypto market tend to recover. This strengthens the probability of a strong rebound once support has been fully tested.
Trading Scenarios
Short towards support
Entry: 110.3k
SL: 110.8k
TP: 109k – 107.6k
Long at strong support
Entry: 107.4k
SL: 106.8k
TP: If price reacts strongly: hold the position, move SL to breakeven, and target higher levels in line with the broader uptrend.
If price reaction is weak: book profits around 109k for a short-term gain.
Conclusion
Short-term: priority remains to look for short opportunities around 110.3k back towards support.
Medium-term: plan to go long near 107.4k to capture the expected rebound, with the view that BTC could re-enter a bullish phase in October.
Risk Management
Always respect stop-loss levels, especially for long positions at support, as this is the key level that will decide BTC’s next direction.
This is my personal outlook on BTC for the weekend. Use it as a reference and adapt it to your own trading system.
👉 Follow me for shared scenarios and the quickest updates whenever price structure changes.

BTC Neowave UpdateBTC Intraday Update
Our entry 1 is activated yesterday, so maintain that with stoploss
2nd entry will be created when.....s1 will complete by breaking up of black cycles
Short Term Trend
Learn More about trend here

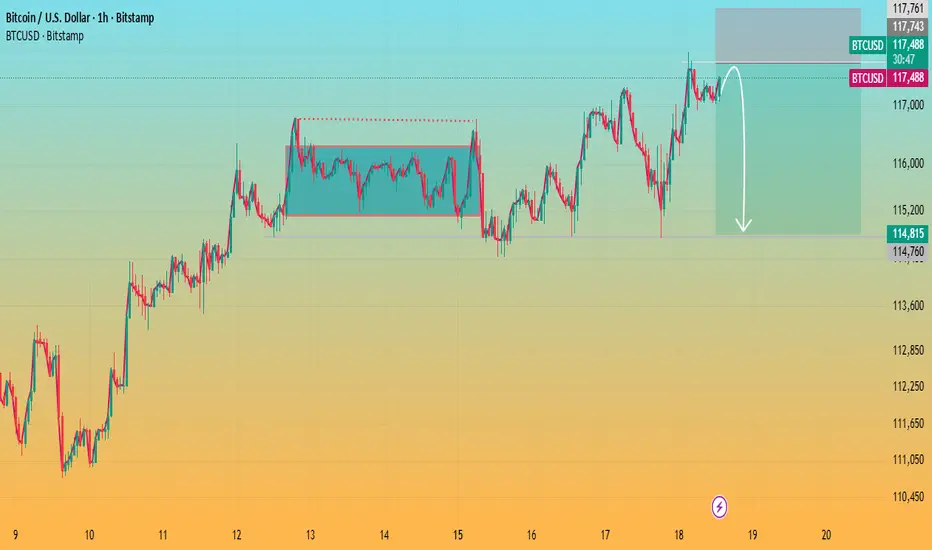
Bitcoin Testing Resistance with Potential Pullback AheadKey observations:
Range Breakout: Earlier, Bitcoin broke out of a consolidation zone (marked box), which triggered the recent upward move.
Resistance Zone: Price is hovering near the 5.15%–5.42% gain zone, where selling pressure has historically emerged.
Pullback Signal: The drawn arrow suggests a possible rejection at this resistance, pointing to a corrective move down toward the 3% zone.
Momentum Check: If BTC fails to hold above this resistance, a retracement is likely. However, a strong breakout could open the door toward 6% gains.
📌 Conclusion:
Bitcoin is at a decision point. Rejection at resistance could bring a pullback toward 2.8%–3.0%, while a breakout above 5.4% would continue the bullish momentum.
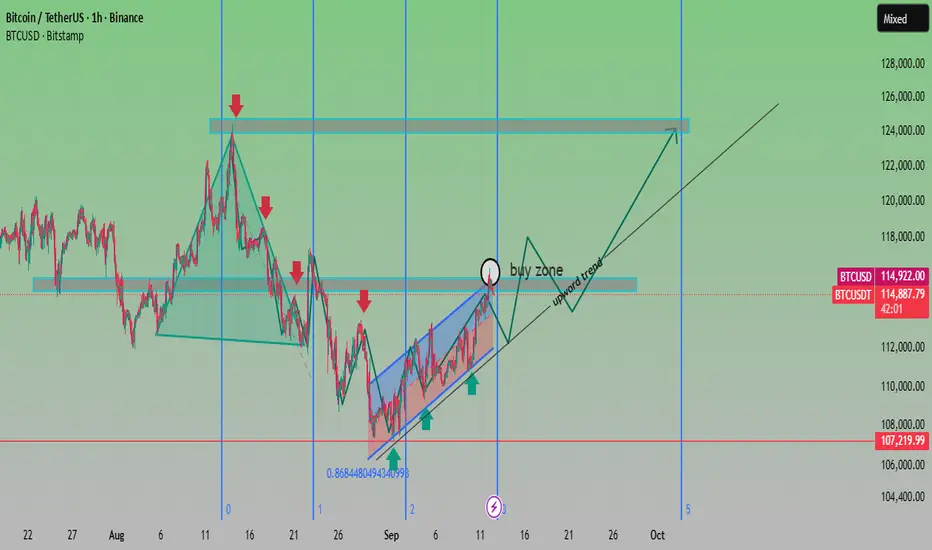
BTC Buy Zone Forming – Potential Bullish Breakout AheadAnalysis:
Trend Structure: After a corrective decline from the $124K resistance area, BTC has rebounded strongly, forming a rising channel (highlighted in blue).
Support Levels: Strong demand observed near $107,200, aligning with the 0.868 Fibonacci retracement, making it a crucial support zone.
Buy Zone: Chart highlights the $114K–$116K range as a buy zone before continuation of the upward trend.
Resistance Levels: Key resistance remains around $124K–$126K, which is the next major target if the bullish momentum sustains.
Outlook: As long as BTC stays above $114K support, the bias remains bullish, with a potential rally towards $120K–$124K. A breakdown below $112K would invalidate the bullish scenario.
✅ Bias: Bullish continuation
🎯 Targets: $120,000 → $124,000
🛑 Invalidation: Break below $112,000
BTC - LONGBitcoin has broken above the 200 EMA, confirming bullish bias.Price is supported by the 10 & 20 EMA crossover (short-term bullish trend). As long as BTC holds above $115,000, upside targets are $117,600 and then $120,000. If it loses $115,000, caution — the bullish setup may fail.

Bitcoin – Trend Update Ahead of PPIBitcoin – Trend Update Ahead of PPI
Hello Traders,
The current scenario for Bitcoin is unfolding in line with expectations, with the uptrend continuing to develop strongly. Price waves are moving with solid volume, and the overall structure is progressing exactly as anticipated.
Key Levels
Price has broken through the 113k zone, confirming that the bullish trend is intact. This move increases the likelihood of completing the final wave of the inverse head-and-shoulders pattern.
The next level to watch is around 116k, where a mild reaction or pullback may occur before the trend resumes higher towards the 121k region.
Special attention should be given to the 117k level, as this marks the potential completion of the inverse head-and-shoulders structure. At this point, price may consolidate before establishing a new primary trend.
Trading View
For now, it remains important to follow the prevailing uptrend. Any shift in price structure will require re-evaluation, and updated strategies should be applied only after clear confirmation.
This is my latest outlook on Bitcoin ahead of the PPI release. I hope this perspective proves useful in shaping your trading approach.

Bitcoin – Current Trend UpdateBitcoin – Current Trend Update
Hello Traders,
Bitcoin continues to follow the structure of an inverse head-and-shoulders pattern, which has not yet been invalidated. After testing the 113.5k zone, price once again reacted lower – this marks the third rejection at this level, confirming it as a key resistance area. For BTC to sustain its bullish momentum and complete the final wave of the formation, this zone will be crucial.
Scenarios to Watch
Bullish Case: The uptrend remains intact as long as price holds above 109k. In this case, buying opportunities are still valid.
Bearish Case: A sustained close below 109k would invalidate the bullish outlook and activate a bearish scenario. Traders should wait for confirmation before committing to shorts.
Short-Term View
On the lower timeframes, BTC is moving within a sideways range. For intraday traders, range strategies such as buying near support and selling near resistance can still be applied until a clear breakout occurs.
Market Sentiment
At the moment, most of the market’s attention is shifting towards gold, leaving Bitcoin with relatively lower momentum. This may keep BTC trading in a tighter range, so traders should lower expectations for strong volatility in the immediate term.
This is my trading outlook for today. Use it as a reference and feel free to share your own perspectives in the comments.

Bitcoin – Short-Term Trend ScenarioBitcoin – Short-Term Trend Scenario
Hello Traders,
Bitcoin is maintaining a bullish tone in the short term while still moving within a corrective structure on the medium-term horizon.
Chart Patterns
On the chart, a double-bottom formation has already completed and confirmed.
In a broader view, the market appears to be progressing towards a potential inverse head-and-shoulders pattern, with the current wave contributing to its completion. This structure would be confirmed if price retests the 117k zone.
Elliott Wave Outlook
From an Elliott Wave perspective, the current structure suggests that wave C has not yet been completed, leaving room for further upside.
MACD & Volume
MACD signals, along with trading volumes holding above average, continue to support the buying side, strengthening the bullish bias.
Trading Strategy
Long positions remain the preferred approach.
The 111k level stands out as a favourable intraday buying zone today, with higher probability of success if price pulls deeper into the rising trendline.
Conclusion
Technical signals collectively favour the bullish case for BTC in the short term. Monitoring reactions at the 111k zone and along the trendline will be essential for optimising entries. This is my perspective on the current market – feel free to share your own views in the comments.

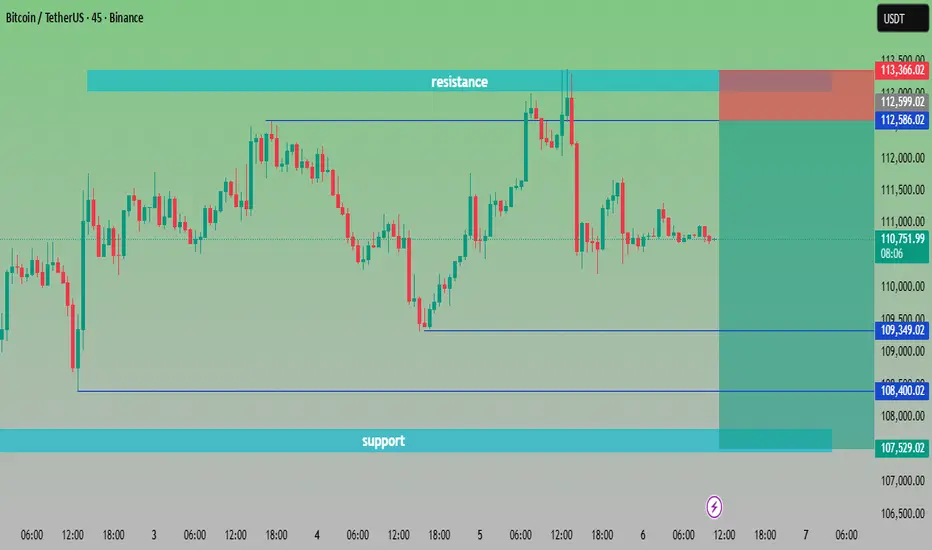
“BTC/USDT at Crossroads | Key Levels to Watch🔎 Chart Analysis – BTC/USDT (45m)
Resistance Zone: Around 112,586 – 113,200 USDT. Price has tested this area multiple times but failed to break out, confirming strong selling pressure.
Support Zone: Around 107,529 – 108,400 USDT. Buyers have consistently defended this zone, making it a key demand area.
Current Price: 110,720 USDT, sitting in the middle of support and resistance.
📌 Scenarios:
Bullish Case 🟢🚀 – If BTC breaks above 112,586 USDT, momentum could push toward 113,500+ USDT.
Bearish Case 🔴📉 – If BTC fails to hold 109,349 USDT, price may retest the deeper support around 107,500 USDT.
⚖️ Trading Plan Idea:
Long Entry: Above 112,600 breakout ✅
Short Entry: Below 109,300 breakdown ❌
Target Zones:
Upside 🎯 → 113,500+
Downside 🎯 → 107,500
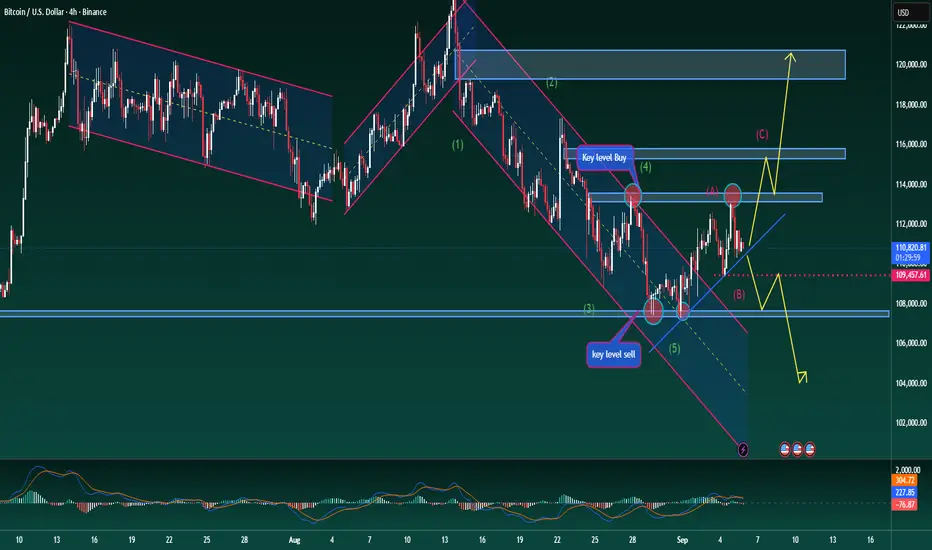
Bitcoin – H4 Mid-Term AnalysisBitcoin – H4 Mid-Term Analysis
Hello Traders,
Bitcoin continues to trade within a wide sideways range. Despite the spike in volume following the recent NFP release, the market has not yet confirmed a dominant trend. Price action is still rotating within the 107k – 113k zone.
Elliott Wave Perspective
Wave 5 appears to have completed, and an A–B corrective structure is taking shape. This opens the possibility for one more upward leg before the next decisive move develops.
Trendline & Key Levels
A descending trendline is currently acting as resistance. It may offer early short opportunities, though a clear break below 107k is required to confirm a mid-term bearish outlook.
On the flip side, if price respects the trendline and bounces higher, a wave C rally could unfold.
Importantly, BTC is still holding above the rising channel, suggesting that bearish momentum remains limited for now.
Scenarios to Watch
Bullish Case:
If Bitcoin sustains above 107k and manages a breakout above 113k, momentum could extend towards 115k – 118k. Long positions can be considered once confirmation comes from stronger volume or a MACD crossover.
Bearish Case:
Failure to hold above 107k would expose the market to further downside, targeting 104k – 101k where strong historical support is located.
Professional Take
The market remains indecisive in the mid-term, with no clear directional bias yet. Traders should closely watch the reaction at 107k and the descending trendline to determine the next move. Flexibility and strict risk management are essential in this phase of heightened volatility.
BTC/USD Bullish Order Block Setup – Targeting 114,328BTC/USD (1H) Analysis
Trend & Structure: Price has been respecting a rising channel with clear support and rejection lines. After testing the support line, it rebounded and is now consolidating.
EMA Strategy: Price is fluctuating around the 70 EMA (111,081) and 200 EMA (110,902), showing short-term consolidation. A bullish crossover above 70 EMA may confirm further upside momentum.
Order Block (OB) Zone: The marked OB Buying Zone (109,261 – 110,252) is a strong demand area where buyers are expected to step in.
Support & Resistance: Support lies at 109,261, while the next resistance/target is 114,328.
Risk-Reward Strategy: A potential long entry from the OB zone offers a favorable R:R ratio toward the 114,328 target point. Stop loss ideally below 109,246.
Price Action: Recent wicks suggest rejection of lower levels, strengthening the bullish bias.
✅ Signal: Buy from OB Buying Zone (109,261 – 110,252)
🎯 Target: 114,328
🛑 Stop Loss: Below 109,246
Overall Bias: Bullish continuation if price respects the OB buying zone and EMA support.

BTC/USD – FVG Buy Zone Setup Targeting $113K🔎 Chart Overview (BTC/USD 30m)
Price is currently trading at $110,517.
EMA 70 (111,276) above price → short-term bearish.
EMA 200 (110,598) acting as immediate support zone.
📐 Trend & Channel Strategy
Market is moving inside an ascending channel (support & projection line).
Price recently retraced to the support line → potential bullish continuation.
🎯 Supply & Demand / FVG Strategy
FVG Buying Zone: $109,583 – $110,217 highlighted (strong demand zone).
Entry around this zone expected to trigger a bullish reaction.
📊 EMA Crossover Strategy
EMA70 > EMA200 previously → bullish structure.
Current retest of EMA200 is key → holding above signals continuation to upside.
💎 Price Action Strategy
After strong drop, price tapped into support + FVG zone.
Wick rejection suggests buyers stepping in.
🎯 Target & Risk Management
Target Point: $113,053 – $113,064.
Stop Loss: Below $109,583 (to protect against breakdown).
Risk/Reward ratio looks favorable (approx. 1:3).
✅ Conclusion:
BTC is in an uptrend channel. After retesting the FVG buying zone & EMA200, buyers are likely to push price back toward $113,000 target 🚀📈. A break below $109,583 would invalidate this bullish setup.

Bitcoin – Bearish Scenario Moving as PlannedBitcoin – Bearish Scenario Moving as Planned
Hello traders,
BTC is moving exactly in line with the plan, reacting well within the channel and showing a pullback at the retest of the rising trend. Hopefully many of you managed to catch the short signal shared earlier.
Following the current momentum, BTC is holding well on the downside. The short position can be maintained in the medium term, with the next long zone expected around 105k.
On higher timeframes, BTC still remains in a broader bullish structure, with potential for higher targets from long-term buy zones. However, current market sentiment shows much of the liquidity flowing into gold, so BTC may move more slowly in the short run.
This is my next trading outlook for BTC. Take it as reference, stay patient, and manage your trades with discipline. Do share your views in the comments.

BTC LONG AND HAVING SUPPORT OVER THE CHANNEL Chart Overview
• Pair/Timeframe: BTC/USDT – 4H
• Exchange: Bitget
• Pattern: Breakout from a falling wedge / descending channel, shifting momentum bullish.
• Indicators:
• EMA 9 (yellow) and EMA 20 (blue) are crossing bullishly.
• Volume spike supports the breakout.
⸻
Price Action
• BTC broke out of the descending trendline (blue) and retested support before moving higher.
• Currently trading at 110,780 USDT (+1.46%).
• Strong bullish momentum is visible with higher lows forming since Aug 31.
⸻
Trade Setup
• Entry: Around breakout zone (near 110,000 – 110,500).
• Stop Loss (SL): Below 108,500 zone (highlighted red zone).
• Targets:
• TP1: 114,658 USDT
• TP2: 115,980 USDT
⸻
Key Levels
• Immediate Support: 109,383 – 108,534
• Major Support Zone: 107,200 – 107,386
• Immediate Resistance: 111,998 – 113,217
• Target Resistance: 114,658 (TP1) and 115,980 (TP2)
• High Reference: 117,340 – 117,345
⸻
✅ Summary: BTC has broken out of a falling wedge on the 4H chart with strong bullish confirmation. If price sustains above 110k, it could move toward 114.6k (TP1) and 116k (TP2). Losing 108.5k support would invalidate this bullish setup.

Bitcoin – Trading Plan Update Bitcoin – Trading Plan Update
Hello traders,
The BTC scenario has played out well, with price reacting strongly at 110.4k and bouncing higher. This level has cleared much of the short-side liquidity, while the H4 candle could not close below the 111.8k support. As a result, long entries around 110k can still be expected to target higher levels, at least towards 115.5k.
The primary focus remains on the long side as long as price does not confirm a sustained bearish move. Long positions will remain valid until price breaks decisively below 110k.
For traders who already closed longs or missed the earlier entry, wait for a retest of the FVG zone near 111.5k. If price reacts higher, fresh longs around 113k can be considered.
Short-term selling opportunities may also appear near 115.5k and 117.2k, where price could face resistance.
My BTC strategies are still aligning well with current price action. That said, this is my personal outlook based on my trading method. Please trade responsibly, stick to your own plan, and manage risk carefully.
What’s your view on BTC right now? Share your thoughts in the comments below.
BTC/USD Bearish Retest Setup – Eye on 106.6K TargetTrend: BTC is in a downtrend channel (rejection line above, support line below).
EMA Signals: Price is trading below EMA 70 & EMA 200 → bearish bias remains strong.
Supply & Demand:
Support zone: around 112,000 – 112,500 (price just bounced).
RBR Supply zone: 114,300 – 116,000 where sellers are likely waiting.
📊 Strategies in play
Support–Resistance: Bounce at support, retest expected at supply zone.
EMA Strategy: Bearish since candles trade under 200 EMA.
Break & Retest: Price could retest supply before resuming drop.
Target Projection: If rejection at supply holds, target = 106,600 zone (chart target point).
⚖️ Risks
A clean break above 116,000 would invalidate bearish setup and open room for reversal.
Range trading possible between 112k–116k before breakout.
✅ Summary: BTC short-term bias remains bearish. Expect retest of 114.3k–116k supply before continuation lower toward 106.6k target. Only a strong breakout above 116k flips the trend bullish.

Bitcoin – Medium-Term OutlookBitcoin – Medium-Term Outlook
Hello traders,
BTC recently made a strong breakout move, reacting precisely at the 117k level as expected. Currently, price is in a corrective phase, clearing the liquidity from last Friday’s bullish candle. The sharp rejection at 117k suggests we need to reassess the medium-term outlook.
The primary scenario remains bullish. The 113.4k zone is a key area to look for long entries, as buyers dominated this level earlier and liquidity from short traders still sits here. From a psychological perspective, we could see shorts exiting the market, fuelling a rally towards 115.7k. A confirmed break above 117k would strengthen the long-term bullish trend, opening the door for further long opportunities.
On the flip side, a reaction lower from 115.7k could present a short entry for the medium term. If support at 111.7k breaks, BTC may extend down to 110k, where strong historical rejections suggest a solid zone for fresh long positions in both medium and long-term outlooks.
This outlook is based on key support/resistance levels and major liquidity zones. Always trade with discipline and manage risk carefully to protect your account.
What’s your view on BTC here? Share your thoughts in the comments so we can trade smarter together.
