Bitcoin CME gap not filled. Simple chart showing Gap Simple chart showing what remains of that CME gap and local lines of resistance above that may return BTC PA into the Gap zone.
BTC can often make a push higher on a Friday night, lining up for the weekend.
We have to wait and see what happens
Btcusdanalysis

Bitcoin IN CME Gap after Fib circle encounter - what now ?
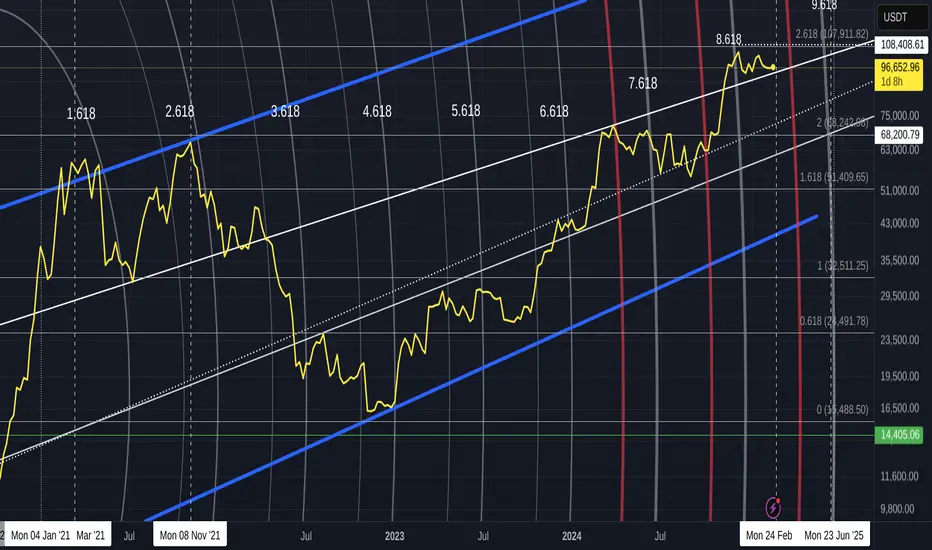
As mentioned in a previous post, PA got "hit" by the same Fib circle that rejected the 2021 Cycle ATH - the difference being that PA got THROUGH the Fib circle Before turning down and so now, we slide down the outside, in a position of strength to be able to move higher when wanted.
As can be seen on the Daily chart below
This has also brought PA into the CME Gap as expected
Currently, PA is recovering having filled only HALF the gap.
I fully expect PA to return and complete the fill at some point.
Also note the rising line of support that we are heading towards. If we carry on like this, we intersect with it on 3rd March, Next Wednesday at a price around 77400
We will have to wait and see what happens there but this is also where the 50 week SMA will be and so, as said previously, I am expecting PA to bounce strongly
But this is Bitcoin....We have to wait and see what happens and react accordingly.
A Drop Lower would take us out of the Mid 20% Drops we have been having this cycle as can be seen on main chart.
The Next line of rising support on this chart is around -40% and is around the 100 week SMA
I am not to sure we will go there..... But.................

Now It's Time to Pump the bitcoin.Bitcoin exactly touch the lower trendline and pumping back. It might pump back from this and very soon touch back 1,00,000 dollar milestone.

Bitcoin PA to Fill CME Gap UPDATE - Extraordinary GamesLet me explain - A CME gap, or Bitcoin CME gap, is the difference between the trading price of Bitcoin futures contracts when the market closes on Friday and reopens on Sunday. This gap occurs because the Chicago Mercantile Exchange (CME) is closed over the weekend while Bitcoin's spot market remains open, leading to price movements that are not reflected in the futures market until it reopens.
CME is old School Traditional Finance that uses Bitcoin. In fact, CME Group first started Bitcoin futures trading on December 18, 2017.
This was Way back when TradFi was putting Bitcoin down as a "Ponzi Scheme" and not many people had even heard of it.
And through its history, the CME Bitcoin Futures has often created Gaps for the reasons above. And these Gas ALWAYS Get filled. At Times, Rapidly as PA seems to bizarrely retreat to the Gap, Fill it and bounce back rapidly.
This can all be seen VERY clearly on the BTC1! ticker in TradingView. Go back through its history, you will see what I mean.
The Current Gap is, however, being fought over Very Hard by Bulls and Bears.
The CME Gap chart above shows you How Bulls have pulled the PA Back up just above the Gap.
Teasing the CME Bears
In my mind, I can see the Two Teams, New Age Finance wearing BITCOIN T-Shirts and the TradFi crew, wearing the "CME Gaps always get filled because we are Kings" T Shirts
The Daily chart shows us how the 200 day SMA acted as support just above the Gap
And the Weekly chart shows us how that 50 SMA ( red) just just out of reach on the other side of the Gap.
If we look at the Range from March - Sep 2024, we can see similar patterns.
The 2 rounded Tops , the slide down to a low.
We are currently seeing a bounce back, off the TOP of the CME Gap....PA can smell that gap, the Gap can smell BTC PA, just cannot touch it
This bounce may or may not reach the mid 90K before turning down again but it will turn down again, I am sure of that. PA is not ready to reach for New ATH
But See that Long wick down in summer 2024 ? This is what may happen to fill the Gap.
Ultimate though, We are waiting for the Weekly MACD to reach Neutral. THIS is what gives PA strength to reach higher, to a new ATH.
The CME would like that Gap filled BEFORE PA pushes up and out of Range
Because of this sharp drop in price recently, and if it continues, MACD could reach neutral by End of April ! and not June as previously
But to sustain this angle of decrease, PA would have to go as low as 55K, reaching the Long Term rising support ( Dotted line of the weekly chart. This is also where the 100 SMA ( Blue) Sits
I do not think that will happen but if PA Drops below 70K, I will begin to reevaluate my positions.
So, I expect Pa to bounce around for a while, as in the previous Range in 2024
For now, we see the Bulls and Bears Teasing each other over this CME Gap.
Who will win this battle. Will the BTC Bulls submit and allow the gap to be filled ?
I hope so, I have a buy order at 78200 ;-)
It maybe one of the last chances to buy BTC that cheap
Exciting days ahead
COME ON BTC BULLS>...

Bitcoin Daily just landed on the 200 SMA - what now ?Many people are expecting Bitcoin to Bounce off the 200 day SMA ( yellow & Arrowed)
But I just want to point out what happened last time we tanged for a long time.
We did NOT bounce of it untill PA was ready to
In fact, er fell below numerous times.
So, SORRY, don;t get your hopes up BUT we can watch and react.......
It may bounce but I doubt for long.....
Time will tell

BITCOIN TESTING $87K - FALSE OR TRUE BREAKDOWN?Symbol - BTCUSD
CMP 87100
BTCUSD has entered a risk zone, exhibiting a breakdown of the key support level. The market's attention is now on the bulls and their ability to maintain their defense. On the daily and weekly timeframes, the price is in a phase of global consolidation following a period of significant upward movement. The focus remains on the $90-91K range, a strong support area that aligns with the broader trend. Currently, a breakdown of support appears to be unfolding.
On the local timeframes (H1 - H4), the price is testing the support of the local channel, as well as the risk zone at 87,000. If the bulls are able to sustain their defense above 86,400 level, Bitcoin could potentially strengthen. In this scenario, the primary target would be $91-92K
Key support levels: 86,400, 85,530
Key resistance levels: 89,400, 91,600
Historically, the most significant price movements tend to occur after a false breakdown. However, the critical factor here is whether the breakout is genuine or false. In this case, confirmation is required — specifically, price consolidation above the key zones and levels.
Regarding my previous BTCUSD analysis, I had projected a decline to the $90K risk zone while Bitcoin was trading around $96-97K at that time. After some consolidation, the analysis proved accurate as Bitcoin dropped to the $90K range.
I believe this recent sell-off has disrupted the previous bullish structure, and a bearish structure is now beginning to take shape. I expect a retracement to the $91-92K range before the downtrend continues.

Is Bitcoins Range Box maybe hiding a bearish secret ? CAUTION ?
I have been talking about his range box that PA is in for a while and, at the same time, referenceing the previous 2 times PA has done this this Cycle.
But I also pointed out recently how this range is slightly different and possibly in a bearish way..
And I just found this on a 4 hour chart, which if true, could point towards PA taking a sudden drop to bottom of Range or Lower.
As you can see, PA has ranged across and just got rejected off the Upper trendline of a descending channel. The Fib Retracements levels seem to offer support
There is a vertical line on 1st April to give you a marlker to work on as main chart is a daily and this chart is 4 hour.
PA could continue to range horizontalyt till around 3rd March before hitting trend line again.
If PA tries to break out, it will hit it earlier.
In my head, I always have that Still open CME Gap at 77K - 82K
This is a perfect opportunity to buy Bitcoin at a discount if we get down there.
I do have an open SPOT BUY order at 78600 just in case. I would not expect PA to remain down there for very long, so I have placed my order above what I consider to be the possible Low.
None of this may happen BUT I find it prudent to be aware of all possibilities.

Bitcoin exactly dumping as I predict earlier.Bitcoin is exactly following the dump path as i predict before. Bitcoin might fall to 70,000 support very soon.

BTC 90K support Zone is weakAfter multiple retests, 90k-92k support has become too weak and can break on another strong dump. I hope it is quite obvious from the chart prohjected

Simple reasons for and against a Bitcoin push in near futureThere are so many people coming out with so many idaes about why Bitcoin should reach for New ATH's in March and, to some degree, it is possible though I am not to sure it would be a good idea now. Something will happen in March though, I am sure ogf that, just not to sure what.
For me, I like to keep things fairly simple. It has worked for me for many years.
So, Lets be simple about this and Look at some basic things
First of All, The Dreaded Hack yesterday that took the market into shock - Many ALTS Bled and are Still in shock.
Bitcoin took it in its stride and fell by -4.7% - It was Less than many a normal days pull back ! And today, we are Green. This shows MASSIVE under laying strength. The Support Structure of Bitcoin is Huge.
So, the the chart.
Reasons for a Push higher.
The Strength PA has, as just mentioned, is an obvious example of a simple reason to expect a push higher.The Daily MACD is Way down low, pretty well oversold and just ranging there, waiting....
But one thing I want to point out is the trend line that PA is running up. This is the trend line, with origins back 2017, that catapulted PA to the final 2021 ATH. It is strong support, that eventualy broke as the bear market cracked its whip, in 2022. But not before it support PA on two more occasions.
So, Can it do it again ?
PA does not need to react till we begin getting close to that Apex of the triangle we are now in, Which is in JUNE, But with the daily MACD Low and MACRO acceptance of Bitcoin and Trumps push to welcome Crypto, things may advance Quicker. PA certainly has the ability to move higher in the near future
The down side of that is simply, PA would run out of "steam"
Which brings me to why we may not see a push till JUNE and even then, that may just be the initial stage of the final push to cycle ATH. ( which I have said many times previously, is likely to be in Q4, maybe Early Q4 )
Look at this WEEKLY MACD chart
See where that projected line comes down to the Neutral zone...The date of intersection..JUNE
The last time weekly MACD was up here, as you can see, It fell in a very controlled manner and the angle of descent is the same as this projected line.
That happened while BTC PA Ranged across for 6 months
So, there it is, Nice and simple.
JUNE is the best time, or just before, for PA t make a move but it may try some Dances in the time till then
It can continue Ranging across in the Price range of 109K to 91K till then, Still making people money and keeping the world happy.
We can dive Deeper into all kinds of data, onchain etc, get all techie and confound people with new words...but end of the day, Bitcoin will still do the same thing as it always does.
MACD trading is a Latent method, as MACD shows you data after the event.....but it shows Trends.VERY WELL
My money is on the trend Range we are currently in, ending in around End of May to June.
This will lead to a series of New ATH's over 109K, all the way up to Cycle ATH in Q4
What happens than, That is going to be interesting to see.......but thats another story
Stay safe
BTC#14: Bitcoin Is Resurgent? Bulls Are Back or Just a Scam?💎 💎 💎 As analyzed in the previous article, BTC tested the trendline and then turned down. However, the price did not fall too much and we saw a recovery. Let's plan BINANCE:BTCUSDT the next trade 💎 💎 💎
1️⃣ **Fundamental analysis:**
📊 The US dollar index DXY is up more than 0.50% on the day and is currently at 108.40; US regulators are piloting tokenization, using stablecoins as collateral.
🔹The Texas Bitcoin Reserve Act has been submitted to the Senate Finance Committee for consideration;
🔹US Senator from Florida proposes Bitcoin investment bill.
🔹 New bill in Montana, USA allows investment of up to $50 million in Bitcoin;
🚀 Standard Chartered Bank: Bitcoin expected to break record high as US Treasury market environment is favorable for digital assets.
📌 Overall policy implications for Bitcoin have restored optimism to the market.
2️⃣ **Technical analysis:**
🔹 **D Frame**: A green pinbar appeared at the end of the week, bringing positive signals to the market. The current price line is also supportive as the price breaks above the candle wick top.
🔹 **H4 frame**: Although the downtrend has not been broken, the 96K area is still acting as an important support zone. 2 pinbars are a clear sign that we will see a recovery for BINANCE:BTCUSD
🔹 **H1 frame**: The temporary downtrend price structure has been broken. However, the resistance zone of 98k - 100k is also very close.
3️⃣ **Trading plan:*
⛔ The current SW zone has been maintained for quite a long time. We will need to wait for clarity on the price line because the downtrend price structure in the H4 frame has not been broken yet
✅ Currently, looking at the positive price reaction for this area, the market is leaning more towards the bulls. However, establishing a BUY position at this time is riskier. We can wait for the price structure as on the H1 chart to choose a position.
💪 **Good luck trading!**

Bitcoin Technical Analysis - Monthly#Elliottwave analysis for #Bitcoin ( CRYPTOCAP:BTC ) provides a framework to understand potential price movements based on past patterns. However, given the #Crypto market's unique characteristics, it should be used in conjunction with other analytical tools. The current analyses suggests optimism for continued growth, but with caution for potential corrections or consolidations before reaching new highs.
Hear is a Char for your reference

Bitcoin Weekly Analysis & Market Maker StrategyBitcoin Weekly Analysis & Market Maker Strategy
Bitcoin has officially entered the declining phase of the W-cycle. As of now, this downtrend has been in play for seven weeks. However, even within a downtrend, the market does not move in a straight line—there are always liquidity grabs and retracement rallies before the next leg down. These temporary upside corrections are where market makers execute their moves.
Key Price Levels to Watch
Current retracement zones within this descending structure are projected at $100K, $105K, and $102K, with additional lower adjustment levels expected in the future.
This means that Bitcoin is not ready for a sustained uptrend yet. Structurally, BTC needs time to consolidate, accumulate liquidity, and shake out weak hands before the next bullish leg of the W-cycle. This process is estimated to take 2-3 months before BTC resumes its macro uptrend.
For now, BTC’s operational range is expected to be between FWB:88K - $99K, forming a base before continuation. Lower zones to monitor for potential deeper corrections include $85K and the $70K range.
Market Maker Playbook: Strategic Execution
1️⃣ For Leverage Traders: Shorting the Retracement Peaks
This is not the time to long BTC. Instead, focus on:
✅ Short-selling BTC at liquidity zones where price spikes into new highs on lower time frames (H4, D1).
✅ Combining BTC shorts with bearish Altcoins that are following similar corrective structures.
✅ Being highly tactical—market makers trap retail traders in these fakeouts before the next move.
2️⃣ For Spot Traders: Rotational Plays in Altcoins
For those trading spot:
✅ Use BTC’s D1 corrective phase to accumulate select Altcoins for short-term swing trades.
✅ Target 30%-50% gains, keep risk tight, and exit before liquidity dries up.
✅ Monitor BTC.D (Bitcoin Dominance Index)—once BTC.D tops out and starts declining, rotate into strong Altcoins that are structurally preparing for the 2025 Altcoin supercycle.
3️⃣ Adapting Like a Market Maker
The game is about liquidity, not direction. Let the market come to your zones instead of chasing trades. Position with precision. Execute with conviction. And most importantly—think ahead of the herd.
🔥 Bottom Line: This is a trader’s market, not a holder’s market (yet). Stay sharp, position smartly, and capitalize on market inefficiencies like a true market maker.

BTC in clear down TrendBTC making lower highs and lower lows shows in clear down trend for last few days

BTC#12: Gathering signs from the price line
💎 💎 💎 Is plan #11 helping you make a profit?💎 💎 💎
🔥 As we analyzed the possibilities of BINANCE:BTCUSDT in the previous article, BTC temporarily entered the SW process. And here is the next plan for BINANCE:BTCUSD 🔥
1️⃣ **Fundamental analysis:**
📊 The Trump administration has taken the first step in loosening cryptocurrency regulations. The US SEC plans to reduce the cryptocurrency enforcement team
"eliminate excessive regulations" on digital assets.
🚀US senators from the state of Ohio have proposed a bill to establish a Bitcoin reserve fund and accept it as a form of payment.
📌The US sovereign wealth fund plan is expected to be implemented within 90 days
2️⃣ **Technical analysis:**
🔹 **D frame**: Looking at D frame, we can see that the downtrend is not over yet. If today's price surpasses yesterday's candle wick, we will see a more optimistic market situation.
🔹 **H4 frame**: The bearish price structure is not over yet. Currently, if the support zone of 96~97K is still waiting for evaluation
🔹 **H1 frame**: You can see that the price is close to the trendline. However, we are in a bearish price structure -> Don't rush to decide on this area.
3️⃣ **Trading plan:**
⛔As you can see on the chart, the downtrend has not been broken yet. We still need to wait for confirmation of the 96~97K area by the price structure. Be patient to wait for a better buying position and less risk
✅ Currently, finding a SELL position is in accordance with the price structure, but this price zone is not suitable for establishing a position. You can wait for the price to touch the larger trendline zone and consider the price reaction in that area to establish a position
💪 **Wish you successful trading!**

BTCUSDT TRADING POINT UPDATE >READ THE CHAPTIAN Buddy'S dear friend 👋
SMC Trading Signals Update 🗾🗺️ crypto Traders SMC-Trading Point update you on New technical analysis setup for crypto currency BTC USDT. Crypto traders last time post signals 🚀 hit sucksfully My target 🎯. Now post new analysis setup for crypto BTC USDT still holding it up 💪 trend 📉📈 now if close below and close above technical analysis BTC USDT close below 👇 97k next support strong 🪨💪 level of 89k. Don't close this level pullback up closed above 102k Next target 109. Wait for closing any said it take entry
Key Resistance level 102k + 106k + 109k
Key Support level 97k - 91k 89k
Mr SMC Trading point
Pales support boost 🚀 analysis follow)

BTCUSD - HEADED LOWER?Symbol - BTCUSD
BTCUSD is currently encountering substantial resistance, with the price being significantly repelled from the 105-107K zone, establishing a strong resistance area. However, this resistance does not yet negate the broader bullish outlook in the market. A complex market structure is unfolding, characterized by both a descending channel and a symmetrical triangle pattern. The interpretation of these formations will depend largely on how market participants perceive them. A potential reaction to the support of the symmetrical triangle could result in a brief rebound; however, considering the prevailing resistance levels, it is anticipated that this rebound will be shallow, with the price likely attempting to move lower.
Looking at the descending channel, the price is currently supported by a key level at 1,01,600 which is crucial in preventing further declines. This level will play a decisive role in determining the near-term price action. The primary uncertainty lies in whether this support will hold or be breached.
On a fundamental level, the situation remains uncertain and largely dependent on developments in the United States, particularly regarding how political figures, including former President Trump, address cryptocurrencies. This could manifest in various ways: as a bubble, a strategy to influence elections, or simply as rhetorical posturing. Alternatively, it could reflect a genuine, coherent policy direction.
Resistance levels: 1,03,500 - 1,05,800
Support levels: 1,01,600 - 99,600
The 1,01,600 level remains the focal point. In the short term, a potential breakdown below this level followed by price consolidation could lead to a decline to the 100-97K range. However, given the presence of the symmetrical triangle, a false breakdown of 101.6K could trigger a brief upward bounce before a subsequent decline towards the 100K level.

BTCUSDENTRY TARGET SL Mention in the chart.
ALWAYS TAKE TRADE WITH CONFIRMATION
Note : Trading in any financial market is very risky. I post ideas for educational purpose only. It is not financial advice. Do not hold us responsible for any potential loss you may incur. Please consult your financial adviser before trading.

BTC W and D1 are still in a downward correction phase (82k)BTC W and D1 are still in a downward correction phase before starting a new W cycle.
Bitcoin is experiencing short-term upward movements on D1 and H4, followed by a gradual move toward the $77,000–$82,000 range within the next 1–2 weeks. This correction is essential for shifting from USDT to accumulating BTC and Altcoins.
If you believe Bitcoin will continue its upward move directly from the $97,000 mark, it might indicate a strategic misunderstanding.
Current Strategy:
1. Wait for the next correction phase:
Allow BTC to consolidate, and then start buying again as it begins its new W cycle. (Projected entry: around 4–5 weeks from now).
2. Focus on Altcoins with strong upward structures on W and M:
Buy Altcoins that are in strong uptrends, capitalize on short-term gains during this phase, and exit after the W correction completes to accumulate again.
3. Short-term trades on H4 and D1:
Target quick rotations in Altcoins to maximize fast, short-term profits while waiting for broader market alignment.
Adapting these strategies will help align with the market’s current behavior and ensure optimal returns.

BTCUSD TRADING POINT UPDATE > READ THE CHAPTIANBuddy'S dear friend 👋
SMC Trading Signals Update 🗺🗾 Cryptocurrency Traders SMC-Trading Point update you on BTC USD Trading Signals BTC USD still holding it down trand 107k 3 Time rejected oderbolk ) 105k) rejected again Short Trade now 3H Time Frame 🖼️ target point 99k)
Key resistance level 107k) 109k)
Kye support level 102k) 101k ) 99k)
Mr SMC Trading point
Support💫 My hard analysis Setup like and following me 🤝 that star ✨ game 🎮

Bitcoin Dominance 1D Setup - Bitcoin D is currently trading at 58.26%
- Bitcoin D is going to be the biggest indicator to track when Alts will bounce
- Bitcoin D has changed its market structure and can soon shift its bias to bearish once we see a weekly close below 56.18%
- 90% of altcoins are struggling to make a comeback and stay strong for long as BTC D and Bitcoin is outperforming ETH since quite long
- One thing to notice for all Trader/Investors is going to be ETH/BTC pair, ETH/BTC on a weekly TF has already bottomed out and it has recently reacted strong and at the same time TRUMP's inaugural is tomorrow where we can see that Trump has added ETH worth 5Million $
- Ethereum is going to be the biggest indicator clubbed with ETH/BTC USDT D once these start outperforming and USDT D underperforming ETH will print 50-60% and maybe purge a new high and that will lead to an altcoins rally

BTC futures live analysis for 16 jan 2025BTC futures chart creating head and shoulder pattern & break down is expected.
But Overview will be changed if price breaks & sustain above resistance sharp Upmove will b expected

Bitcoin 1D Commentary and Bull Run Technical Analysis - Bitcoin is currently trading at 99,779$
- Bitcoin kept behaving choppy and the Price Behaviour was very sluggish in January
- We saw BTC printing a candle 4000$, which helped BTC cross 100,000$ after a long time.
- Coming back to the current Price Action of BTC we are currently trading at a crucial zone and if we flip a weekly candle close above 102,686$ then the Market structure will change to Bullish
- However, if we do not close above 102,000$ then we can see BTC revisiting 85,000-90,000$
- Trump's inaugural is due next week and will bring in a lot of volatility.
- I am leaning more on the Bullish side, however, if we don't see supporting Macros then we might have a rough time chopping out and getting distributed the whole month.
