BTCUSD 45-Min Chart — Support Reclaim Setup After Sharp Breakdow
Chart Analysis:
Market Structure:
Clear bearish break from the prior range near 87k resistance, followed by a strong impulsive sell-off → confirms a bearish market shift.
Support Zone (Key Area):
Price is reacting around 80,600–81,000, a marked demand/support zone. This is the first meaningful base after the dump.
Current Price Action:
BTC is testing support after a lower high, suggesting sellers are losing momentum. Wicks into support show buying interest, but confirmation is still needed.
Entry Logic:
The marked entry near 80.6k assumes:
Support holds
A bounce + reclaim of minor structure (above ~82k)
Targets:
TP1: ~83.2k (range midpoint / liquidity)
TP2: ~83.7k (previous consolidation)
Final Target: ~87.1k resistance (major supply zone + breakdown origin)
Bias Summary:
Short-term: Tactical long from support
Invalidation: Clean break and close below 80.6k
Overall trend: Still bearish until 87k is reclaimed
Takeaway:
This is a counter-trend long setup — high reward, but only valid if support holds and momentum flips. Conservative traders should wait for a confirmed reclaim above 82–83k before committing.
Btcusdbuy

BTCUSD 4H –Demand-to-Resistance Reversal Setup (Structured Long)Market Context
BITSTAMP:BTCUSD is currently reacting from a 4H demand zone after a sharp corrective move from the recent swing high. Price has printed a clear liquidity sweep below prior lows and is now attempting a reclaim of short-term structure.
Technical Breakdown
Strong 4H Demand (D) holding near the 88.9k–89.2k region
Clear reaction + displacement from demand, suggesting active buyers
Price is attempting to reclaim the 4H resistance flip zone (R)
EMA ribbon compression followed by early expansion → momentum shift
Structure aligns with a mean reversion → continuation move
Trade Plan (Illustrative)
Entry: On confirmation above 4H resistance / demand retest hold
Invalidation: Below demand zone low
TP1: ~93.4k (first opposing structure / imbalance fill)
TP2: ~97.7k (daily resistance / premium zone)
R:R remains favorable as long as demand holds and structure is respected
Bias
Neutral → Bullish while price holds above demand
Failure to hold demand invalidates the setup and opens downside continuation
Notes
This is a structure + supply/demand based idea, not a prediction
Best confirmation comes from lower timeframe acceptance and volume expansion
News events may increase volatility—manage risk accordingly
📌 This idea is for educational purposes only. Always manage risk and wait for confirmation.

#BTC/USD Buy Trade Scenario.Here’s an up-to-date BTC/USD Buy trade outlook (technical + fundamental) to help you assess whether positioning for a Upside makes sense right now.
Thank You......


BTCUSD Daily Chart – Rising Trendline Holds, Momentum ImprovingPrice Structure
Bitcoin is trading around $95,000, respecting a rising trendline from the December lows.
The market has shifted from a strong downtrend (Nov) into a higher-low / higher-high structure, suggesting a short-term bullish recovery.
Price recently pulled back slightly after testing the $98k–$99k resistance zone, which is acting as near-term supply.
Trend & Support/Resistance
Key Support:
Trendline support: $92k–$93k
Horizontal support: $88k–$90k
Key Resistance:
Immediate: $98k–$99k
Major psychological level: $100k–$107k (next upside zone if breakout occurs)
RSI (14)
RSI is around 61–62, above the neutral 50 level.
This indicates bullish momentum without being overbought yet.
No clear bearish divergence at the moment; momentum remains constructive.
MACD
MACD lines are crossed bullish and flattening slightly.
Histogram remains positive, suggesting upside momentum is still present but losing some acceleration.
AO (Awesome Oscillator)
AO has turned positive (green bars), supporting the bullish continuation bias.
Momentum is improving compared to December.
Overall Bias
Short-term bias: Bullish to neutral
As long as price holds above the rising trendline, buyers remain in control.
A clean daily close above $99k could open the door to a $100k+ breakout.
A breakdown below $92k would weaken the bullish structure and signal a deeper pullback.


BTCUSD (4H) – Consolidation Below Key Volume Node After PullbackMarket Structure: On the 4H timeframe, BTCUSD shows a strong impulsive rally followed by a corrective pullback and current sideways consolidation. Price is holding above prior higher lows, so the medium-term structure remains bullish, but momentum has clearly cooled.
Price Action: After topping near the recent swing high (~93k area), price retraced and is now ranging around 90,500. The candles show indecision (overlapping bodies and wicks), suggesting balance rather than trend at the moment.
Volume Profile (Right Side):
A high-volume node (HVN) is visible roughly around 90k–91k, indicating a fair value area where buyers and sellers agree.
Below, another significant volume cluster appears near 88k–89k, which should act as strong support if price breaks down.
Above current price, thinner volume up toward 92k–93k suggests that if price breaks and holds above the HVN, movement could be relatively fast.
RSI (14): RSI is around the mid-40s, below the neutral 50 level. This confirms lack of bullish momentum, but it is not oversold—more consistent with consolidation than reversal.
Bias & Scenarios:
Bullish scenario: Acceptance above ~91k suggests continuation toward 92.5k–93k, where prior supply sits.
Bearish scenario: Loss of ~89.8k–90k acceptance could lead to a rotation down toward 88k, aligned with the next major volume node.
Most likely near-term: Continued range-bound price action until a clear breakout from the volume area.

BTC/USD Daily Chart – Bullish Recovery Above Rising TrendlineOverall Structure
Bitcoin is in a recovery phase following a sharp decline from the previous highs.
Price is forming higher lows, suggesting buyers are regaining control in the short term.
The market remains below all-time highs, so this move is still considered a corrective rally within a larger cycle.
Trendline Behavior
Price is respecting a rising support trendline, which acts as dynamic support.
As long as BTC holds above this trendline, the bullish recovery structure remains valid.
A breakdown below the trendline would weaken the current bullish bias.
Momentum Indicators
RSI (14): ~60
Indicates moderate bullish momentum.
RSI is not overbought, leaving room for further upside.
MACD (12,26,9):
MACD lines are crossing upward.
Momentum is improving but still in an early expansion phase.
Awesome Oscillator (AO):
Histogram has turned green, confirming positive momentum shift.
Key Price Levels
Immediate Support: $90,000
Major Support: $84,000–$86,000
Immediate Resistance: $95,000–$96,000
Next Upside Targets: $100,000 and $104,000
Market Bias
Short-term bias: Bullish while above $90k and trendline support.
Mid-term bias: Neutral-to-bullish, pending a confirmed breakout above $96k.
Volume expansion on a breakout would be critical for confirmation.

BITCOIN BACK TO 109K..... Bell is ringing....Through my analysis, weekly shows firm bullish.
Geo political uncertainty all over the world because venezuela president capture.
Join this with weekly bias leads to lot of upward momentum.
Bos happened in daily timeframe with good price momentum.
So the next resistance is 97k and then to 109k.
Mark my words it will reach in one or two weeks .
The ball and bat is in perfect place , SWING is guys.....
No regrets......

BTC 1H: Rejection at Supply, Bearish Continuation RiskChart Analysis (1H BTC/USD):
Major Supply Zone (~90,000–90,200):
Price was strongly rejected from this area, confirming it as a key overhead resistance. Sellers remain active here.
Fair Value Gap (FVG) / Mid Resistance (~89,000–89,500):
The red FVG zone above current price acts as a likely pullback target, but also a strong sell zone if revisited.
Current Structure:
After the rejection, BTC broke down and is consolidating below short-term EMAs, indicating bearish momentum on the 1H timeframe.
Key Support Zones:
Near-term demand: ~86,700
Major downside target: ~84,600
Loss of the 86.7k support increases probability of a deeper move toward 84.6k.
Projected Path:
The dotted projection suggests a possible pullback into resistance (87.8k–89k) followed by continuation lower, unless price reclaims and holds above the FVG.
Bias:
Below 89k: Bearish / sell rallies
Above 90.2k: Bearish bias invalidated, trend may shift bullish

BTCUSD Buy IdeaBTC USD Major Trend Is Bearish But Short Term Trend Is Bullish So Taking Advantage of that By Targeting Nearest Resistance Area Buy at 86400 SL At 85800(Support) Target at 87050(Resistance)

BTCUSD 15-Minute Chart – Symmetrical Triangle Consolidation withAnalysis:
Market Structure: After a sharp bearish impulse (strong sell-off), BTC entered a consolidation phase, forming a symmetrical triangle. This indicates balance between buyers and sellers after high volatility.
Trend Context: The impulse move before the triangle was downward, but price has stabilized and volatility is compressing — often a precursor to a strong breakout.
Pattern Details:
Lower highs and higher lows are clearly converging.
Price is currently near the apex, where breakout probability increases.
Bias:
The drawn plan suggests a bullish breakout scenario.
Entry is placed slightly above triangle resistance to avoid false breakouts.
Trade Plan (as illustrated):
Entry: On confirmed breakout above the triangle resistance
Target: Measured move projection upward (roughly equal to the triangle’s height)
Stop Loss (SL): Below triangle support to invalidate the setup
Risk–Reward:
Favorable R:R, as the stop is tight relative to the projected upside.
Confirmation to Watch:
Strong bullish candle close above resistance
Increase in volume on breakout
Failure signal if price breaks down instead and closes below support
Conclusion:
BTCUSD is coiling inside a symmetrical triangle after a high-momentum drop. The setup favors a volatility expansion trade, with a bullish breakout being the planned direction — but confirmation is essential. A downside breakout would invalidate the bullish bias and shift momentum back to sellers.

BTCUSDT Price Action Analysis: Buy/Sell Zones, SL/TP, and Market1. Overall Trend
Your chart shows short-term bullish momentum inside a larger descending structure
(you have drawn a falling wedge / descending channel top).
👉 Short-term: bullish – strong impulsive green candle breaking through multiple intraday levels.
👉 Higher timeframe: bearish resistance overhead – price is approaching the major trendline.
🟢 2. Buy Zones (Bullish Setups)
BUY AREA #1 – Retest of 0.382 / 0.50 Fib Zone (~$90,000–$91,200)
Your strong bullish candle started from this zone.
A pullback back into this demand area = ideal entry.
Why Buy:
Bullish impulse → correction → continuation
Clear demand zone (multiple rejections)
Confluence with your ascending black trendline
Previous consolidation + liquidity grab
Entry:
→ $90,500–$91,200
SL:
→ Below $89,800 (last swing low)
TP1: $92,400
TP2: $93,700
TP3: $94,500 (1.0 Fib + supply zone)
BUY AREA #2 – Break & Retest of $92,465
If price breaks above $92,465 and retests, bullish continuation likely.
Why Buy:
Break of structure (BOS)
Retest of resistance turned support
Strong bullish pressure in previous candle
Entry: After retest & bullish candle confirmation.
SL: Below $92,000
TP: $93,800 / $94,500
🔴 3. Sell Zones (Bearish Setups)
SELL AREA #1 – Major Resistance $93,700–$94,550
Price is currently inside this zone (your dotted blue horizontal line + Fib 1.0).
This is a strong sell zone because:
Why Sell:
Major resistance + 1.0 Fibonacci
Intersection with descending trendline
Previous supply zone
Impulsive move → likely to retrace
Entry:
→ Bearish rejection candle on resistance
(HR wick + small body)
SL:
→ Above $94,800
TP1: $92,400
TP2: $91,200
TP3: $89,800
SELL AREA #2 – Break Below $89,800
If price breaks this key support, we will see strong downside.
Why Sell:
Break of structure
Loss of bullish demand
Below trendline
Entry: Retest of $89,800 from below
SL: Above $90,200
TP: $88,000 / $87,700 liquidity zone
⚠️ 4. No-Trade Zones
Avoid trading in these areas:
NO TRADE ZONE #1 – Between $91,200 and $92,400
Why?
Choppy range
No clear direction
Middle of structure
Poor risk-reward
NO TRADE ZONE #2 – Inside the triangle squeeze before breakout
Price often becomes unpredictable inside a wedge apex.
Wait for break → retest → trade.
📝 5. Summary (Quick Guide)
🟢 BUY
✔ Retest of $90,500–$91,200
✔ Break & retest of $92,465
🔴 SELL
✔ Rejection from $93,700–$94,550
✔ Break & retest of $89,800
🛑 NO TRADE
⚠ Between $91,200–$92,400
⚠ Inside wedge compression area

BTCUSD – Buy/Sell Zones + No-Trade Zone Here is a clean, price-action based analysis of your chart with:
✅ Buy zones
❌ Sell zones
🚫 No-trade zone
🎯 TP levels
🛑 SL levels
📌 Overall Market Condition
BTCUSDT is moving inside a big consolidation range.
The zone you highlighted is correct — NO TRADE AREA — because price is stuck in a sideways block with no directional confirmation.
🚫 NO TRADE ZONE
Price: 91,800 – 92,500 USDT
Reason:
Choppy structure
No direction
Liquidity building
Dangerous to open positions inside the block
🔔 Wait for breakout and retest confirmation only.
⬆️ BUY SETUPS (LONG ENTRIES)
1️⃣ Breakout Buy
Buy above → 94,250
📌 Conditions:
Candle must close above the level
Retest + bullish confirmation
🎯 TP targets (Upside green arrows)
TP1 → 96,850
TP2 → 99,640
TP3 → 100,970 (major resistance)
🛑 SL:
Below 93,700 (safe stop)
2️⃣ Pullback Buy (from lower demand)
Buy near → 89,700 – 90,000
This is first strong demand after breakdown.
🎯 TP:
TP1 → 92,300 (back to no-trade zone)
TP2 → 94,250
🛑 SL:
Below 89,150
⬇️ SELL SETUPS (SHORT ENTRIES)
1️⃣ Sell breakdown below support
Sell below → 89,700
🎯 TP levels (red arrows)
TP1 → 88,820
TP2 → 86,140
TP3 → 81,950
TP4 → 79,330 (final target)
🛑 SL:
Above 90,200
2️⃣ Pullback Sell
If price breaks below 89,700, then returns to retest:
Sell zone: 89,700 → 90,000
Confirm rejection wick.
🎯 TP:
Same as above
86,140 → 81,950 → 79,330
🛑 SL:
Above 90,300
📌 FINAL SUMMARY TABLE
Setup Entry TP SL
Breakout Buy Above 94,250 96,850 → 99,640 → 100,970 93,700
Pullback Buy 89,700 – 90,000 92,300 → 94,250 89,150
Breakdown Sell Below 89,700 88,820 → 86,140 → 81,950 → 79,330 90,200
Pullback Sell Retest 89,700 – 90,000 Same as above 90,300
No-Trade Zone 91,800 – 92,500

BTCUSD – Key Level Rejection with Potential Liquidity Sweep TowaChart Analysis
1. Price Context
BTCUSD is trading around $90,675.
The chart shows price rejecting the Key Level and failing to hold above the Daily CLS (daily close level).
Recent candles indicate loss of bullish momentum with a series of lower highs forming.
2. Key Zones on Your Chart
🔴 Daily CLS (Resistance)
Marked in red.
Price tried to break and hold above this level but rejected, showing it is acting as strong overhead resistance.
The shaded gray area above looks like the stop-loss zone for shorts, suggesting a bearish setup.
🟢 Key Level
Marked slightly below the Daily CLS.
Price broke above it earlier but is now retesting from the top, failing to reclaim.
This retest-rejection pattern signals a shift from bullish to bearish sentiment.
3. Trade Bias Indicated by the Chart
Your marked zone suggests a short position setup:
Entry around current price or just under the Key Level.
Stop-loss in the gray shaded box above the Daily CLS.
Take Profit 1 at 50% CLS TP1, a midpoint liquidity target.
Final TP near the green support at the bottom.
This structure reflects a liquidity-based short setup, expecting:
A sweep of local highs → rejection → push down to fill inefficiencies or revisit liquidity pools below.
4. Market Structure
Price printed a strong move up earlier, leaving inefficiency below.
Now forming lower highs and lower lows on the lower timeframe.
Hold below Key Level suggests continuation downward.
5. Bearish Confirmation Signals
✔ Failure to hold above Daily CLS
✔ Break of Key Level and retest as resistance
✔ Weak bullish follow-through
✔ Liquidity target below at 50% CLS

If you ignore this than it's your choice INDEX:BTCUSD
I am also shocked
every November closed in green in Year on year based than november near to end then it means v shape bounce is ready to in 6 days
please do your own research before taking any trade.
i am not financial advisor
risk is real stay practical
please feel free to ask any questions

BTC out of box and retest done.. going upBitcoin long position is on the way. Btc is now out of critical box expected now to get reward same like range of box. So as marked it can go upto trendline to test it and completes the range on buying side in short term then after trendline hits we need to see for next move.

BTC/USD Bullish Pennant – Breakout Entry SetupBTC/USD Bullish Pe✅ BTC/USD Pennant Breakout – Technical Analysis
Chart Breakdown
The chart shows Bitcoin forming a bullish pennant pattern on the 45-min timeframe.
A pennant typically forms after a strong impulsive move (pole), followed by price compression between:
Descending trendline (upper)
Ascending/flat trendline (lower)
This usually signals continuation in the direction of the previous trend, which in this case is upward.
Key Levels
Entry Zone: Just above the pennant resistance (breakout zone).
Stop-Loss: Below the pennant support — good risk management.
Target: Projected by measuring the previous impulse (the pennant pole) and extending it upward.
Market Signals
✔ Price is squeezing near the apex — breakout imminent.
✔ Buyers appear to be defending the lower trendline.
✔ If price breaks and closes above resistance, upside continuation becomes likely.
✘ But if price rejects and falls below support, the setup invalidates.
Bias
Bullish Continuation – If breakout occurs with strong volume.

BTC - Buy - Price @ Support areaBTC is testing the W support area as per SMC retest. Interest Rate cut is super bullish for BTC and markets in general

BTC - Long1. The colored horizontal areas show Fibonacci retracement levels, which traders use to spot possible support and resistance zones where the price might reverse or continue its move.
2. The 0% level is at the top (115,943) and the 100% level is at the bottom (109,523).
3. The price is currently near 113,207 and close to the 50% (112,732) and 61.8% (111,975) retracement levels.
4. Volume bars at the bottom show how much Bitcoin is being traded at each time.
5. If price bounces from the 50% or 61.8% levels (these are green and blue zones), traders can consider buying (long entry), hoping the price will go up. Always watch for a reversal candle or increased volume at these levels before entering.
6. Place your stop-loss just below the 61.8% level. For example, below 111,975.
7. Set your first target near the 38.2% level (113,490) and second target near the 23.6% level (114,428).
8. If price breaks below the 61.8% level with strong volume, avoid buying and look for a sell setup instead.
9. This setup uses common trading concepts like Fibonacci, support and resistance, and volume confirmation. Remember to wait for confirmation signals and manage risk with stop-loss orders.

Btc 1H long ideaHere's a detailed description of the information presented:
• Financial Instrument: The chart is for Bitcoin (BTC) priced against USDT (Tether), a stablecoin. The "Perp Perpetual Mix Contract" suggests this is a futures or derivatives contract that doesn't expire.
• Timeframe: The chart is set to 1-hour (1H), meaning each candlestick represents one hour of price movement.
• Trading Position: A long position is currently open, indicated by the green and red boxes. A long position is a bet that the price will increase.
• Entry Point: The white horizontal line marks the entry price at 116,980.2.
• Take-Profit Target: The top of the green box, labeled "Target," is at 119,810.0. The potential profit for reaching this target is 3,517.2 USDT, which is a 3.02% gain.
• Stop-Loss: The bottom of the red box, labeled "Stop," is at 114,658.0. This is the price level where the trade will automatically close to limit losses. The potential loss is 1,646.4 USDT, or a 1.42% drop.
• Risk/Reward Ratio: The text "Risk/Reward Ratio: 2.14" indicates that the potential profit is 2.14 times greater than the potential loss. This is a key metric used by traders to evaluate if a trade is worth the risk.
• Price and Indicators:
• The current price is shown as 117,210.1.
• The chart includes various indicators and tools, such as moving averages (the blue and yellow lines moving with the price) and a volume histogram at the bottom (red and green bars).
• There are also horizontal white lines that likely represent significant support and resistance levels.
In summary, the image provides a clear visualization of a planned crypto trade, outlining the specific entry, stop-loss, and take-profit levels, as well as the associated risk/reward profile.

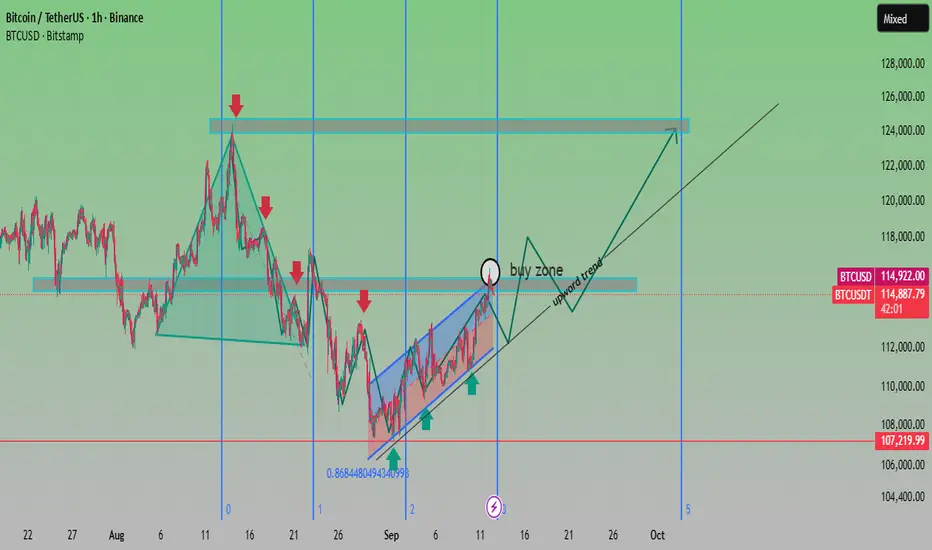
BTC Buy Zone Forming – Potential Bullish Breakout AheadAnalysis:
Trend Structure: After a corrective decline from the $124K resistance area, BTC has rebounded strongly, forming a rising channel (highlighted in blue).
Support Levels: Strong demand observed near $107,200, aligning with the 0.868 Fibonacci retracement, making it a crucial support zone.
Buy Zone: Chart highlights the $114K–$116K range as a buy zone before continuation of the upward trend.
Resistance Levels: Key resistance remains around $124K–$126K, which is the next major target if the bullish momentum sustains.
Outlook: As long as BTC stays above $114K support, the bias remains bullish, with a potential rally towards $120K–$124K. A breakdown below $112K would invalidate the bullish scenario.
✅ Bias: Bullish continuation
🎯 Targets: $120,000 → $124,000
🛑 Invalidation: Break below $112,000