Bitcoin H1 Analysis: Shorting the Retracement After Major BrKDWNLet’s analyze your **BTCUSD H1 chart** carefully 👇
---
🧠 Chart Summary
* **Symbol:** BTCUSD
* **Timeframe:** H1
* **Current Price:** ~112,309
* **Sell Limit:** 113,041.61
* **Stop Loss (SL):** just above 113,041.61 (roughly near 113,300–113,400)
* **Take Profit (TP):** not explicitly shown but likely near 109,000–108,000 based on structure.
---
📊 **Technical Breakdown**
1️⃣ Trend Direction
* The pair is **in a clear short-term downtrend** after failing to hold above the **Previous Daily High (≈122,900)**.
* Price broke **below 50% and 61.8% Fibonacci retracement levels**, confirming bearish momentum.
* **Moving averages (Red = short-term EMA, Yellow = long-term EMA)** are both sloping **downward**, showing strong bearish momentum.
2️⃣ Key Structure Levels
* **Previous Daily High:** ~122,900 (Major resistance zone)
* **Previous Daily Low:** ~114,700 (Broken → retest expected)
* **Sell Limit Level (113,041.61):** Perfectly placed near the **Fibonacci 23.6%–38.2% retracement zone** of the last swing leg.
* This is an **ideal “lower-high” retracement entry** in a downtrend.
#### 3️⃣ Support Zones Below
Immediate support:** 111,800
Next key support:** 109,250 (around your possible TP zone)
Weekly low zone:** 108,350 – if that breaks, we could see a deeper push to 106,000.
---
⚙️ **Trade Plan Analysis (Sell Limit 113041.61)
| Aspect | Analysis |
| --------------------- | --------------------------------------------------------------- |
| **Setup Type** | Pullback Sell / Lower-High Entry |
| **Bias** | Strongly Bearish |
| **Entry Level** | 113,041.61 (Good retracement zone) |
| **Stop Loss** | Above 113,400–113,600 (just beyond structure) |
| **Take Profit** | 109,200–108,300 (previous support and 100% Fibonacci extension) |
| **Risk/Reward Ratio** | ~1:3 or better depending on TP placement |
| **Probability** | High – provided retracement completes to your Sell Limit |
---
🔥Confirmation Points Before Entry Triggers
If price retraces upward:
* Watch for **bearish engulfing** or **rejection candle** near 113,000 zone.
* If price fails to break above 113,400, your entry is valid.
* If it closes **above 113,600 on H1**, consider canceling the order — it would mean short-term momentum shifted bullish temporarily.
---
🧩 Summary Plan
✅ **Entry:** Sell limit at 113,041.61
✅ **SL:** 113,400–113,600
✅ **TP1:** 111,900
✅ **TP2:** 109,200
✅ **TP3:** 108,350
📉 **Bias:** Bearish continuation after pullback
---
⚠️Extra Notes
* Momentum is strong; if the retracement doesn’t reach 113,000, you might miss the entry — don’t chase.
* A secondary entry could form near **112,700** if a fresh rejection candle appears there.
* News events or BTC volatility spikes can create fake pullbacks — always watch the **H1 close** for confirmation.
-
Btcusdshort
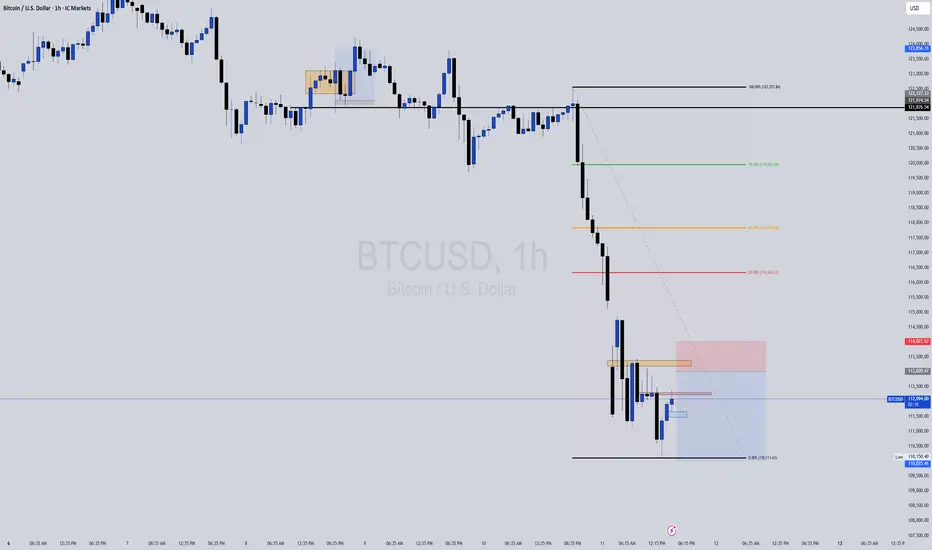
Accumulate liquidity, and then move up toward 113,697
• Current Price: Around 110,138 USD.
• Highlighted Zones:
• BSL (Buy-Side Liquidity) zone near 117,000 – 118,000 USD.
• SSL (Sell-Side Liquidity) zone around 109,000 USD.
• Levels Marked:
• PDH (Previous Day High) at 113,697 USD.
• PDL (Previous Day Low) at 109,409 USD.
• Market Structure:
• The price is currently trading near the PDL/SSL zone, suggesting possible accumulation or liquidity grab before a potential upward move.
• A projected path (dotted lines) indicates a possible consolidation, then a move up toward PDH, and further toward the BSL zone.
• A support/resistance flip (S/S) is marked around the 111,000 USD level, suggesting a key zone to watch for validation of bullish momentum.
Interpretation:
The chart suggests a potential bullish scenario: price might retest the SSL zone, accumulate liquidity, and then move up toward 113,697 (PDH) and possibly the 117k BSL zone.

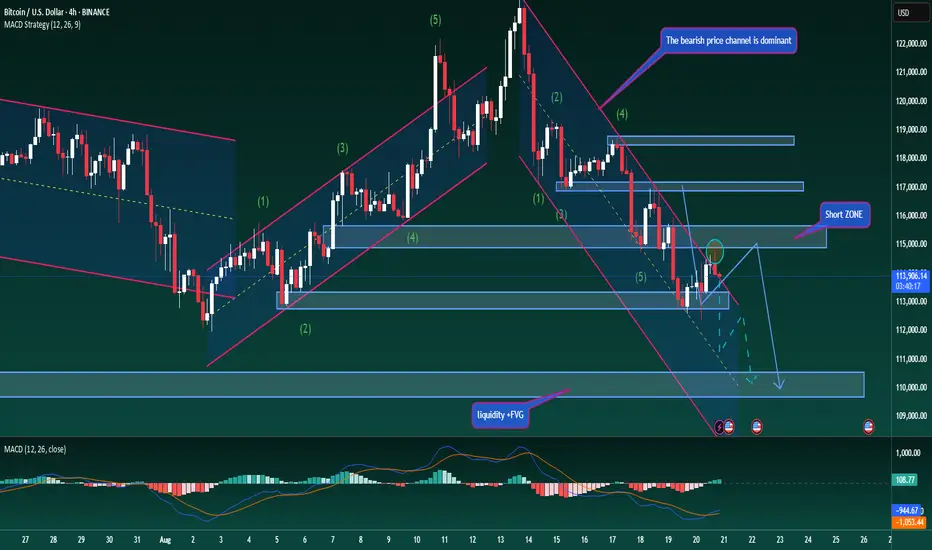
Bitcoin – Continuing to Follow the Bearish StructureBitcoin – Continuing to Follow the Bearish Structure
BTC has continued to follow the earlier analysis, with price moving back towards the 115,000 zone and resuming its downward waves. The descending channel remains intact and is guiding price action, with the next target area expected near 110,000.
To reach this level, BTC may form another Dow-style downward leg, closely tracking the trendline within the channel. That said, traders should be cautious — MACD is showing rising volume and the moving average is beginning to turn upward, which could be an early warning sign against aggressive short positions.
In trading, following the main trend is always the priority. Going against the market should only be considered when there is clear evidence of large liquidity zones or strong trader sentiment at key levels. Otherwise, trading in line with the prevailing trend remains the safer approach.
For BTC, the strategy is to keep following the descending channel and look for entries at trendline touches. Short-term scalping opportunities may arise around 112,600 and 111,800. The medium-term short entered near 115,000 remains active, with targets set towards 110,000. This zone will also be watched closely as a potential buying area, and decisions can then be made on whether to hold positions for the longer term.
This is my trading outlook for BTC. I hope the scenarios are useful, and I’d love to hear your views in the comments.
#BTCUSD #Bitcoin #CryptoAnalysis #TechnicalAnalysis #PriceAction #Trendline #DowTheory #MACD #CryptoTrading #SwingTrading
BTCUSD SHOWING A GOOD DOWN MOVE WITH 1:10 RISK REWARD BTCUSD SHOWING A GOOD DOWN MOVE WITH 1:10 RISK REWARD
DUE TO THESE REASON
A. its following a rectangle pattern that stocked the market
which preventing the market to move any one direction now it trying to break the strong resistant lable
B. after the break of this rectangle it will boost the market potential for break
C. also its resisting from a strong neckline the neckline also got weeker ald the price is ready to break in the outer region
all of these reason are indicating the same thing its ready for breakout BREAKOUT trading are follws good risk reward
please dont use more than one percentage of your capital follow risk reward and tradeing rules
that will help you to to become a bettertrader
thank you

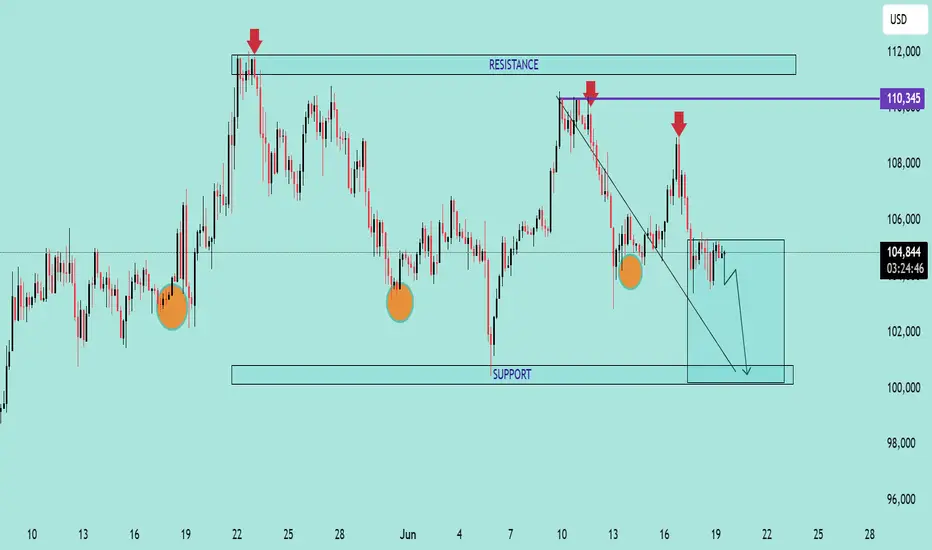
BTC/USD Bearish Outlook Analysis BTC/USD Bearish Outlook Analysis 📉🧠
📊 Technical Overview:
The BTC/USD chart is showing signs of a bearish structure formation, suggesting increased downside momentum in the short term.
🔻 Resistance Zone:
Clear resistance is identified near $110,345, marked by multiple price rejections (🔴 red arrows).
Price failed to break above this zone several times, indicating strong selling pressure.
🔸 Support Zone:
Strong support lies near the $100,000 psychological level.
Price has respected this zone multiple times (🟠 orange circles), indicating buyer interest.
📉 Current Price Action:
A descending trendline breakout attempt failed and price is now consolidating just below $105,000.
Price is forming a bearish flag/consolidation structure after recent rejection.
A breakdown from the current box range is likely to push BTC toward the support zone at $100,000.
📉 Bearish Scenario:
If BTC breaks below $104,000, expect continuation towards $100,000.
A daily candle close below support could signal further downside.
📈 Invalidation:
Bullish invalidation occurs if BTC reclaims and closes above $108,000, with volume, retesting resistance at $110,345.
🧭 Summary:
BTC/USD is exhibiting a lower highs structure within a descending channel. Unless it breaks above the resistance zone, the bias remains bearish with a high probability of retesting support.
BITCOIN - STRUCTURAL SHIFT AMID CORRECTION & LIQUIDITY TESTSymbol - BTCUSD
CMP - 1,05,634
Bitcoin is experiencing a recovery following a liquidity sweep in the 1,00,000 zone. Despite the broader bullish trend, the local technical outlook remains mixed.
Bitcoin is currently undergoing a shift in market structure, with a change in character observed around the 1,06,700 level and a breakdown of the bullish structure at 1,03,000 during a corrective phase. This downward movement is testing liquidity beneath the 1,00,700 support zone. Several factors contribute to the ongoing liquidation: notably, the unexpected market reaction to tensions between Donald Trump and Elon Musk, and the liquidation activities of large holders (whales), which appear to be repeating historical patterns.
While traders are actively buying back Bitcoin, the overall market structure remains technically bearish. Locally, a downtrend is present, and a countertrend move interpreted as a form of 'liquidity hunting' is currently developing.
A key area of interest lies between 1,05,900 and 1,06,700. The initial retest of this zone may result in a false breakout due to insufficient momentum for sustained upward movement following the strong buyback.
Resistance levels: 105900, 106720, 110400
Support levels: 103000, 101400, 100,000
Following a correction from the 1,05,900 level, which may target the 50% retracement of the recent trading range, the market could potentially re-enter a bullish phase, provided buyers manage to maintain price levels and prevent a drop to new local lows. In the short term, a decline from 1,05,900 to 1,03,000 is anticipated. However, if the price subsequently recovers to the 1,05,500–1,05,900 range, there may be an opportunity for further upward movement toward the 1,10,000 level.

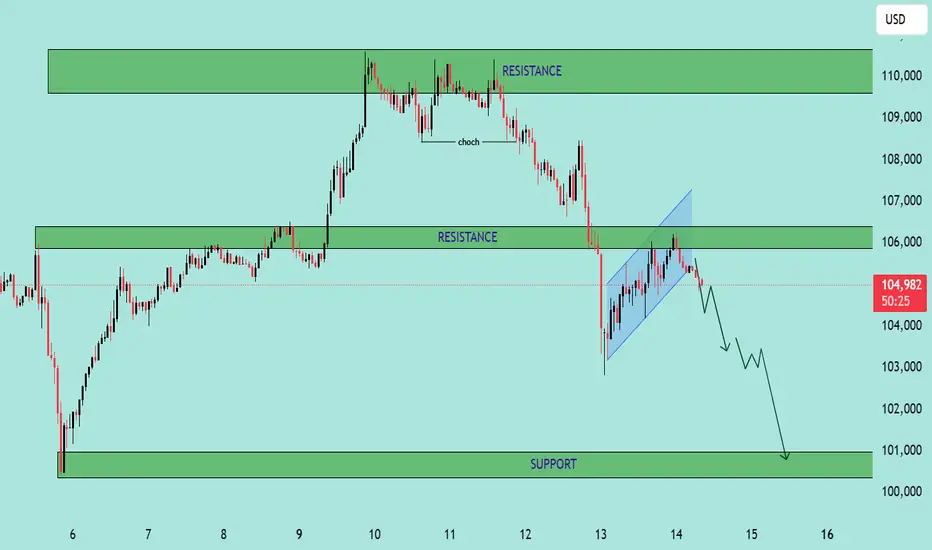
BTC/USD – Bearish Continuation from Rising Channel BTC/USD – Bearish Continuation from Rising Channel 🚨🧱
This chart indicates a bearish market structure with the following key technical features:
🔍 Chart Analysis:
Change of Character (CHoCH) 🔄
A shift from bullish to bearish was confirmed by a strong breakdown after the CHoCH marked at the top.
This breakdown invalidated previous bullish structure.
Bearish Flag Formation 📉📐
After the impulsive drop, price formed a bearish flag (rising channel), suggesting a potential continuation move to the downside.
Resistance Rejection 🚫
Price is currently testing and rejecting the 105,800–106,500 resistance zone, previously a support turned resistance.
The rejection from this level adds further bearish confluence.
Downside Projection ⬇️📍
If the pattern plays out, the projected move shows a potential drop toward the major support zone at 100,000–101,000.
📌 Key Levels:
Resistance Zones:
105,800–106,500 🧱
109,500–111,000 🧱
Support Zone:
100,000–101,000 💚
🧠 Conclusion:
The chart suggests that BTC/USD is in a bearish continuation phase, with strong rejection from key resistance and a confirmed breakdown from a bearish flag. Traders should watch for confirmation of continuation below 104,500 to target the 100k support level. Risk management is crucial near volatile zones.
Technical Analysis – BTC/USD Technical Analysis – BTC/USD
📅 Date: June 11, 2025
🔍 Key Observations:
🔴 Resistance Zone – $110,000 to $111,800
Price has tested this resistance block twice (🔴 red arrows) and rejected both times, indicating strong selling pressure in this zone.
Rejection candles show long upper wicks, suggesting failed attempts by bulls to break above.
🟢 Support Zone – $101,800 to $103,500
This demand zone has been respected multiple times (🟢 green arrows), showing a solid base for potential bounces.
Price action previously rallied strongly after touching this level.
📦 Supply to Demand Play
Price made a sharp bullish move from support to resistance (📘 blue box shows the impulsive move).
After reaching resistance, the price is failing to break above, indicating possible exhaustion of bullish momentum.
📉 Potential Move:
🔽 Short-Term Bearish Bias
If price fails to hold current levels and breaks below the small consolidation (after blue box), we may see a drop to ~$105,583 (🔵 purple line = key level).
If that breaks, next likely destination is the support zone around $102,000 (⬇️ downward arrow path).
⚠️ Risk Notes:
🔁 Watch for any false breakouts or liquidity grabs above resistance.
📉 If bearish momentum increases below $105,583, sellers may take control in the short term.
✅ Trade Idea (Hypothetical):
Sell/Short near resistance (⚠️ confirmation needed like bearish engulfing or failed breakout)
Target 1: $105,583
Target 2: $102,000 zone
Stop-loss: Above $111,800 (invalidates setup)
📌 Summary:
BTC/USD is currently stuck between a well-defined resistance and support range. Unless bulls break above $111,800 with strong momentum, the structure favors a potential pullback toward the demand zone. ⚖️

Bitcoin Price Analysis – 1H Chart (BINANCE)📊 Bitcoin Price Analysis – 1H Chart (BINANCE)
Date: May 28, 2025
Pair: BTC/USDT
Timeframe: 1 Hour (1H)
🏔 All-Time High (ATH) Rejection
🔴 Zone: ~111,800 – 112,000 USDT
BTC previously reached an ATH (marked in red) but failed to maintain momentum.
This level formed a double top pattern, a classic reversal signal.
📉 Key Resistance Zone
🟪 Range: ~109,500 – 110,500 USDT
Multiple rejections from this purple box indicate strong seller presence.
This area is now acting as a resistance barrier, preventing upward movement.
🔵 Support & Target Level
📍 Support Level: 106,622.06 USDT
🗨️ “when touch this level next target 100k”
The blue line represents a crucial short-term support.
The chart suggests a bearish move toward this level before a possible bullish reversal.
If price breaks below this, we could see further downside before any major rally.
🔄 Market Structure
🔹 BTC has formed a lower high structure, indicating weakening bullish momentum.
🔻 A head-and-shoulders pattern appears to be forming, which typically signals a reversal from bullish to bearish.
🧠 Trader Insight
📌 A drop to 106,622 USDT may act as a liquidity grab, potentially setting the stage for a major move upward.
⚠️ However, confirmation of a reversal (bullish signals, volume spike) will be critical before assuming a breakout to 100k as implied.
🔍 Conclusion
🚨 BTC is in a critical zone between resistance (~110,000) and support (~106,600).
📉 Near-term bias: Bearish → Targeting 106,622 USDT
📈 Medium-term possibility: Bullish rally only if support holds and sentiment shifts.

BTCUSD SHORT! With 1:3 RR SET UPHello traders, I'm back with another advance trade set up, in BTCUSD 1H tf price is making LL & LH formation which suggests potential reversal from its highs. in bigger tf BTCUSD also comes near the previous resistance zone, so here we can go with short set up for good Risk to reward ration.
Short BTCUSD if 1H candle close below 102700
With SL:- 104500-105000 zone and Tp1)100000 & Tp2) 98000-96000 range it's a Swing trade so we have to wait for our tp, it's advance trade set up so entry will be valid only if it closes below 102700 lvl. Once you get 1:1 RR trail your sl and book part profits👍 I will post update in comments, have a great day

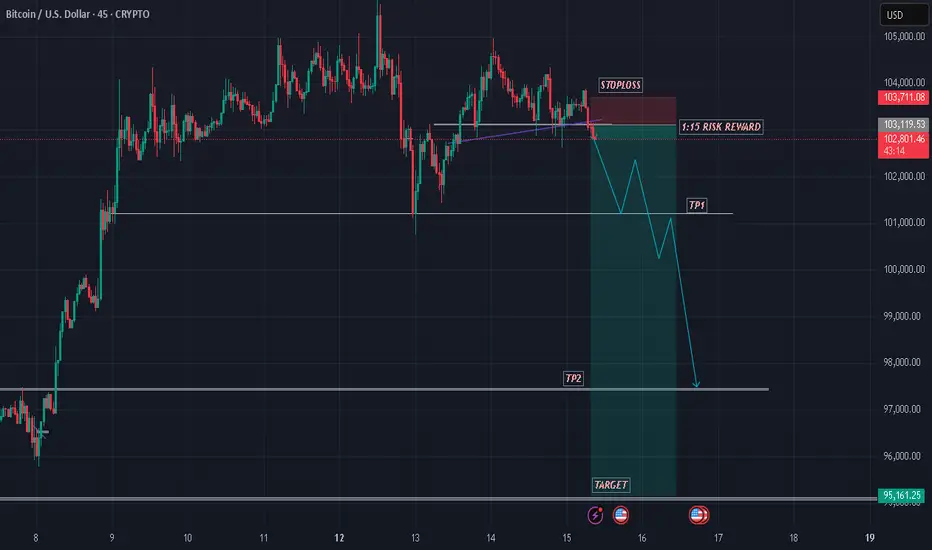
BTCUSD SHOWING A GOOD DOWN MOVE WITH 1:15 RISK REWARD BTCUSD SHOWING A GOOD DOWN MOVE WITH 1:15 RISK REWARD
DUE TO THESE REASON
A. its following a rectangle pattern that stocked the market
which preventing the market to move any one direction now it trying to break the strong resistant lable
B. after the break of this rectangle it will boost the market potential for break
C. also its resisting from a strong neckline the neckline also got weeker ald the price is ready to break in the outer region
all of these reason are indicating the same thing its ready for breakout BREAKOUT trading are follws good risk reward
please dont use more than one percentage of your capitalfollow risk reward and tradeing rules
that will help you to to become a bettertrader
thank you
BTCUSD 1H SHORT SET UP WITH 1:2 RRHello traders, here in BTC after giving good upside rally btc is forming double top formation Trend is strong uptrend still we will try to catch this short setup if it's works my previous set ups works perfectly let's see what happens in this one as well 😉
For shorting one can see if 1h candle close below 92400 with SL 94700 and tp zone of 87000-89000 range. Set is valid only if 1h candle close below 92400 lvl otherwise trade is invalid. Hence wait for the closing. If sl is too big than one can enter at retest if btc come upside.
Have a great weekend 👍🤗

BTC/USD Short Setup – Triple Top Reversal with EMA Confirmation Entry Point (Sell): Around $85,699.52
Stop Loss: $86,741.44 (above resistance zone)
Target (Take Profit): $82,982.09
This provides a Risk-Reward Ratio of approximately 1:2, a commonly acceptable ratio in trading.
📈 Indicators:
EMA 30 (Red) is currently above the EMA 200 (Blue), indicating bullish momentum—but this setup anticipates a trend reversal.
If price breaks below the EMAs, that would confirm bearish strength.
🧠 Conclusion:
This setup is based on:
A strong resistance zone,
Bearish reversal pattern (triple top),
Risk management via stop loss and take profit levels.
If you're trading this:
Wait for confirmation with a bearish candlestick below the EMAs or a break of recent support.
Manage position size based on stop distance and your account risk tolerance.

BTCUSD SHOWING A GOOD DOWN MOVE WITH 1:10 RISK REWARD BTCUSD SHOWING A GOOD DOWN MOVE WITH 1:10 RISK REWARD
DUE TO THESE REASON
A. its following a rectangle pattern that stocked the market
which preventing the market to move any one direction now it trying to break the strong resistant lable
B. after the break of this rectangle it will boost the market potential for break
C. also its resisting from a strong neckline the neckline also got weeker ald the price is ready to break in the outer region
all of these reason are indicating the same thing its ready for breakout BREAKOUT trading are follws good risk reward
please dont use more than one percentage of your capitalfollow risk reward and tradeing rules
that will help you to to become a bettertrader
thank you

Bitcoin (BTC/USD) Long Trade Setup –with Target 88,573,60Current Price: $80,724.28
Entry Point: $80,671.23 (just above current price)
Stop Loss: $78,052.44
Target Point: $88,573.60
Resistance Point: $82,260.90
📈 Trend & Moving Averages
EMA 30 (red): $80,220.87 — Short-term trend.
EMA 200 (blue): $80,788.61 — Long-term trend.
The price is currently between the EMAs, indicating potential indecision or a shift in trend. A break above both EMAs with momentum would confirm bullish strength.
🔑 Trade Setup Summary
Element Level
Entry 80,671.23
Stop Loss 78,052.44
Target (TP) 88,573.60
Resistance 82,260.90
Risk-Reward ~1:2.7 (approx)
📊 Analysis & Expectations
Bullish Bias: The chart suggests a long trade with a breakout strategy.
Volume and momentum confirmation will be key above resistance.
Resistance at 82,260.90 may cause a brief pullback before continuation to the target.
The stop loss is well-placed below a support zone and the most recent swing low.
✅ What to Watch For
Break and close above EMA 200 and resistance at 82.2K.
Bullish volume increase on breakout.
Price action around the entry zone (wait for confirmation candle if unsure).

BITCOIN MAY DROP TO 74K - BEARISH STRUCTURE INTACTSymbol - BTCUSD
CMP - 84600
BTCUSD is undergoing a shift in market structure, transitioning into a bearish phase following the breakdown at 90K. A deeper correction is currently developing, which, in my view, represents a logical and technically sound progression for a healthy market. It is concerning when the market only experiences upward movement driven solely by buying pressure, such as in the case of large-scale injections of funds into high-yield investment programs (HYIPs).
A correction in Bitcoin’s price or even a trend reversal could inject vitality back into the market. From a fundamental perspective, traders have not seen the expected active support for cryptocurrencies from the US, which was previously suggested during Trump's election campaign. Additionally, issues such as crypto exchange hacks, fraudulent coins, and Bitcoin's dominance are exerting negative pressure on altcoins.
Bitcoin’s current downturn, with the possibility of a further drop to the 75K-73K range, could present an opportunity for fundamentally strong altcoins, assuming the declining Bitcoin dominance index also continues to trend downward. The simultaneous reallocation of funds from Bitcoin to altcoins, along with a rebound in Bitcoin from a strong support level, could rejuvenate the prospects for an altcoin season.
Resistance levels: 88150, 90700
Support levels: 75000, 73570, 66830
A modest retracement towards the 88100 to 90700 range is possible before the price begins its descent. While Bitcoin may attempt a deeper pullback, the current market imbalance, coupled with the absence of a clear driving force or supportive factors, suggests that the price may continue to fall in the medium term, potentially reaching the liquidity zone between 75K and 73K

BITCOIN - LIKELIHOOD OF A SHORT SQUEEZE BEFORE A DOWNWARD SLIDESymbol - BTCUSD
CMP - 84540
BTCUSD continues to exhibit a bearish trend after breaking the bullish structure on the weekly timeframe. There are no discernible bullish drivers at present, and from a technical standpoint, the price is poised to approach the imbalance zone between 75K and 73K.
Recent events, such as the crypto summit and discussions surrounding crypto asset support, have failed to provide substantial backing for the market. These events have historically been followed by further market declines.
From a technical perspective, the market remains in a downtrend, indicative of a global counter-trend. This suggests that the current price movement is contrary to broader market sentiment, which aligns with typical market behavior. On a general scale, key zones of interest include 75K, 73K, and the order block between 69K and 66K.
On a more specific level, attention should be given to the nearest liquidity zones at the higher levels, which may be tested prior to any further declines. These levels are located at 86,697 and 89,397
Key Resistance levels: 85135, 86678, 89397
Key Support levels: 79987, 78173, 73512
Following the false break of the 78K support level, there has been no significant market reaction. The market appears to be consolidating within the 84-85K range, which suggests a weakening of buying interest. Prior to any further downward movement, there may be a short squeeze within the identified liquidity zones, potentially leading to an additional decline.

Bullish Reversal Trade Setup for BTC/USD – 4H Chart AnalysisZone: Around 76,094 USD
This zone aligns with a demand/support area, highlighted by the purple rectangle.
Price has sharply dropped into this zone, suggesting a potential reversal or bounce opportunity.
⛔ Stop Loss
Level: Around 73,312 USD
Placed below the support zone to allow some volatility wiggle room.
A break below this could invalidate the bullish setup.
🎯 Target Point (Take Profit)
Level: 87,271 USD
Risk-to-reward ratio is approximately 1:3+, offering solid trade potential.
This level corresponds to a previously established resistance zone or supply area.
📊 Indicators
EMA 50 (red): ~82,106 USD
EMA 200 (blue): ~85,250 USD
Current price is below both EMAs, suggesting short-term bearish momentum, but this setup banks on a mean reversion or swing back up.
📈 Trade Idea Summary
Parameter Value
Entry 76,094 USD
Stop Loss 73,312 USD
Take Profit 87,271 USD
Risk/Reward ~1:3
Setup Type Bullish Reversal
🧠 Extra Notes
Wait for confirmation (candle reversal pattern) in the demand zone before entering.
Be cautious of fake-outs or breakdowns below support, especially with broader market weakness.

BTCUSD SHOWING A GOOD DOWN MOVE WITH 1:10 RISK REWARD BTCUSD SHOWING A GOOD DOWN MOVE WITH 1:5 RISK REWARD
DUE TO THESE REASON
A. its following a rectangle pattern that stocked the market
which preventing the market to move any one direction now it trying to break the strong resistant lable
B. after the break of this rectangle it will boost the market potential for break
C. also its resisting from a strong neckline the neckline also got weeker ald the price is ready to break in the outer region
all of these reason are indicating the same thing its ready for breakout BREAKOUT trading are follws good risk reward
please dont use more than one percentage of your capitalfollow risk reward and tradeing rules
that will help you to to become a bettertrader
thank you

Bitcoin (BTC/USD) Short Trade Setup: Resistance Rejection & TargThis chart is a Bitcoin (BTC/USD) 15-minute price chart from TradingView, showing a potential short trade setup based on technical analysis. Here’s a breakdown of the key elements:
1. Resistance Zone & Short Setup
The purple highlighted area represents a resistance level around $85,358.
Price is consolidating within this resistance zone, suggesting a potential reversal.
The expected scenario involves a price rejection from this resistance, leading to a downward move.
2. Moving Averages
EMA (200, blue line) at $83,433: A long-term trend indicator suggesting a strong support zone.
EMA (30, red line) at $84,657: A short-term trend indicator, currently above the price, indicating a potential bearish setup if the price moves below it.
3. Target & Stop-Loss Le

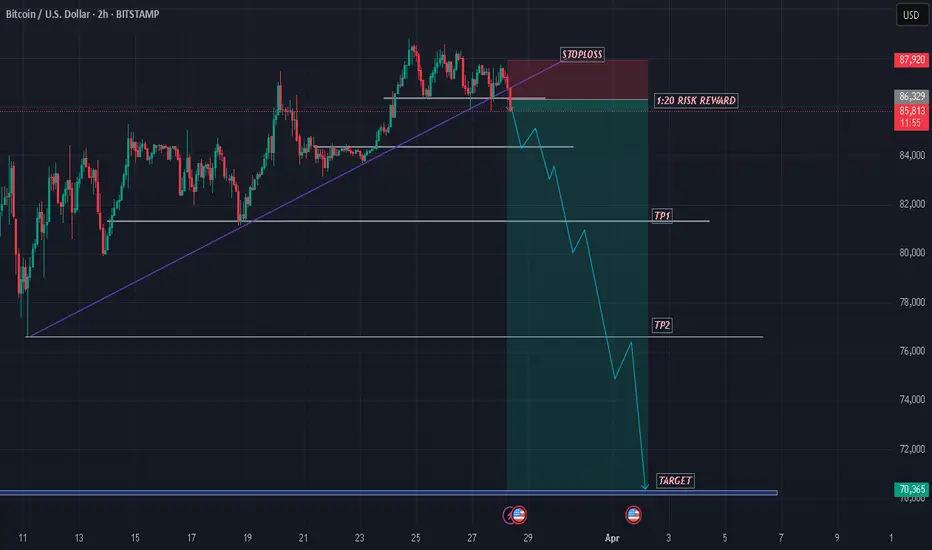
BTCUSD SHOWING A GOOD DOWN MOVE WITH 1:20 RISK REWARD BTCUSD SHOWING A GOOD DOWN MOVE WITH 1:20 RISK REWARD
DUE TO THESE REASON
A. its following a rectangle pattern that stocked the market
which preventing the market to move any one direction now it trying to break the strong resistant lable
B. after the break of this rectangle it will boost the market potential for break
C. also its resisting from a strong neckline the neckline also got weeker ald the price is ready to break in the outer region
all of these reason are indicating the same thing its ready for breakout BREAKOUT trading are follws good risk reward
please dont use more than one percentage of your capitalfollow risk reward and tradeing rules
that will help you to to become a bettertrader
thank you
Bitcoin (BTC/USD) 2H Analysis: Potential Bullish Continuation or30 EMA (Red, 86,440): Indicates short-term momentum.
200 EMA (Blue, 85,153): Represents long-term trend support.
Support and Resistance Zones
Support Zone (Purple Box - ~86,271 to 85,153): Price is likely to bounce from here.
Resistance Zone (~87,149 and above): Breakout above this could push price higher.
Trade Setup
Entry Consideration: The price is currently testing a demand zone (purple) after a pullback.
Target (Take Profit - 90,118): Expecting a bullish move.
Stop Loss (~86,658 or lower): To manage risk.
Potential Price Action
If Bitcoin holds above the purple demand zone and 30 EMA, it could rally to 90,118.
A breakdown below 86,271 could push it toward 84,366 or lower.
Conclusion
Bullish Bias: If price holds above the support level.
Bearish Risk: If it breaks below the purple zone.
Recommendation: Monitor support at 86,271 and 85,153, as a bounce from these areas could confirm an uptrend.

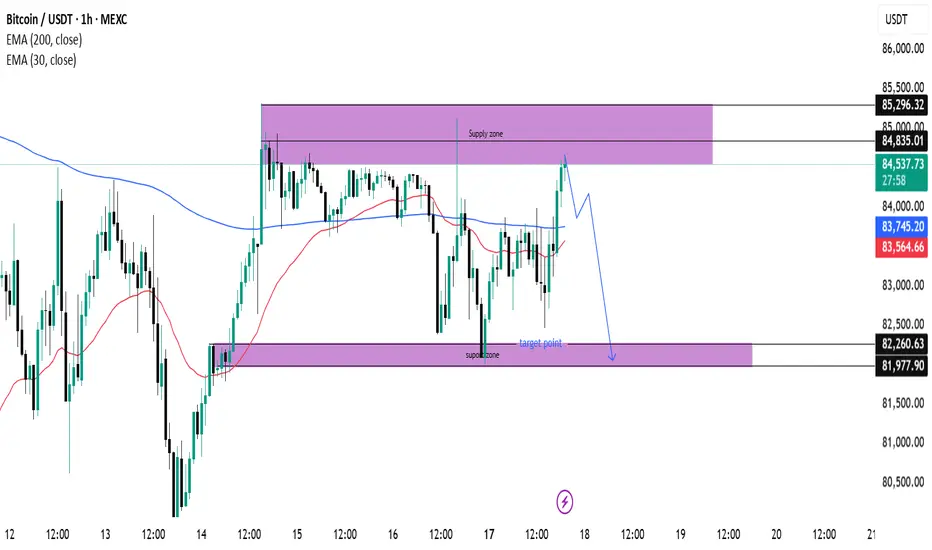
(BTC/USDT) Analysis: Supply Zone Rejection & Potential Drop Key Technical Levels:
Supply Zone (~85,296 - 84,835):
The price has reached a supply zone, which is acting as resistance. A rejection from this area could push BTC down.
Support Zone (~82,260 - 81,977):
This is a demand area where buyers might step in if the price declines.
Indicators:
EMA 30 (Red Line - 83,553.82): Short-term trend indicator.
EMA 200 (Blue Line - 83,743.52): Long-term trend indicator, currently above the price, indicating potential resistance.
Price Action & Prediction:
The price has touched the supply zone and is showing signs of rejection.
The blue projected path suggests a potential pullback followed by a drop toward the support zone (~82,260).
If price breaks below the support zone, further downside could be expected.
Potential Trade Idea:
Short Setup: If rejection at the supply zone continues, a short position could target the 82,260 support zone.
Long Setup: If price reaches the support zone and shows bullish reactions, a long position could aim for a rebound toward resistance.