BTCUSDT – London Session Long (Intraday)BTC is holding above a key intraday demand zone after a sharp sell-off, followed by a strong reaction and higher low. Price is consolidating, and the London session often provides expansion from such structures.
Trade Plan
🔺 Entry Zone: 92,500 – 92,650
🛑 Stop Loss: 91,750 (below demand)
🎯 Targets:
• TP1: 93,200
• TP2: 94,000
Entry Confirmation
15m close above 92,600 (preferred)
OR 5m break & retest holding above the entry zone
Invalidation
15m close below 92,300
📌 Trade management: partials at TP1, trail rest toward TP2.
⚠️ Not financial advice. Trade responsibly.
BTCUSDT

BTCUSDT Perpetual – Short Idea (FVG + Supply Rejection)BTC price faced rejection from a higher timeframe resistance zone and left a visible Fair Value Gap (FVG) above. Current structure shows consolidation below supply, increasing the probability of a downside continuation if the zone holds.
Trade Plan
🔻 Short Entry Zone: 93,300 – 93,500
🛑 Stop Loss: 94,000 (above resistance)
🎯 Targets:
• TP1: 92,400
• TP2: 90,500,
Confluence
HTF resistance rejection
FVG acting as supply
Weak follow-through after bounce
Range low liquidity resting below
📌 Risk Management :
Wait for confirmation on lower timeframe. Invalidation only above the marked supply.
⚠️ Not financial advice. Trade responsibly.

BITCOIN BACK TO 109K..... Bell is ringing....Through my analysis, weekly shows firm bullish.
Geo political uncertainty all over the world because venezuela president capture.
Join this with weekly bias leads to lot of upward momentum.
Bos happened in daily timeframe with good price momentum.
So the next resistance is 97k and then to 109k.
Mark my words it will reach in one or two weeks .
The ball and bat is in perfect place , SWING is guys.....
No regrets......

BTCUSD 1H Market Structure and Important Price LevelsBTCUSD on the 1H timeframe is showing a stable price structure after a completed correction. The recent pullback found support near the 86,500 area, where selling pressure reduced and price stabilised. From this level, the market recovered and moved back above 90,000, indicating renewed bullish control.
Price above this level is forming higher highs and higher lows, showing improving short-term structure and trend strength. The 90,000–89,800 zone is acting as an important support, which previously worked as resistance. As long as price holds above this area, the structure remains valid.
On the upside, the 91,000 level is a short-term resistance where reactions may be seen. Acceptance above this zone would indicate continuation, while rejection may keep price moving within the current range. Pullbacks should be assessed within the broader structure.
Market attention remains on price reaction near key levels.
Disclaimer: This analysis is for educational purposes only. It is not financial advice. Trading involves risk and uncertainty.

Coiled Spring Bitcoin is holding structure on the high time frames, currently reclaiming the $90k level after testing the lows. I’ve got my weighted average bands on the chart and price is respecting them so far. You can see on the daily chart how we’ve just poked back above the latest FOMC anchor (the blue line) and are squeezing between that and the breakdown AVWAP overhead. I try not to preempt levels though, I only really care about them once price actually reacts there.
Macro wise, things look decent. Yield curves like the 5y-03m and 10y-03m are positive. We’re seeing a bull steepening, not the textbook version since the 2y is still lower than the 3m, but not a cause for concern.
Other signals I’m tracking:
VIX is stable.
USDJPY is trending up but getting close to resistance, so that’s one to watch.
MOVE index is chilling, down at 63% which is historically a good zone for us.
DXY is high at 98 but trending down.
Credit spreads are super low at 2.84, so no stress there.
TGA is pivoting down now too.
Real yields aren’t doing much since nominals and breakevens are falling together.
Current pricing suggests no cut at the next FOMC, which is fine. But if a cut comes as a surprise that would be very interesting to say the least.

Will Bitcoin Hit $50,000 or $500K In Next Cycle ?Most People Still Don’t Understand What This #Bitcoin Chart Is Saying.
This Is The 12-Month CRYPTOCAP:BTC Structure.
It Has Been Respected For 15 Years.
Every Cycle:
Excess → Reset → Higher Floor → Expansion.
All Called “The End.”
All Were Structural Resets.
Here’s The Part Retail Misses:
Bitcoin Is Now Holding Above Its Previous Cycle High, Historically The Most Bullish Phase Of The Cycle.
That’s Not Optimism.
That’s Market Memory.
No Price Targets.
No Narratives.
Just Structure Doing What It Always Does.
If You’re Waiting For Certainty, You’ll Buy Late.
If You Understand Cycles, You Already Know What Comes Next.
🟠 Bitcoin Doesn’t Need Belief. It Needs Time.
IMO:
2026 For Bitcoin Will Likely Be Bearish, And We Could See Bitcoin Under $50K Based On Previous Fractals And Cycle Analysis.
However, 2027–2028 Could Be Massive For Bitcoin, And We May See $500K Within The Next 4 Years, In My Opinion.
This Is Just My Personal View, Not Financial Advice.
Always DYOR Before Any Investment Decisions.

BITCOIN at a MAKE-OR-BREAK zoneBITCOIN at a MAKE-OR-BREAK zone
CRYPTOCAP:BTC must break $90,000 to unlock the $107,000 upside.
❌ If $90K fails → Downside Opens to $70K–$65K
Technicals Show a Bearish Pennant And Pattern Target: ~$70,000
These levels are CRITICAL. Watch closely.
NFa & DYOR

Litecoin Super potential toward $300?Real Silver is Up +180% YTD 2025 & Digital Silver ( CRYPTOCAP:LTC ) is Down -44% YTD 2025
That Gap is Getting Impossible to Ignore.
When Real Silver is Pumping Hard but Digital Silver is Sleeping, it Usually Doesn’t Last Forever.
If the Rotation Happens in 2026, CRYPTOCAP:LTC at $250–$300 is Very Realistic.
Now Litecoin has One Job: Prove it Truly is Digital Silver.
NFA & DYOR

Bitcoin bearish scenario updateCRYPTOCAP:BTC Update
#Bitcoin is still trading below the key $93K–$94K resistance, so my bearish bias remains unchanged.
As long as price stays below this HTF bearish OB, I’m expecting continuation toward $75,000.
❌ This Bearish scenario only invalidates if we get a strong HTF close above $94,000.
Until then: rallies = selling pressure. Stay disciplined & manage risk.
NFA & DYOR

Shiba inu prediction today As of **December 18, 2025**, **Shiba Inu (SHIB)** trades at approximately **$0.0000075–$0.0000078 USD**, reflecting a **downward trend** with a roughly **4–5% decline** over the past 24 hours and broader weekly losses around **7–9%**.
### Current Market Status
- Live prices from major trackers (e.g., CoinMarketCap, CoinGecko, and recent updates) hover around **$0.0000075–$0.0000078**, with a market cap near **$4.4 billion**.
- Trading volume remains active but in a bearish broader crypto market context, with sentiment indicators showing **extreme fear**.
### Short-Term Prediction for Today
Analysts and technical indicators suggest **continued downward pressure or sideways consolidation** in the very short term (today/intraday).
- Many forecasts point to potential further dips before any rebound, with resistance levels around **$0.000008** and support near **$0.000007**.
- Short-term models (e.g., from CoinCodex and others) predict minor declines or flat movement today, potentially testing lower supports if broader market weakness persists.
- No major catalysts (like significant burns or announcements) appear imminent based on recent news, though whale movements (e.g., large transfers to exchanges) could add selling pressure.
### Key Influences
- **Bearish factors** — Declining trends in moving averages and low burn rates recently.
- **Potential upside** — Ecosystem developments like Shibarium milestones or accumulation signals could spark a bounce, but nothing definitive for today.
Cryptocurrency prices are highly volatile and influenced by overall market conditions (e.g., Bitcoin's performance). This is not financial advice—always DYOR and consider the risks. For real-time updates, check platforms like CoinMarketCap or CoinGecko. 🐕

$BTC: Technical Breakdown (High-Probability Bearish Setup)CRYPTOCAP:BTC : Technical Breakdown (High-Probability Bearish Setup)
Market Structure Shift
Bitcoin has Already lost $107000 major bullish support and is sustaining below it, confirming a bearish market phase.
The Head & Shoulders distribution pattern is fully validated.
Head & Shoulders Measurement
As per classical H&S rules, the 162% extension target of the pattern has already been achieved on the downside, indicating:
🔹 Pattern completion
🔹 Cycle top likely formed
🔹 Transition from bull to bear phase
Fibonacci Retracement (Macro Bear Framework)
Measured from bear-market low → cycle top, Fibonacci levels project:
0.382 Fib: ~$56,700
0.5 Fib: ~$44,000 → key bear market acceptance zone
0.618 Fib: ~$35,000 → strongest macro support / worst-case scenario
Current price action still reflects a healthy macro retracement, not capitulation.
Liquidity & Imbalance
Despite the bearish structure, a Fair Value Gap (FVG) remains unmitigated in the $98,000–$100,000 range.
This level may act as a liquidity magnet before the next impulsive leg down.
Bias & Scenarios
Primary bias: Bearish
Relief rally possibility: $98K–$100K (FVG fill)
Next downside leg: $70K–$60K, then deeper Fib supports
Conclusion
With H&S 162% target completed and structure broken, BTC remains bearish by technical definition.
Trade only with confirmation, manage risk, and respect all valid scenarios.
NFa & DYOR

BTCUSDT Price Action Analysis: Buy/Sell Zones, SL/TP, and Market1. Overall Trend
Your chart shows short-term bullish momentum inside a larger descending structure
(you have drawn a falling wedge / descending channel top).
👉 Short-term: bullish – strong impulsive green candle breaking through multiple intraday levels.
👉 Higher timeframe: bearish resistance overhead – price is approaching the major trendline.
🟢 2. Buy Zones (Bullish Setups)
BUY AREA #1 – Retest of 0.382 / 0.50 Fib Zone (~$90,000–$91,200)
Your strong bullish candle started from this zone.
A pullback back into this demand area = ideal entry.
Why Buy:
Bullish impulse → correction → continuation
Clear demand zone (multiple rejections)
Confluence with your ascending black trendline
Previous consolidation + liquidity grab
Entry:
→ $90,500–$91,200
SL:
→ Below $89,800 (last swing low)
TP1: $92,400
TP2: $93,700
TP3: $94,500 (1.0 Fib + supply zone)
BUY AREA #2 – Break & Retest of $92,465
If price breaks above $92,465 and retests, bullish continuation likely.
Why Buy:
Break of structure (BOS)
Retest of resistance turned support
Strong bullish pressure in previous candle
Entry: After retest & bullish candle confirmation.
SL: Below $92,000
TP: $93,800 / $94,500
🔴 3. Sell Zones (Bearish Setups)
SELL AREA #1 – Major Resistance $93,700–$94,550
Price is currently inside this zone (your dotted blue horizontal line + Fib 1.0).
This is a strong sell zone because:
Why Sell:
Major resistance + 1.0 Fibonacci
Intersection with descending trendline
Previous supply zone
Impulsive move → likely to retrace
Entry:
→ Bearish rejection candle on resistance
(HR wick + small body)
SL:
→ Above $94,800
TP1: $92,400
TP2: $91,200
TP3: $89,800
SELL AREA #2 – Break Below $89,800
If price breaks this key support, we will see strong downside.
Why Sell:
Break of structure
Loss of bullish demand
Below trendline
Entry: Retest of $89,800 from below
SL: Above $90,200
TP: $88,000 / $87,700 liquidity zone
⚠️ 4. No-Trade Zones
Avoid trading in these areas:
NO TRADE ZONE #1 – Between $91,200 and $92,400
Why?
Choppy range
No clear direction
Middle of structure
Poor risk-reward
NO TRADE ZONE #2 – Inside the triangle squeeze before breakout
Price often becomes unpredictable inside a wedge apex.
Wait for break → retest → trade.
📝 5. Summary (Quick Guide)
🟢 BUY
✔ Retest of $90,500–$91,200
✔ Break & retest of $92,465
🔴 SELL
✔ Rejection from $93,700–$94,550
✔ Break & retest of $89,800
🛑 NO TRADE
⚠ Between $91,200–$92,400
⚠ Inside wedge compression area

PRICE ACTION ANALYSIS OF YOUR CHART (BTCUSDT)PRICE ACTION ANALYSIS OF YOUR CHART (BTCUSDT)
🟢 BUY SETUP (Bullish Scenario)
1️⃣ BUY ENTRY #1 — Break & Retest of 92,240 – 92,500 Zone
This zone is a major resistance.
A breakout above it confirms strong bullish momentum.
📌 ENTRY
Buy: 92,300 – 92,450
(After a breakout + retest candle, not inside consolidation)
📌 STOP LOSS (SL)
SL below retest zone: 91,700
📌 TAKE PROFIT (TP)
TP1 → 94,000 – 94,200
TP2 → 95,800
TP3 → 97,100
📌 PRICE ACTION REASON
Structure break above major resistance
Trendline break confirmation
Higher-high formation
Large liquidity zone above (clean traffic)
2️⃣ BUY ENTRY #2 — Pullback Into 90,300 Support
Your chart shows a horizontal blue line near 90,300–90,130.
📌 ENTRY
Buy at: 90,300 – 90,150
(Wait for bullish rejection wick)
📌 STOP LOSS
SL below structure: 89,800
📌 TAKE PROFIT
TP1 → 91,200
TP2 → 92,300
TP3 → 94,000
📌 PRICE ACTION REASON
Support formed around previous accumulation zone
Fake-out followed by impulse up (bullish sign)
Price respecting trendline + horizontal support
🔴 SELL SETUP (Bearish Scenario)
The red arrows on your chart highlight bearish continuation levels.
1️⃣ SELL ENTRY #1 — Break & Retest of 89,200 Zone (Major Level)
Price repeatedly reacts to this purple level → strong liquidity.
📌 ENTRY
Sell at: 89,200 – 89,100
(After bearish retest rejection)
📌 STOP LOSS
SL above level: 89,500
📌 TAKE PROFIT
TP1 → 88,200
TP2 → 87,000
TP3 → 86,700 (trendline bottom)
📌 PRICE ACTION REASON
Loss of support → becoming resistance
Bearish market structure (lower highs)
Clean traffic to downside (no strong support until next purple line)
2️⃣ SELL ENTRY #2 — Pullback to 90,300 Becomes Resistance
If the 90,300 level breaks DOWN, it becomes a good sell zone on retest.
📌 ENTRY
Sell at: 90,200–90,350
(Only if retested as resistance)
📌 STOP LOSS
SL: 90,700
📌 TAKE PROFIT
TP1 → 89,200
TP2 → 88,200
TP3 → 87,000
📌 PRICE ACTION REASON
Role reversal: support → resistance
Continuation in bearish channel
Lower-high formation
🟡 NO-TRADE ZONE
Avoid trading inside the black descending channel mid-area, especially around:
❌ 90,800 – 91,400
Because:
Price is choppy
Weak volume area
No clean structure
High chance of fake breakouts
Wait for clear breakout or breakdown.

BTC Breakdown Confirmed – Here’s Where BTC Could Surge NextBTC Breakdown Confirmed – Here’s Where BTC Could Surge Next
1️⃣ Long-Term Trendline Breakdown Confirmed
🔹 BTC has decisively broken the multi-year ascending trendline supporting price since Nov 2022.
🔹 The Breakdown + Retest at ~$104k-$108k confirms bearish structure ✅.
🔹 Retest failed in Oct 2025, confirming sellers are in control.
2️⃣ Fibonacci Levels Highlight Strong Demand
🔹 Price is now hovering between 0 Fib ($125,647) and 0.382 Fib ($56,494).
🔹 Measured move Targets: Strong Demand Zone $34,477 - $56,494 (0.618 - 0.382 Fib)
🔹 This is the accumulation zone for long-term positions, historically providing strong bounce potential.
3️⃣ Critical Support / Resistance Zones
🔹 Immediate Support: $85k-$87k (psychological)
Major Support:
🔹 $56,494 (0.382 Fib, upper demand)
🔹 $44,133 (0.5 Fib, middle demand)
🔹 $34,477 (0.618 Fib, “Golden Pocket”, lower demand)
Resistance: Broken trendline now acting as key supply
4️⃣ Potential Scenarios
Bearish (High Probability)
🔹 Continuation down to Strong Demand Zone ($34k-$56k)
🔹 Represents 38-61% retracement from ATH, typical after trendline breakdown + retest
Bullish (Needs Reclaim)
🔹 Reclaim broken trendline (~$95k-$100k)
🔹 Close above $104k = false breakdown, continuation to new highs
Why I’m Watching $56,500 - $34,500 for Longs
🔹 Historical accumulation zone with high probability of a strong bounce
🔹 After breakdown + retest, price often retraces to 0.5 or 0.618 Fib before resuming bull trend
🔹 Perfect long-term entry for those aiming for multi-year BTC upside
BTC may test the $56k-$34k demand zone soon. For long-term holders, this is a prime accumulation area before the next bull cycle. Stay patient and strategic – $1M BTC dreams require discipline, not FOMO.
Guys, don’t judge me: I’m a Bitcoin lover too. I’m just reading what the chart is showing. Even if the short-term looks bearish, I see the setup for a massive long-term move toward $1M 🚀
NFA & DYOR

BTCUSD – Buy/Sell Zones + No-Trade Zone Here is a clean, price-action based analysis of your chart with:
✅ Buy zones
❌ Sell zones
🚫 No-trade zone
🎯 TP levels
🛑 SL levels
📌 Overall Market Condition
BTCUSDT is moving inside a big consolidation range.
The zone you highlighted is correct — NO TRADE AREA — because price is stuck in a sideways block with no directional confirmation.
🚫 NO TRADE ZONE
Price: 91,800 – 92,500 USDT
Reason:
Choppy structure
No direction
Liquidity building
Dangerous to open positions inside the block
🔔 Wait for breakout and retest confirmation only.
⬆️ BUY SETUPS (LONG ENTRIES)
1️⃣ Breakout Buy
Buy above → 94,250
📌 Conditions:
Candle must close above the level
Retest + bullish confirmation
🎯 TP targets (Upside green arrows)
TP1 → 96,850
TP2 → 99,640
TP3 → 100,970 (major resistance)
🛑 SL:
Below 93,700 (safe stop)
2️⃣ Pullback Buy (from lower demand)
Buy near → 89,700 – 90,000
This is first strong demand after breakdown.
🎯 TP:
TP1 → 92,300 (back to no-trade zone)
TP2 → 94,250
🛑 SL:
Below 89,150
⬇️ SELL SETUPS (SHORT ENTRIES)
1️⃣ Sell breakdown below support
Sell below → 89,700
🎯 TP levels (red arrows)
TP1 → 88,820
TP2 → 86,140
TP3 → 81,950
TP4 → 79,330 (final target)
🛑 SL:
Above 90,200
2️⃣ Pullback Sell
If price breaks below 89,700, then returns to retest:
Sell zone: 89,700 → 90,000
Confirm rejection wick.
🎯 TP:
Same as above
86,140 → 81,950 → 79,330
🛑 SL:
Above 90,300
📌 FINAL SUMMARY TABLE
Setup Entry TP SL
Breakout Buy Above 94,250 96,850 → 99,640 → 100,970 93,700
Pullback Buy 89,700 – 90,000 92,300 → 94,250 89,150
Breakdown Sell Below 89,700 88,820 → 86,140 → 81,950 → 79,330 90,200
Pullback Sell Retest 89,700 – 90,000 Same as above 90,300
No-Trade Zone 91,800 – 92,500

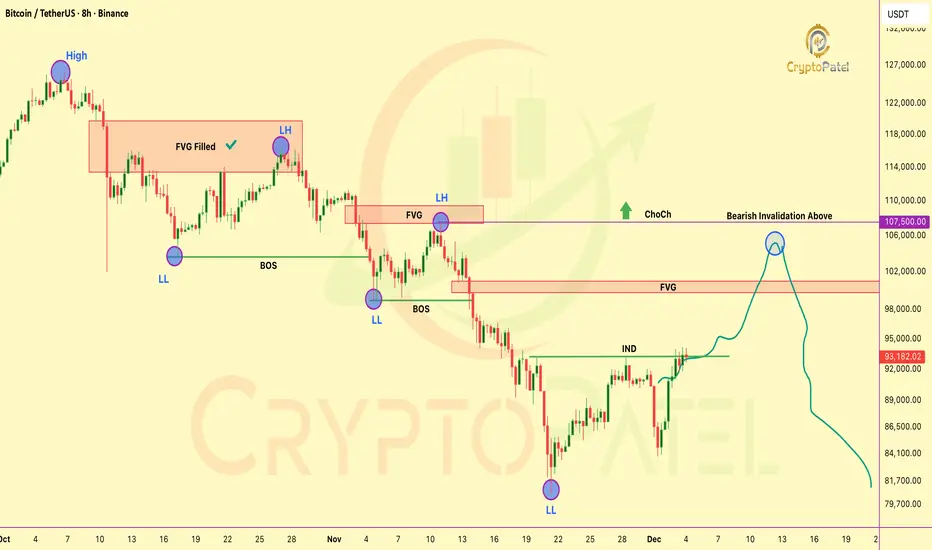
HTF ChoCH Alert: BTC’s Macro Bias Is Still BearishHTF ChoCH Alert: BTC’s Macro Bias Is Still Bearish
BTC is still following clean HTF bearish order-flow (LH → LL → BOS).
The current push up is just a premium retracement, driven by internal liquidity grabs.
Price is reaching for the premium FVG at 99,866–101,184, the next clear draw on liquidity and a prime reversal zone.
Below 107,500 bias stays bearish (Bearish Invalidation / HTF ChoCH)
Expect: BSL sweep → FVG fill → mitigation → sell-side continuation.
ICT view:
Market is simply rebalancing inefficiency before delivering lower.
NFA & DYOR
Buy Setup (Safer After Pullback)✅ Buy Setup (Safer After Pullback)
Because price already pumped hard, the safe buy is after a retracement — not at the top.
Buy Entry
👉 Buy: 92,820 – 92,900 retest zone
(Price must retest old resistance → new support)
Targets
TP1: 93,600
TP2: 94,400
TP3: 95,480 (major resistance)
Stop-Loss
SL: 92,300
(Below breakout structure)
❌ Sell Setup (Countertrend – aggressive)
Only if price rejects sharply from resistance.
Sell Entry
👉 Sell around: 93,300 – 93,500 rejection area
(You already have a wick rejection forming)
Targets
TP1: 92,820
TP2: 91,950
TP3: 90,374 Monday High
Stop-Loss
SL: 93,900
(Close above this breaks bearish idea)
🎯 Summary
Direction Condition Entry TP SL
BUY Retest & hold 92,820 92,820–92,900 93,600 → 94,400 → 95,480 92,300
SELL Rejection from 93,300–93,500 93,300–93,500 92,820 → 91,950 → 90,374 93,900
⭐ My View
Market is bullish, so buy on retracement is the safer and higher-probability trade.

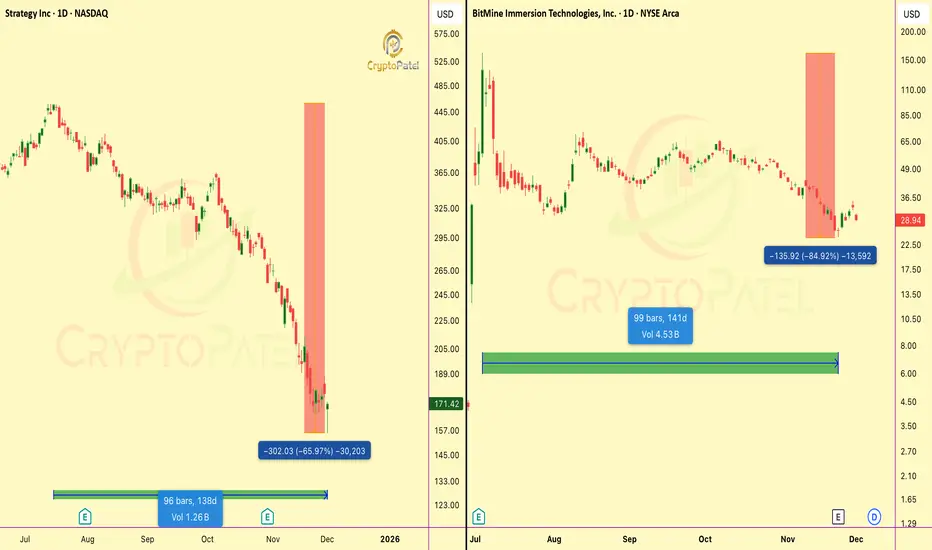
TOP TREASURY COMPANIES BLOODBATHTOP TREASURY COMPANIES BLOODBATH
👉 NASDAQ:MSTR : -64% from ATH ($457→$156) ( BITCOIN TOP HOLDER)
👉 AMEX:BMNR : -82% from peak ($161→$25) (ETHEREUM TOP HOLDER)
Is this capitulation or just the beginning?
NFA & DYOR
BTCUSD – Key Level Rejection with Potential Liquidity Sweep TowaChart Analysis
1. Price Context
BTCUSD is trading around $90,675.
The chart shows price rejecting the Key Level and failing to hold above the Daily CLS (daily close level).
Recent candles indicate loss of bullish momentum with a series of lower highs forming.
2. Key Zones on Your Chart
🔴 Daily CLS (Resistance)
Marked in red.
Price tried to break and hold above this level but rejected, showing it is acting as strong overhead resistance.
The shaded gray area above looks like the stop-loss zone for shorts, suggesting a bearish setup.
🟢 Key Level
Marked slightly below the Daily CLS.
Price broke above it earlier but is now retesting from the top, failing to reclaim.
This retest-rejection pattern signals a shift from bullish to bearish sentiment.
3. Trade Bias Indicated by the Chart
Your marked zone suggests a short position setup:
Entry around current price or just under the Key Level.
Stop-loss in the gray shaded box above the Daily CLS.
Take Profit 1 at 50% CLS TP1, a midpoint liquidity target.
Final TP near the green support at the bottom.
This structure reflects a liquidity-based short setup, expecting:
A sweep of local highs → rejection → push down to fill inefficiencies or revisit liquidity pools below.
4. Market Structure
Price printed a strong move up earlier, leaving inefficiency below.
Now forming lower highs and lower lows on the lower timeframe.
Hold below Key Level suggests continuation downward.
5. Bearish Confirmation Signals
✔ Failure to hold above Daily CLS
✔ Break of Key Level and retest as resistance
✔ Weak bullish follow-through
✔ Liquidity target below at 50% CLS

ETH Could Skyrocket to $7.8K After FUSAKA Upgrade: History ShowsCRYPTOCAP:ETH Could Skyrocket to $7.8K After FUSAKA Upgrade – History Shows
The last Ethereum Pectra Upgrade on 7 May 2025 triggered a massive move:
✅ +55% in 35 days
✅ +168% in 109 days
What’s next?
The FUSAKA Upgrade is scheduled for 3 December 2025. If history repeats:
👉 Target 35 days post-upgrade: $4,500 (7 Jan 2026)
👉 Target 109 days post-upgrade: $7,800 (22 Mar 2026)
Note: This is Purely Fractal Analysis Based on Pectra. Always DYOR – Markets can behave differently, and “Sell the News” Scenarios Happen.
Get ready for a potential ETHEREUM rally!
NFA & DYOR

Biggest Altseason 10x-20x Loading for 2026?If You're Panicking Right Now, You're About To Miss The Easiest 5x-20x Of Your Life
The Total Market Cap (excluding BTC & ETH) just painted a picture we've seen before...
HISTORICAL CONTEXT:
Last bull run → 1200% pump after breakout & retest
Current situation → Long-term trendline support broken
This looks like a classic liquidity sweep before the next major leg up.
KEY LEVELS TO WATCH:
🔴 Strong Support: $750B - $600B
🟡 Strong Resistance: $1.1T
🟢 2026 Target: $4.25T
THE MATH:
If we hit that Target, we're looking at a 5x on total alt market cap
Individual Altcoins could Easily do:
Quality projects: 5x-10x
High potential gems: 10x-20x
Moonshots: Beyond 20x
MY TAKE:
This current "Crash" is NOT the beginning of a Bear Market. It's a shakeout. Big money is accumulating while retail panics.
The setup is almost identical to previous cycles:
✅ Panic selling at support
✅ Fear at maximum levels
✅ Long-term holders getting shaken out
This is exactly when you want to be positioning for the REAL altseason ahead.
RISK MANAGEMENT:
DCA at support zones ($750B-$600B)
Don't go all-in at once
Keep some powder dry for further dips
Focus on fundamentally strong projects
The biggest gains come to those who stay calm when others panic.
Are you ready for what's coming? 🚀
Not financial advice. DYOR. Manage your risk.

Bitcoin Ready to hit New Low?BITCOIN QUICK UPDATE: LEVELS PLAYING OUT EXACTLY AS EXPECTED
As we mentioned earlier, the $88,600 FVG has now been fully filled, and CRYPTOCAP:BTC is currently trading below that zone.
Here’s what matters next:
🔹 If $85,000 holds as support → BTC likely pushes toward the next major Bearish Order Block at ~$93,000.
High probability this zone gets tapped.
🔹 If BTC fails to reclaim and break above $88,000 → expect a deeper leg down toward ~$75,000.
Stay sharp. NFA.

Bitcoin Monthly Support Test — Next Target $58,419 ?Key support sits at $81,933. A clean break and close below this zone could expose Bitcoin to a deeper retracement toward the next major support around $58,419.
However, $81,933 is also a strong monthly support level, so the market’s reaction here is critical.
Keep an eye on whether this level holds or fails — it will likely dictate the next major move.
Share your view in the comments: Do you think BTC will defend this monthly support, or are we heading lower?
