BTCUSD Long Setup – Trend Continuation Play📌 Trade Details
Entry: 113,256.5
Target: 115,317.7
Stop Loss: 111,874.4
📊 Trade Rationale
✅ Trend Continuation: Price has respected the ascending trendline multiple times, indicating strong buyer interest.
✅ Break of Structure: Recent higher highs and higher lows confirm bullish momentum.
✅ Support Flip: Zone around 113,050 acted as resistance earlier and is now being retested as support.
✅ Volume Confirmation: Rising volume supports the bullish continuation bias.
✅ Clean Risk–Reward: With SL below structure and TP near major resistance, this setup offers a favorable RRR.
🎯 Target Zone
The target aligns with the next strong supply zone at 115,300+, where sellers may re-enter.
⚠️ Risk Management
Always size positions wisely, as crypto remains highly volatile. Protect your capital first.
Disclaimer:
This idea is for educational purposes only and not financial advice. Do your own research before entering any trade.
BTCUSDT

BTCUSD – Short Opportunity Building 30m Chart1. Price rejected from the supply zone near 115,700–115,800, showing resistance.
2. Current structure has shifted bearish with lower highs after rejection.
3. Key intraday support stands at 115,100–115,000; a sustained break below could accelerate downside.
4. Next demand levels to watch: 114,280 and 114,116, aligning with liquidity zones.
📉 Plan:
Short entries remain valid below 115,300.
First target: 114,280
Extended target: 114,116
Invalidation above 115,800.
Recommendation: Monitor for clean bearish continuation; keep risk tight due to BTC volatility.

BTC Consolidating, Ready to Blast Towards 130K?BTC/USDT is still holding within its uptrend channel , with strong support around 112.3K and key resistance at 123K–125K. After hitting an all-time high near 124.5K, the price pulled back to 112–115K for consolidation, building a base for the next rally.
On the news side, the market is getting strong support as the US officially allows Bitcoin in 401(k) retirement plans and has set up a Strategic Bitcoin Reserve . At the same time, spot Bitcoin ETFs continue to attract massive inflows, pushing total assets above $150 billion in just 18 months. This shows rising institutional confidence, despite short-term corrections.
The preferred scenario now is to look for buy opportunities around 112–115K , targeting a rebound to 123–125K, and if that breaks, the next destination could be 130–135K.
On the flip side, a defensive strategy should be considered if BTC falls below 110K, as this is a crucial level for maintaining the medium-term uptrend.

BTCUSDT: Holding Support, Waiting for a Breakout to 127,500Bitcoin continues to move within an uptrend structure, with the 112,200 USDT zone acting as a key support, aligning with the ascending trendline. The repeated rebounds from this level indicate that buying pressure remains steady.
On the upside, the 127,500 USDT zone stands as a strong resistance that must be broken to extend the bullish momentum. As the price approaches this area, traders should closely monitor the reaction to determine whether a breakout or a short-term pullback will occur.
Overall, the technical structure still favors the bulls. A sensible strategy is to accumulate during retracements around 112,200 – 114,000, and hold positions for a short-term target at 127,500. If this level is breached, the bullish wave will be further reinforced.

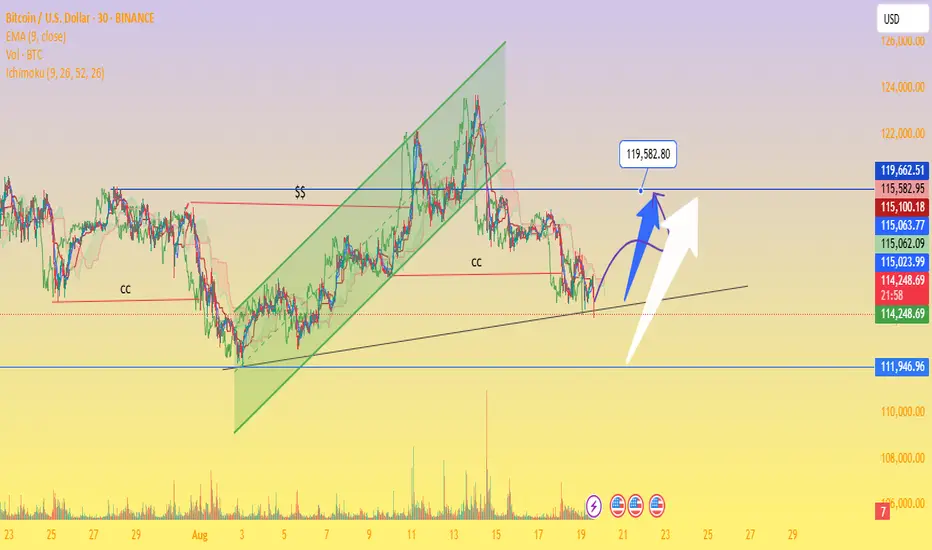
Bitcoin at a Critical Support – Breakout Toward $119K or ?Ascending Channel Breakdown – Price previously respected a rising green channel but broke below, showing weakness.
Critical Support Zone: Around $111,946 – $114,000 (black trendline + yellow support area).
Resistance Levels:
Near-term: $115,100 – $115,582
Strong: $119,582 (highlighted as major upside target)
Volume Profile: Declining volume with recent dip → signals possible accumulation before the next move.
Ichimoku Cloud: Price is slightly below cloud, indicating short-term bearish bias but with potential rebound if reclaimed.
Scenarios:
Bullish Case (Blue/White Arrows): If BTC holds above $114,000 support and breaks $115,500, a rally toward $119,500+ is possible.
Bearish Case: Failure to hold $114,000 may trigger a drop toward $111,946 (major demand zone).
BTCUSDT: Continued Growth in the Short TermBTCUSDT is currently trading within a stable price range, with a clear uptrend channel forming. After bouncing off the strong support at 116,000 USD, BTCUSDT is likely to continue its bullish momentum, with the first target set at 123,000 USD.
The latest news from the cryptocurrency market shows a growing confidence in Bitcoin, driven by positive signals from major financial institutions. Recent price corrections have created good buying opportunities for investors. The global economic situation, particularly the weakening of the USD and increasing institutional adoption of Bitcoin, is driving BTC's value higher.
Trading Strategy:
Buy: Enter a buy position when the price approaches the 116,000 USD support level again or breaks above 117,000 USD.
Stop-loss: Set a stop-loss below the 116,000 USD support level to protect in case of a reversal.
With the current market structure and supportive factors from both news and technical analysis, the bullish trend of BTCUSDT is highly likely to continue in the near term.

$BTC at make-or-break zoneCRYPTOCAP:BTC at make-or-break zone
Holding above $116K = bullish reaction likely → next leg higher Toward New ATH
Losing this support = bearish breakdown → eyes shift to $100K liquidity pool.
Market structure is clear: support defends or capitulation begins.

BTCUSDT – Continuing the Uptrend, Targeting 124,000 USDBTCUSDT continues its strong uptrend, with price moving within a stable ascending channel. The nearest support is at 116,900 USD, where the price has bounced and maintained its upward momentum. Recent fundamental factors, including rising demand and positive market sentiment towards Bitcoin, are driving this growth. The next target for BTCUSDT is the resistance zone at 124,000 USD. If this level is broken, BTC could move towards 135,000 USD.
Trading Strategy: Buy when the price tests support at 116,900 USD and wait for confirmation of continued upward movement. The target is 124,000 USD, and beyond that, 135,000 USD. Place a stop-loss below 116,000 USD. As long as the price remains above 116,900 USD, the uptrend remains intact.

BTCUSDT – Uptrend ContinuesThe chart shows that Bitcoin (BTC) is moving within a strong ascending channel , with strong support at 117,300 USD. The current pattern indicates that each time the price tests this support level, BTC bounces back strongly, showing that buying pressure is dominant. The price has continuously broken through key resistance levels and is now heading towards 130,000 USD , where it may encounter strong resistance .
Regarding the news, although there are no direct events impacting Bitcoin today, the global cryptocurrency market continues to benefit from the stability of other risk assets and growing interest in assets like Bitcoin. Expectations for cryptocurrency adoption in major countries and the increase in Bitcoin investment funds are also driving the uptrend.
Currently, BTC is facing resistance at 3,407 USD, and if it breaks through successfully, it could continue to rise towards 3,450 USD. However, strong support remains at 3,330 USD, which could lead to a bounce if there is a minor pullback.
Strategy:
Buy around 117,300 USD, with a target of 130,000 USD.
Stop loss below 117,000 USD to protect the position in case the support is broken.

Will TRON hit $1 Club?TRON rise has been nothing short of epic.
From $0.0068 at launch to $0.36 today, over 50x growth.
$1 isn’t a dream anymore… it’s getting closer every day.
Who’s ready for CRYPTOCAP:TRX to crash into the $1 club? 🚀
NFA & DYOR

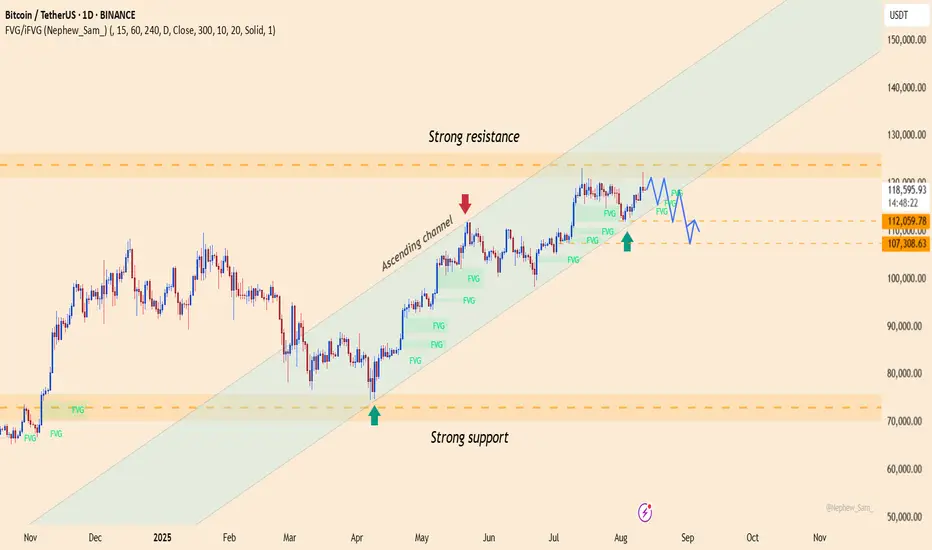
BTCUSDT – Bulls Maintain Control, Upside Scenario IntactOver the past two days , the crypto market has been supported by a series of positive developments: yesterday, U.S. PPI data cooled, easing inflationary pressure and strengthening expectations that the Fed may soon cut interest rates; today, global risk sentiment improved as U.S. and European stock indices rebounded; and most recently, Bitcoin ETF inflows continued to post net gains, signaling that institutional investors remain confident in the bullish trend.
On the daily chart , BTC is still moving within an ascending channel, with a strong resistance zone around 121,000 – 122,000 USDT. Currently, the price is consolidating right near the upper boundary of the channel, showing that buying pressure remains in control. The strong support zone lies between 112,000 – 110,000 USDT, aligning with the channel’s lower boundary.
Preferred strategy: look for buying opportunities if the price pulls back toward 112,000 – 110,000 USDT, targeting a return to 121,000 USDT and potentially new highs. The bullish trend remains intact as long as the price stays within this ascending channel.
BTCUSDT – pressure building before the breakoutMarket context:
US trade policy eases restrictions for certain major tech companies → risk appetite improves.
Expectations of a more dovish Fed → capital flows return to the crypto market.
Sentiment & flows:
Short-term Bitcoin holdings increase by around 20 billion USD → trading activity is heating up, but profit-taking pressure is also building.
Investors are closely watching the 116,000 USDT level before adding aggressive long positions.
8H technicals:
Support: 112,600 USDT – a zone that has repeatedly triggered rebounds, maintaining the bullish structure.
Resistance: 116,000 USDT – the “gate” that could open the way to 123,000 USDT.
Bullish scenario remains favored if price closes above 116,000 USDT with confirming volume.
Key takeaway:
The market feels like it’s “winding the spring” – tight consolidation before a potential breakout.
A break below 112,600 USDT would invalidate the short-term bullish view and increase the risk of a deeper pullback.

Bitcoin targets $133,000 with institutional capital inflowsBitcoin is currently trading in an upward channel, forming higher highs and higher lows, indicating a strong bullish trend.
Capital inflows from major financial institutions like JPMorgan and Citigroup are increasing into BTC, combined with expectations that the Fed will cut interest rates in September, providing positive momentum for the price. The Trump administration's cryptocurrency policies and Syz Capital reopening its BTC Alpha fund with 2,000 BTC have driven strong participation from institutional investors.
Technically, BTC has bounced off the support at $112,816 and could continue toward the resistance at $119,249. A break above this level could set the next target at $133,000 by the end of 2025. Investors should carefully monitor signals and manage risk accordingly.

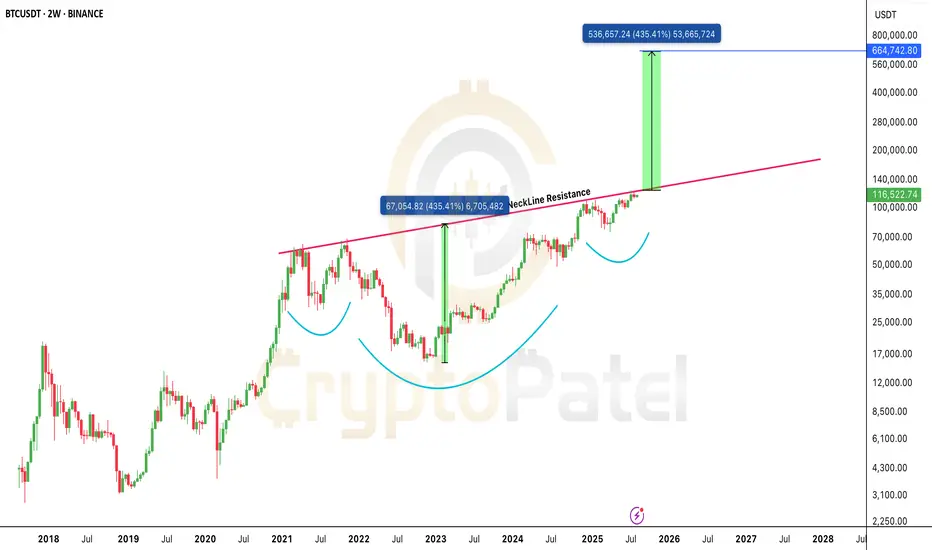
Bitcoin’s $664K Target Is Not a Joke: It’s a Chart-Based WarBitcoin is forming a massive macro structure and the neckline is the final barrier.
Break above it, and the technical target stretches to $664,000.
Yes, you read that right.
This isn’t hopium. It’s based on measured move projections from the breakout zone.
The only question now:
Does BTC explode to $664K this cycle… or in the next?
One breakout changes everything.
Watch the neckline. Stay focused.
Note: NFa & DYOR
BTCUSDT – Institutional Money Returns, Signs of a Strong ReboundBitcoin is showing positive recovery signals as major capital flows are re-entering the market. Notably, Syz Capital has successfully raised $200 million to invest in BTC – a strong indicator of growing long-term confidence from institutional investors.
On the H8 chart, BTC remains in a downtrend channel but is forming an accumulation pattern around the 111,000 USDT support area. Previous FVG zones have been filled, suggesting buying pressure is absorbing supply well. Volume is also slightly increasing at the lows – indicating selling pressure is weakening.
If BTC holds above 111,000, a move toward 117,500 is likely, with potential to reach 120,000 if it breaks above the descending channel. This would confirm a clearer medium-term uptrend.

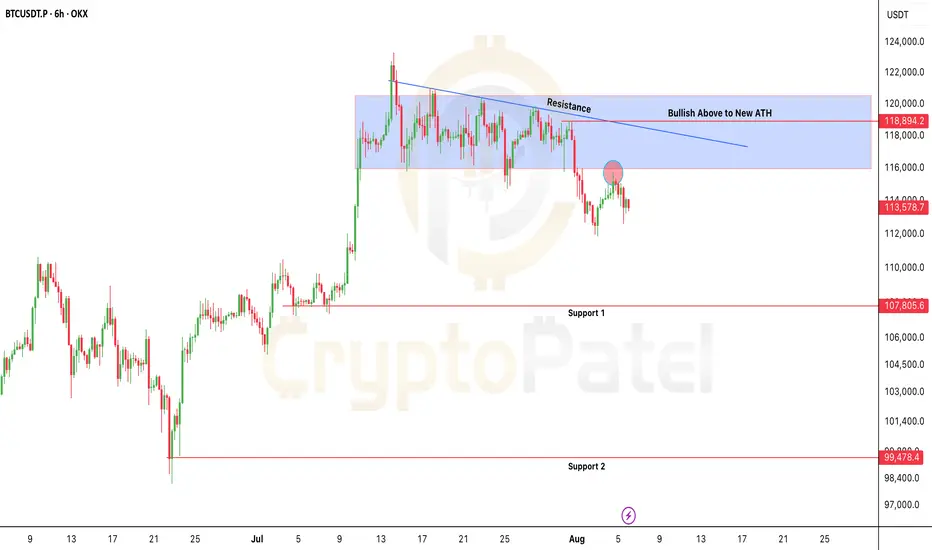
Bitcoin at Risk: $115.7K Is the Line Between Bounce or BreakdownBitcoin at Risk: $115.7K Is the Line Between Bounce or Breakdown
CRYPTOCAP:BTC is trading below key resistance ($115.7K–$118.9K) and rejected cleanly at the trendline.
As long as price holds below $115,700, bearish bias remains.
⚠️ Failure to reclaim = high risk of breakdown toward $107K and even sub-$100K levels.
Bearish invalidation only above $119K
NFA & DYOR
BTCUSDT – Bullish trend remains intactBitcoin is still trading within a long-term ascending channel. After a mild pullback to the FVG zone around 112,100 USDT, the price rebounded and is now consolidating above the ascending trendline support. If this level holds, BTC is likely to continue toward the upper channel target at 122,500 USDT.
Recent news supporting the uptrend:
Fidelity and BlackRock have continued accumulating Bitcoin-related ETF shares.
Weak US jobs data has fueled expectations of a Fed rate cut, drawing capital back into crypto.
Ethereum's upcoming hard fork upgrade is boosting overall market sentiment.
With both technical structure and fundamentals aligned, BTC remains bullish as long as it stays above 112,100.

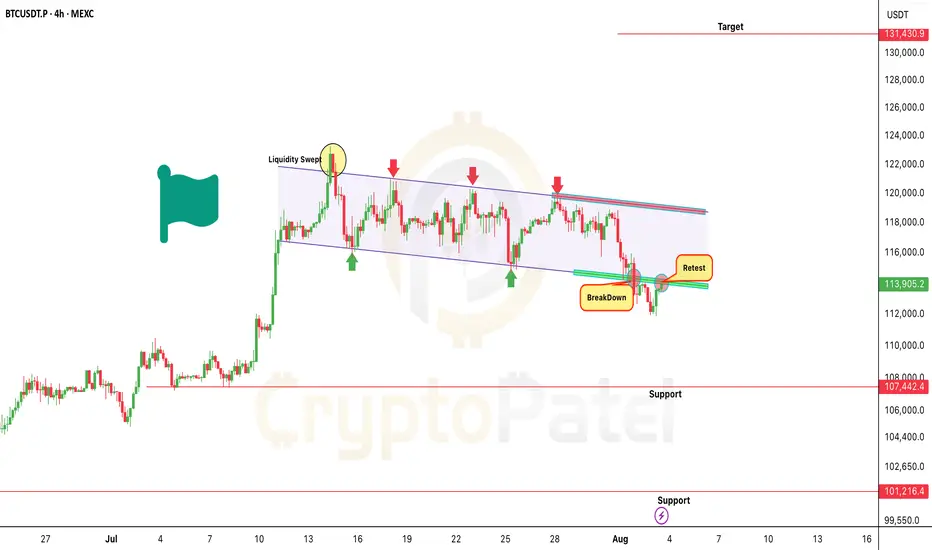
Bitcoin Breakdown or Bull Trap? $100K or $131KAs previously shared CRYPTOCAP:BTC had a potential to tap $114K when it was around $120K.
But now, $114K support has broken, and price is currently trading in the bearish retest zone post-breakdown.
Bearish Targets: $107,000/$101,000
Important Note:
Watch $115,700 zone closely- This could be a liquidity sweep trap.
If any HTF candle (4H/D) closes strongly above $115,700, it invalidates the bearish structure and may flip into a bull flag breakout.
Key Levels:
Bullish Flip Zone: $115,700 (Close Above HTF = Exit Shorts)
Trend Reversal Trigger: HTF close above $119,000 → Can open door to $131,000
Remember:
Trade with confirmation, not assumption.
Always respect key levels and adapt if market structure shifts.
NFA & DYOR
Urgent Bitcoin Update: BTC Must Hold $110K🚨 Urgent Bitcoin Update: BTC Must Hold $110K – Or Risk Dropping Below $100K
BTC is trading near $113,900, sitting right on key support at $112K–$110K.
This zone is crucial- Holding it could lead to a rally toward $150K ATH.
But if BTC breaks below $110K, expect downside pressure with possible moves to: $100K / $93K / $83K
Price has also broken below the ascending trendline- a bearish sign unless bulls step in.
I mentioned exiting around $122K–$123K: Hope you booked profits ✅
Now, just observe how BTC reacts between $110K–$112K.
Note: NFA & DYOR

BTCUSDT – Bitcoin consolidates amid silent institutional buying Bitcoin is fluctuating between 114K and 116K USDT within a long-term ascending channel, supported by a wave of positive news. Weaker-than-expected U.S. labor data has fueled hopes that the Fed may pause its rate hikes — boosting sentiment for risk assets like BTC.
At the same time, major regulatory developments such as the SEC’s “Project Crypto” and the GENIUS Act by the CFTC are laying the groundwork for legalizing the crypto market. Notably, over 30,000 BTC were accumulated by MicroStrategy and institutional funds within just 48 hours — signaling strong capital inflows.
On the daily chart, BTC is forming an inverse cup-and-handle pattern, with 107,280 acting as key support. If the price holds and breaks above 120,872 USDT, a rally toward 130K may follow. However, if inflows weaken, a short-term pullback toward 112K could occur before the next upward move.

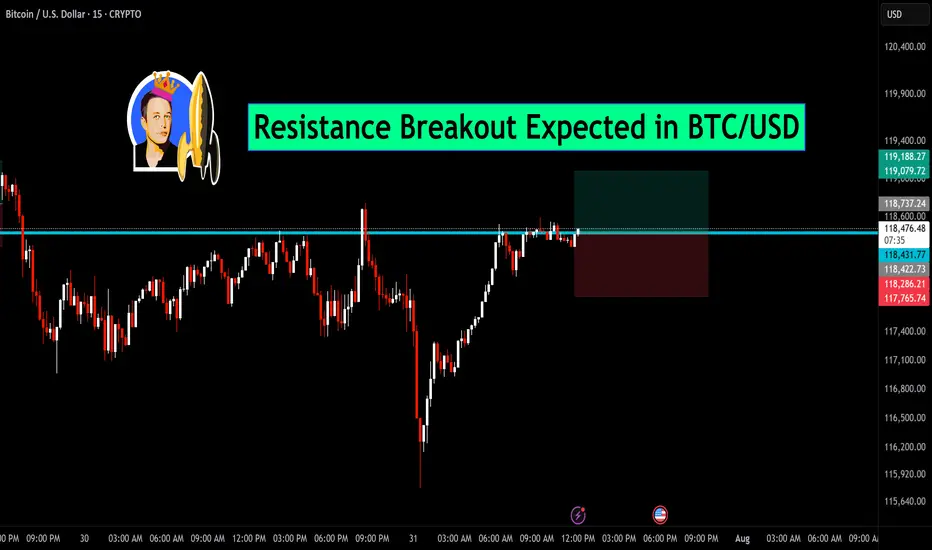
Resistance Breakout Expected in BTC/USDBitcoin is currently testing a key horizontal resistance near the $118,600 zone. After a sharp recovery from recent lows, the price is consolidating just below this level, indicating a potential breakout.
🔍 Chart Insights:
Price action forming higher lows, showing strength.
Breakout above the marked resistance may trigger a strong bullish move.
Tight consolidation near resistance suggests bulls are preparing for a push higher.
📈 Trade Setup:
Entry: Above $118,600 breakout
Target: $119,188 and beyond
Stop-loss: Below $118,200
If price sustains above resistance with volume confirmation, BTC/USD could witness fresh momentum on the upside. Stay alert for the breakout candle.
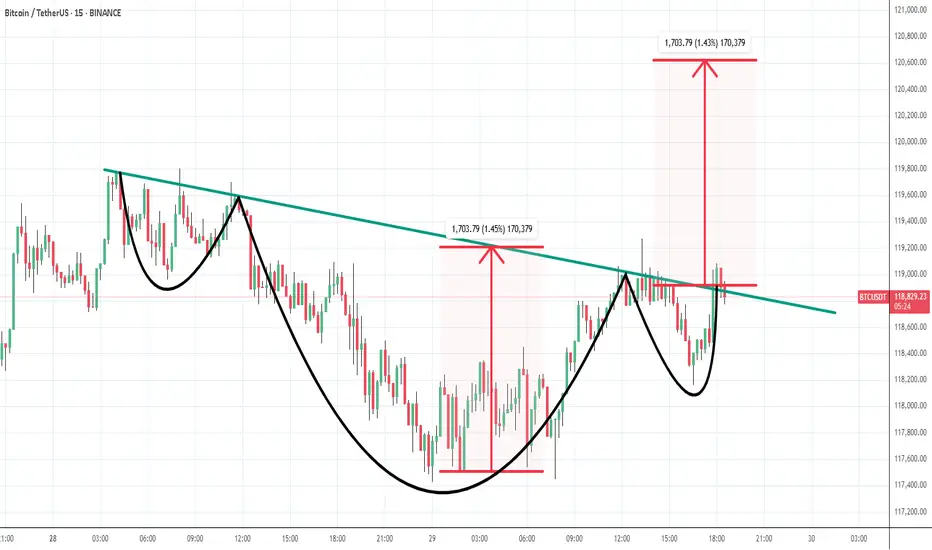
BTC - TP 120600 based on Cup & Handle - 29th July 2025price seems to have completed minor second wave of the major 5th wave up move now.
and chart clearly showing cup and shoulder pattern and once price sustain above neck line and start moving price will hit and may move above 120600 level as per this pattern which mostly work.
BTCUSDT – short-term pullback before heading higherBTCUSDT remains within a clear ascending channel. On the H8 timeframe, price is facing resistance and may pull back toward lower support before continuing its upward move. Several Fair Value Gaps below act as strong backing zones for buyers.
On the news side, market sentiment is improving as investors anticipate the upcoming PCE report and renewed interest in Bitcoin ETFs. Although the Fed holds its hawkish tone, rising recession risks are fueling expectations of a rate cut later this year.
Strategy: Consider BUY setups if price pulls back into support and shows strong reaction. Trend remains bullish unless the ascending structure is broken.
