BTC Traders: Crucial Levels Incoming 🚨 BTC Traders: Crucial Levels Incoming 👇
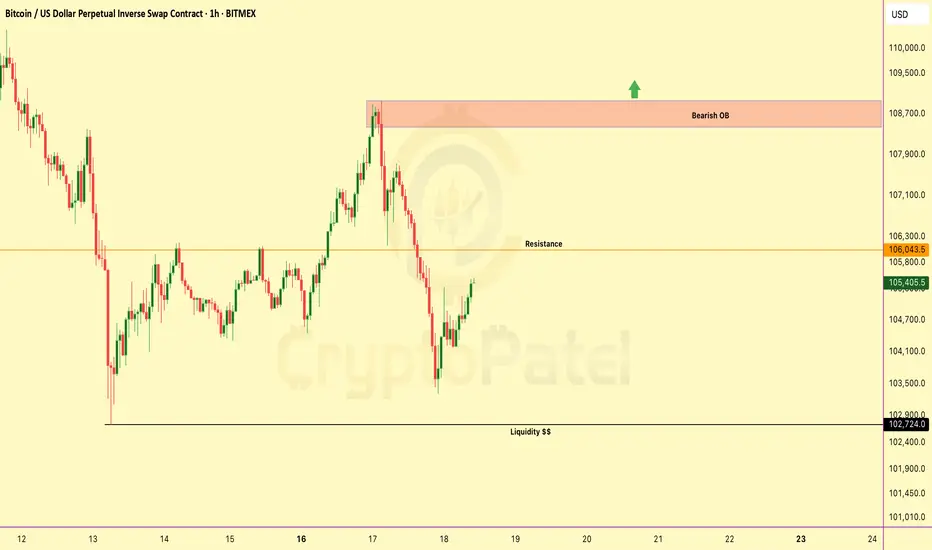
Bitcoin is hovering around $105,399 — and things are heating up.
$106K = Resistance.
A clean break could send us to the Bearish Order Block ($108K–$108.95K).
But here’s the danger zone:
🟥 OB = Last drop's origin.
Rejection here = major sell-off risk.
🔻 $102K = Liquidity pool.
Lose this level, and sub-$100K is on the table.
Current Bias:
– Hold below OB = Bearish
– Reclaim OB = Relief bounce
– Drop below $102K = Trend Accelerates Down
What’s your game plan here?
💬 Comment your next move
🔁 Retweet if useful
🔖 Bookmark for later
BTCUSDT

Bitcoin Ready to Blast or Waiting under $100k?BTC is currently trading near $105,399, showing a corrective bounce after a recent sell-off.
Resistance Ahead – $106k:
Price is approaching a key resistance level. A break above could lead to a short-term move toward the Bearish Order Block at $108000–$108950.
🟥 Bearish Order Block (OB):
This is the supply zone that initiated the previous drop. If price fails to break and hold above this OB, we could see renewed selling pressure and continuation of the downtrend.
🔻 Liquidity Pool – $102k:
This level holds resting sell-side liquidity. A failure to hold this area may trigger a sweep — and if $102K breaks, it could unlock deeper downside potential, possibly sending BTC below $100K.
Summary Outlook:
▪️ Rejection from OB = strong bearish continuation
▪️ Break of $106K = short-term bullish move toward OB
▪️ Break of $102K = high probability of sub-$100K levels
▪️ Overall bias remains bearish unless price reclaims and holds above the OB zone with strength.
NFA & DYOR
BTCUSDT – Selling Pressure is IncreasingThe price is retesting a strong resistance zone around 110,464 USDT, where heavy selling pressure previously emerged.
The likely scenario is that the price forms a Lower High pattern and then breaks the uptrend line → confirming a bearish trend.
Potential support area: 101,236 USDT, where price previously reacted.
Strategy:
Priority is to wait for sell opportunities around the 110,000–110,500 zone if a clear reversal signal appears.
Target at 101,200 USDT. Stop-loss placed above the resistance zone at 111,700 USDT.
News Supporting the Bearish Outlook:
The SEC has delayed approval of the spot Ethereum ETF, triggering negative sentiment in the crypto market.
Capital is flowing out of the market due to expectations that the Fed will maintain high interest rates for a longer period.

BTCUSD SHOWING A GOOD UP MOVE WITH 1:7 RISK REWARD BTCUSD SHOWING A GOOD
UP MOVE WITH 1:7 RISK REWARD
DUE TO THESE REASON
A. its following a rectangle pattern that stocked the market
which preventing the market to move any one direction now it trying to break the strong resistant lable
B. after the break of this rectangle it will boost the market potential for break
C. also its resisting from a strong neckline the neckline also got weeker ald the price is ready to break in the outer region
all of these reason are indicating the same thing its ready for breakout BREAKOUT trading are follws good risk reward
please dont use more than one percentage of your capitalfollow risk reward and tradeing rules
that will help you to to become a bettertrader
thank you

BITCOIN - STRUCTURAL SHIFT AMID CORRECTION & LIQUIDITY TESTSymbol - BTCUSD
CMP - 1,05,634
Bitcoin is experiencing a recovery following a liquidity sweep in the 1,00,000 zone. Despite the broader bullish trend, the local technical outlook remains mixed.
Bitcoin is currently undergoing a shift in market structure, with a change in character observed around the 1,06,700 level and a breakdown of the bullish structure at 1,03,000 during a corrective phase. This downward movement is testing liquidity beneath the 1,00,700 support zone. Several factors contribute to the ongoing liquidation: notably, the unexpected market reaction to tensions between Donald Trump and Elon Musk, and the liquidation activities of large holders (whales), which appear to be repeating historical patterns.
While traders are actively buying back Bitcoin, the overall market structure remains technically bearish. Locally, a downtrend is present, and a countertrend move interpreted as a form of 'liquidity hunting' is currently developing.
A key area of interest lies between 1,05,900 and 1,06,700. The initial retest of this zone may result in a false breakout due to insufficient momentum for sustained upward movement following the strong buyback.
Resistance levels: 105900, 106720, 110400
Support levels: 103000, 101400, 100,000
Following a correction from the 1,05,900 level, which may target the 50% retracement of the recent trading range, the market could potentially re-enter a bullish phase, provided buyers manage to maintain price levels and prevent a drop to new local lows. In the short term, a decline from 1,05,900 to 1,03,000 is anticipated. However, if the price subsequently recovers to the 1,05,500–1,05,900 range, there may be an opportunity for further upward movement toward the 1,10,000 level.

BTC Decision Point – Are You Watching This?BTC Decision Point – Are You Watching This?
Bitcoin is reclaiming momentum after sweeping liquidity at $102.7K. It's now pushing toward major resistance at $106.1K.
But the real battle? The bearish OB at $107.2K–$108.9K — where price nuked last time.
✅ Break above = clear skies toward new ATHs
❌ Rejection = another trip to $102K or even Under $100K
🔁 Retweet if this helped
💬 Drop your bias below: Long or short?👇

Bearish Retest at Wedge ResistanceBitcoin is currently showing signs of weakness on the 1H chart after a clean rejection from the top of the falling wedge structure. The move aligns with a bearish retest of the dynamic EMA ribbon and local trendline resistance.
Price failed to break above the wedge resistance and is now pushing lower, suggesting bearish continuation toward the lower wedge boundary near $101.3K–$102K.
This short setup invalidates above $106K.
Rejection candle confirming local resistance
Target: $102K (mid-zone confluence)
SL: Above $106K (structure break)

Bullish Falling Wedge Breakout Within Ascending ChannelBitcoin is currently presenting a strong bullish setup on the 4H chart. Price has bounced from the lower boundary of a long-standing ascending channel, forming a falling wedge — a classic bullish continuation pattern.
The breakout from this wedge aligns with a key support level and suggests a potential move toward the upper resistance zone at $111.5K–$112.7K, which also aligns with the upper trendline of the broader ascending structure.
Momentum confirmation above $106K could accelerate the upside move.
Target zone: $111.5K–$112K
Invalid if price breaks below $104.5K
$BTCUSDT quick short setup. OPENED CRYPTOCAP:BTC Short
Stop Loss : High $106300
Target : $104k
$102.5k

BTCUSDT – Rebound from 104,200, recovery opportunity emergingBTCUSDT has bounced back from the 104,200 support zone with a potential double bottom pattern, signaling the return of buying pressure. The price is consolidating around the 106,000–107,000 area. If this zone holds, the probability of retesting the previous high at 110,500 is high.
The EMA34 and EMA89 are narrowing – a sign of weakening selling pressure.
Supporting news:
The Fed kept interest rates unchanged, U.S. CPI slightly declined, and capital inflows from ETFs like BlackRock are returning to the market, creating momentum for recovery.

BITCOIN ANALYSIS UPDATE — READ THIS CAREFULLY!🚨 BITCOIN ANALYSIS UPDATE — READ THIS CAREFULLY! 🚨
Hope you followed our last BTC analysis — and DID NOT open any longs at the top.
If you followed: Congrats — you either made big profits on the short, or at least saved your money by not longing.
✅ We clearly warned when BTC was around $110K — more correction was coming.
Result? Bitcoin is now 7% DOWN since that call.
❗ Now the situation is DANGEROUS:
👉 BTC broke my Bullish Order Flow at $105K.
👉 If this $105K support doesn’t hold soon → we may see a deep correction towards $90K.
$105K is the level to watch like a hawk.
👉 Iran-Israel news just accelerated the fall — but we already predicted this move before the news.
🚫 NEVER gamble with your hard-earned money.
✅ Always wait for solid confirmation before entering trades.
👉 Stay smart. Stay safe. Stay patient.
💬 Comment your thoughts below.
🔁 Forward this to your crypto friends — they NEED to see this!
BITCOIN ANALYSIS UPDATE — READ THIS CAREFULLY! BITCOIN ANALYSIS UPDATE — READ THIS CAREFULLY!
Hope you followed our last BTC analysis — and DID NOT open any longs at the top.
If you followed: Congrats — you either made big profits on the short, or at least saved your money by not longing.
We clearly warned when BTC was around $110K — more correction was coming.
Result? Bitcoin is now 7% DOWN since that call.
Now the situation is DANGEROUS:
👉 BTC broke my Bullish Order Flow at $105K.
👉 If this $105K support doesn’t hold soon → we may see a deep correction towards $90K.
$105K is the level to watch like a hawk.
Iran-Israel news just accelerated the fall — but we already predicted this move before the news.
🚫 NEVER gamble with your hard-earned money.
✅ Always wait for solid confirmation before entering trades.
Stay smart. Stay safe. Stay patient.
Comment your thoughts below.
Forward this to your crypto friends — they NEED to see this!

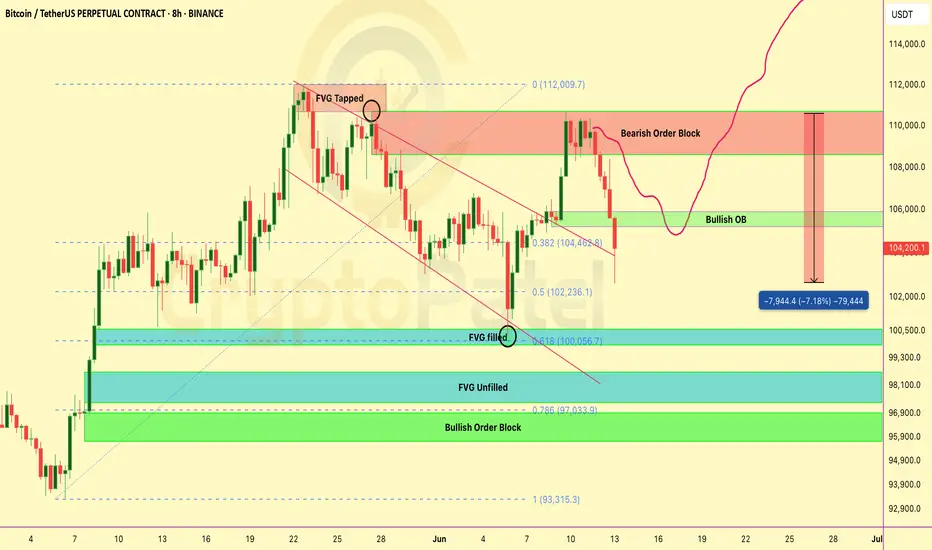
This BTC Pullback Could Be The Last Dip Before $120K+ — Are You #Bitcoin has just delivered a textbook breakout — but what comes next might surprise you. Let’s break it down: 👇
🔸 Bearish Order Block @ $109K–$110K
Price tapped into this zone and is currently reacting. Expect short-term volatility here.
🔸 FVG (Fair Value Gap) Filled + Tapped
A clean move back up filled the previous FVG — this typically signals strength but also invites sellers at OB zones.
🔸 Key Bullish Order Block @ $106K
If BTC pulls back, this zone will be crucial. A strong defense here could ignite the next leg up.
🔸 Fib Levels Aligned:
0.382 Fib @ ~$104.5K
0.5 Fib @ ~$102.2K
0.618 Fib & Bullish OB cluster @ ~$100K ( Filled )
Possible Play Ahead:
A dip toward $106K–$104K is healthy → watch for buyer reaction.
If CRYPTOCAP:BTC holds the $106K OB and bounces, a move back toward $112K+ ATH retest is very likely.
Big Picture:
The breakout from the descending channel + OB retest gives BTC strong bullish structure — as long as the $106K zone holds.
Are you ready for the next BTC move?
📈 Comment below: BULLISH or BEARISH?
🔄 Retweet to keep others in the loop!
NFA & DYOR

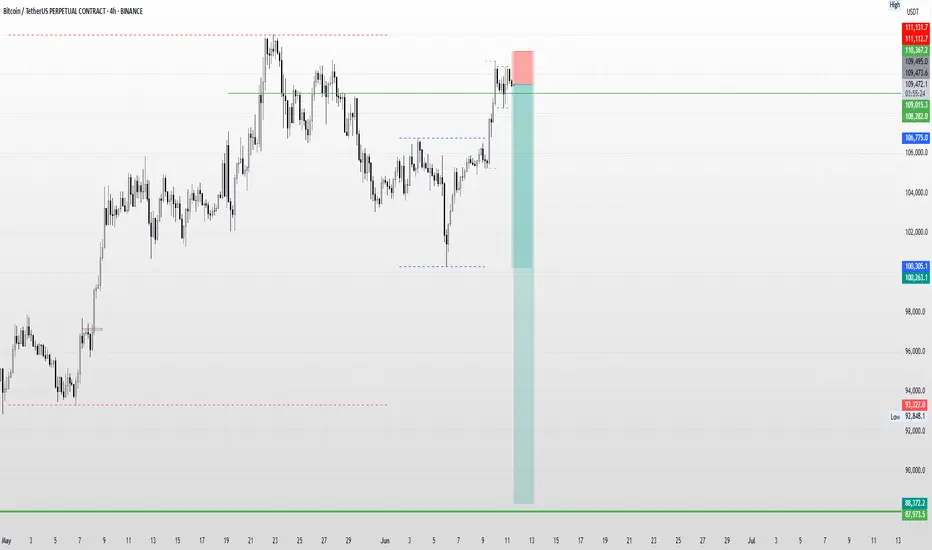
Danger Ahead? Bearish Signal Spotted on the Daily Timeframe!Price Action Analysis (Daily & Intraday)
A bearish pattern has formed on the Daily Timeframe, and early signs of execution are visible on the 1-hour chart, indicating a potential Double Top formation. If confirmed, the price may drop with an initial target around 100263. Should the bearish momentum continue, the next significant weekly support could be tested near 88372.
Caution:
This setup is considered risky, primarily because the higher timeframe (Monthly) still shows an overall uptrend. However, with a well-defined stop-loss above 16367 and proper risk management, the trade could offer a favorable risk-to-reward ratio.
Disclaimer:
Trading, especially in futures and options, involves a high degree of risk. Losses can exceed capital if not managed properly. This is not financial advice. Please do your own analysis or consult a certified financial advisor before making any investment decisions.
Technical Analysis – BTC/USD Technical Analysis – BTC/USD
📅 Date: June 11, 2025
🔍 Key Observations:
🔴 Resistance Zone – $110,000 to $111,800
Price has tested this resistance block twice (🔴 red arrows) and rejected both times, indicating strong selling pressure in this zone.
Rejection candles show long upper wicks, suggesting failed attempts by bulls to break above.
🟢 Support Zone – $101,800 to $103,500
This demand zone has been respected multiple times (🟢 green arrows), showing a solid base for potential bounces.
Price action previously rallied strongly after touching this level.
📦 Supply to Demand Play
Price made a sharp bullish move from support to resistance (📘 blue box shows the impulsive move).
After reaching resistance, the price is failing to break above, indicating possible exhaustion of bullish momentum.
📉 Potential Move:
🔽 Short-Term Bearish Bias
If price fails to hold current levels and breaks below the small consolidation (after blue box), we may see a drop to ~$105,583 (🔵 purple line = key level).
If that breaks, next likely destination is the support zone around $102,000 (⬇️ downward arrow path).
⚠️ Risk Notes:
🔁 Watch for any false breakouts or liquidity grabs above resistance.
📉 If bearish momentum increases below $105,583, sellers may take control in the short term.
✅ Trade Idea (Hypothetical):
Sell/Short near resistance (⚠️ confirmation needed like bearish engulfing or failed breakout)
Target 1: $105,583
Target 2: $102,000 zone
Stop-loss: Above $111,800 (invalidates setup)
📌 Summary:
BTC/USD is currently stuck between a well-defined resistance and support range. Unless bulls break above $111,800 with strong momentum, the structure favors a potential pullback toward the demand zone. ⚖️

BTCUSDT – Strong rebound, waiting to break previous highsBitcoin is maintaining a fairly positive uptrend after bouncing from the support zone around 105,245 USDT – a confluence area of the EMA89 and previous lows on the 8H chart. Currently, the price has approached the key resistance area between 110,192 and 111,931, which has previously rejected bullish attempts twice.
Price action suggests that BTC may temporarily pull back to gather momentum before continuing to test the green resistance zone around 113,331. A short-term accumulation pattern is forming with a higher-low structure – a good sign for buyers as long as the price holds above the 106,000 area.
On the news front, investor sentiment has improved following weaker U.S. jobs data, reinforcing expectations that the Fed may cut interest rates sooner. This has prompted a return of safe-haven flows to the crypto market, adding fuel to BTC’s upward momentum.

Inverse Head and Shoulders Breakout Signals Bullish The chart under review presents a classic Inverse Head and Shoulders pattern, a reliable and widely recognized bullish reversal formation in technical analysis. This structure typically forms after a downtrend, indicating a potential shift in market sentiment from bearish to bullish.
The pattern is composed of:
Left Shoulder: A modest price decline followed by a temporary upward correction.
Head: A deeper price decline forming the lowest point in the pattern.
Right Shoulder: A higher low that mirrors the left shoulder, followed by another upward movement.
The neckline, which acts as a critical resistance level, is clearly illustrated at approximately 106,840.37 USDT. A confirmed breakout above this neckline suggests the completion of the reversal pattern and validates the potential for a sustained bullish movement.
---
2. Breakout Confirmation
The current price action confirms a successful breakout above the neckline, with the market currently trading around 107,586.58 USDT. This breakout is a key signal for bullish continuation, provided it is supported by increased volume and follow-through price action.
From a technical standpoint, the breakout is reinforced by:
A clean violation of neckline resistance
Price consolidation near breakout zone before a strong upward thrust
Higher lows preceding the breakout, indicative of growing buying pressure
This confluence of technical signals strengthens the case for an upward price trajectory in the near term.
3. Projected Price Targets
Upon confirmation of the Inverse Head and Shoulders breakout, target levels can be derived using the measured move technique. This involves projecting the vertical distance from the head to the neckline upward from the breakout point.
Target 1 (Initial Resistance):
108,878.29 USDT – This level represents a potential short-term resistance where price may consolidate or retrace slightly before continuing.
Target 2 (Measured Move Completion):
110,752.24 USDT – This is the ultimate price target derived from the height of the head-to-neckline structure. Reaching this level would represent the full realization of the reversal patt
4. Key Support and Risk Levels
Risk management is a critical component of any trading strategy. The following support levels should be closely monitored:
106,840.37 USDT (Neckline Support):
Former resistance turned support. Holding above this level post-breakout is essential for sustaining bullish momentum.
105,997.09 USDT:
Acts as a secondary support level and potential stop-loss region for conservative traders.
If price fails to hold above the neckline and falls back below these levels, the breakout could be classified as a false breakout, warranting caution.
5. Strategic Implications for Traders
This setup provides a favorable risk-to-reward ratio for long entries, particularly for traders seeking to capitalize on momentum-based patterns. An optimal trading approach could involve:
Entry: Near the neckline breakout or on a minor retest of 106,840.37 USDT
Stop-Loss: Below 105,997.09 USDT or under the right shoulder to account for volatility
Take-Profit Zones: Partial profits near 108,878.29 USDT, with final target at 110,752.24 USDT
6. Final Remarks
This chart illustrates a textbook example of a bullish reversal pattern in play. While the technical outlook is favorable, traders should remain cautious of potential invalidation scenarios, especially in highly volatile or news-driven markets. Confirmation through volume analysis and supportive macro/fundamental conditions can further enhance confidence in the bullish thesis.
Overall, the current setup indicates a well-structured opportunity for upward price movement, with a clearly defined entry, risk, and reward framework.
Let me know if you'd like this tailored for a trading journal, client report, or automated strategy setup.

Bitcoin is just 2% away from a new all-time high —will it break?Bitcoin is just 2% away from a new all-time high — will it break or fake? 🚀
BTC is currently trading near $109K–$110K, only 2% below the $112K ATH level.
Strong supports: $94,000 / $80,000
Bullish Case:
If BTC breaks $110K–$112K with strong volume + a bullish weekly close → we could see a rally toward: $135K → $150K
Bearish Case:
If BTC rejects at $110K–$112K, a deep retracement below $100K is possible. Watch for strong support at $100K and $80K levels.
My Personal Take:
I'm bullish overall — but since we’re this close to ATH, I’m opening a short trade with 3% stop loss targeting near $100K.
👉 Not financial advice — do your own research. The crypto market is highly volatile.
Watch this level closely — next big BTC move may be starting NOW. 👀

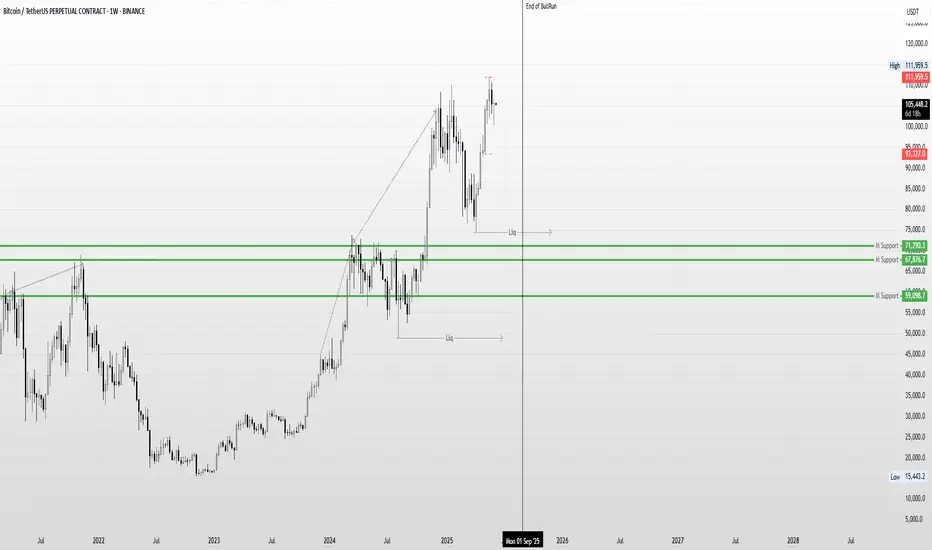
Bitcoin Weekly Analysis: Potential Exhaustion in Price ActionWhile Bitcoin continues to form Higher Highs on the Weekly Time Frame, the overall price action appears to be gradually losing momentum. From my perspective, this could be an early sign of exhaustion, suggesting that the current bullish trend may be nearing its end.
If this weakening momentum continues, there's a possibility that a broader correction or even the beginning of a bear market could unfold post-September. In such a scenario, the market may attempt to hunt significant downside liquidity levels, potentially targeting zones around $74,000 and even as low as $48,000.
Of course, this is purely a personal prediction based on current price structure and market behavior. Only time will reveal how accurate this outlook turns out to be.
Disclaimer :
This content is for informational and educational purposes only and does not constitute financial or investment advice. The views expressed are based on personal analysis and should not be considered as a recommendation to buy, sell, or hold any asset. Cryptocurrency markets are highly volatile, and past performance is not indicative of future results. Always do your own research (DYOR) and consult with a licensed financial advisor before making any investment decisions.
Bitcoin Bulls vs Bears — Battle Zones Mapped Out#Bitcoin Bulls vs Bears — Battle Zones Mapped Out
🔰 $105K–$106.7K = Bearish Order Block:
Below this zone = CRYPTOCAP:BTC stays bearish unless HTF closes above $106.7K
🔰 Next Moves:
▪️ Likely retest $105K–$106K before next leg ↓
▪️ Target: $97K–$95K zone
🔰 Key Levels:
✅ Holding 0.618 Fib (support)
✅ Unfilled FVG: $97K–$98.3K
✅ Bullish OBs: $95.7K–$97K | $93.5K–$94.7K
If $97,000 holds strong → Expect BIG bounce!

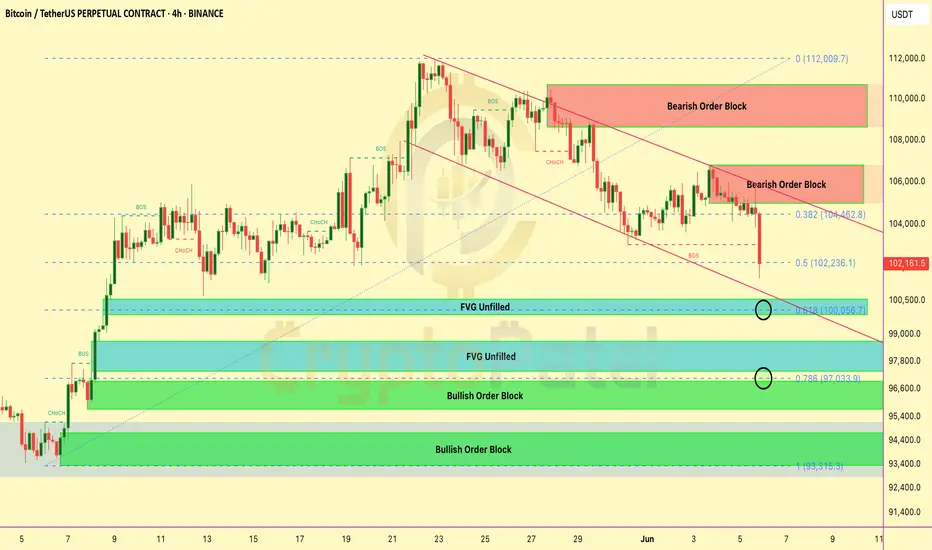
BTC Breakdown or Bounce? Key Levels You Need to Watch!BTC Breakdown or Bounce? Key Levels You Need to Watch!
#Bitcoin 4H Chart Analysis – SMC Overview:
BTC is currently in a short-term downtrend, respecting a descending channel and showing clear bearish structure.
🔴 Bearish Signs:
Price rejected from 2 major Bearish Order Blocks:
▶️ $106K–$104K
▶️ $111K–$109K
Breaks of Structure (BOS) and Change of Character (CHoCH) confirm trend shift to bearish Couldn’t hold the 0.382 Fibonacci level at $104.4K — now testing the 0.5 Fib at $102.2K
🟢 Key Support Zones (Potential Reversal Areas):
1️⃣ $100K Zone
✔️ 0.618 Fib level
✔️ Unfilled Fair Value Gap (FVG)
🔍 Possible bullish reaction from here
2️⃣ $97K Zone
✔️ 0.786 Fib
✔️ Bullish Order Block (OB)
✔️ Another FVG
💥 Strong confluence — good probability of reversal
3️⃣ $93K Zone
✔️ Deep Bullish OB
🛡️ Last strong support if $97K fails
🔼 If bulls reclaim control: We need a clear CHoCH above $104.5K to confirm bullish shift
⚠️ Tip: Mark these zones. Use alerts. Let the price come to you — don’t force trades.
📢 Share if useful & stay updated
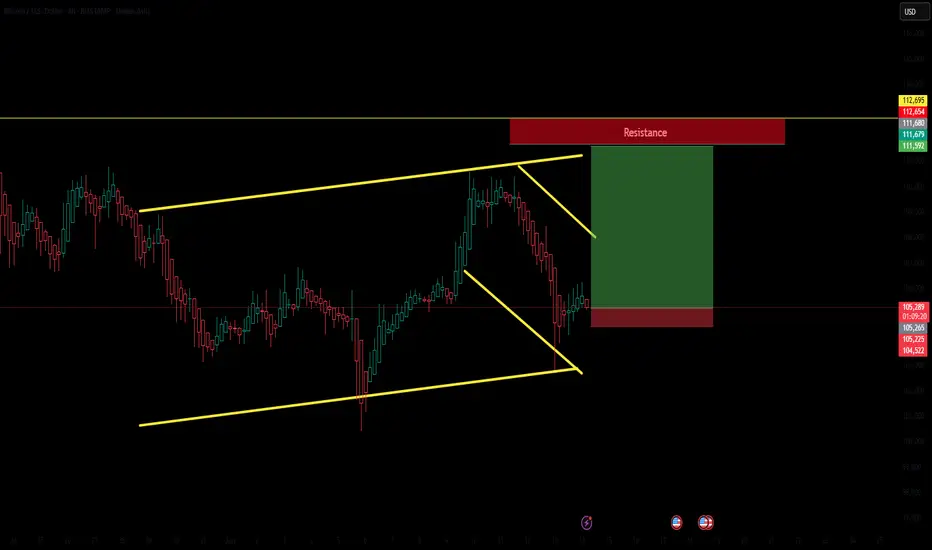
BTCUSDT – Squeezed enough, ready to explode?Bitcoin is currently trading within a converging triangle pattern – a setup every trader knows often signals an imminent breakout. The price is sitting between the EMA 34 and EMA 89, consolidating right above the long-term ascending trendline, indicating that buying pressure is still quietly in control.
The 105,000 – 106,000 USDT area is the key resistance zone to watch. If BTC breaks through this level decisively, it could trigger a new bullish wave aiming for 110,000+.
On the news front, market sentiment has turned optimistic again after the SEC Chairman hinted at the possibility of approving more Bitcoin ETFs in the upcoming quarter. This has given a strong psychological boost to the buying side.

BITCOIN WARNING – $104K IS KEY🚨 BITCOIN WARNING – $104K IS KEY
#Bitcoin is showing signs of weakness on the 4H chart! Let’s break it down:
🔻 Trend Shift Detected:
Recent CHoCH and BOS suggest the uptrend is over. Market structure has turned bearish.
Key Levels to Watch:
▪️ Support at $104K is being tested again. If it breaks, we may see a drop.
▪️ Next major targets:
➤ $100.5K (Unfilled Fair Value Gap)
➤ $98K – Strong demand zone
➤ $96.6K – Bullish Order Block + FVG confluence
Why It Matters:
▪️ Price rejected hard from the $107K zone (supply + FVG)
▪️ Liquidity was grabbed from Equal Highs
▪️ Now it’s hunting lower liquidity near $100K
⚠️ If $104K fails, get ready for a quick drop to $100.5K or even $96.6K
Plan: Short-term bearish unless BTC breaks back above $106K with volume.
Stay alert — volatility incoming!
